


Serviços Personalizados
Journal
Artigo
 texto em
  Inglês (pdf)
 Artigo em XML
 Referências do artigo
 Enviar este artigo por email
Indicadores
-
 Citado por SciELO
 -
 Acessos
Links relacionados
-
 Similares em
SciELO
Similares em
SciELO
Compartilhar

 Permalink
Revista mexicana de ciencias agrícolas
versão impressa ISSN 2007-0934
Rev. Mex. Cienc. Agríc vol.11 no.3 Texcoco Abr./Mai. 2020 Epub 30-Ago-2021
https://doi.org/10.29312/remexca.v11i3.2083
Articles
Water quality for agricultural use of the San Pedro River, Nayarit
1Posgrado en Ciencias Biológico Agropecuarias-Universidad Autónoma de Nayarit. Carretera Tepic-Compostela km 9, Xalisco, Nayarit, México. CP. 63155. (ogmartinez.r@gmail.com).
2Unidad Académica de Agricultura-Posgrado en Ciencias Biológico Agropecuarias-Universidad Autónoma de Nayarit. Carretera Tepic-Compostela km 9, Xalisco, Nayarit, México. CP. 63155. (ccruzc2006@yahoo.com.mx; iranbojorquez@hotmail.com; digapar@gmail.com).
3Departamento de Hidrociencias-Colegio de Postgraduados. Carretera México-Texcoco km 36.5, Montecillo, Texcoco, Estado de México. CP. 56230. (manueloe@colpos.mx).
The study area is of fluvian delta formation, with a predominance of cambisol and fluvisole soils. The main crops in the area are beans, corn, sorghum, tobacco and tomatillo. These are watered with water from the San Pedro River. Surface water, when it contains high concentrations of sodium or bicarbonate, can cause adverse effects in agriculture. With the objective of evaluating these effects, nine sampling sites were established in the riverbed and four samplings were carried out over a period of two years, in a rainy and dry season each year. The pH, EC, anions and major cations were determined, the hydrogeochemical type was established and the RAS, RASº, RASaj, PSI, CSR and the saturation index were calculated. In the section of the river from El Rosarito to El Mezcal, the water is bicarbonated sodium-calcium-magnesium and from Mexcaltitan to Boca de Camichin, it was chlorinated-sodium. The RAS in its different conceptualizations for the first section were from 0.38 to 1.58, the EC ranged between 131-367 µS cm-1 and the PSI<3%; while, for the last section, the RAS varied between 9.06-161.16, the EC between 2 350-4 3130 µS cm-1 and the PSI between 6.16-73.14%. The waters from the San Pedro de El Rosario to El Mezcal river turned out to be excellent to good quality. Chlorinated-sodium waters are not suitable for agricultural use.
Keywords: adjusted RAS; hydrogeochemistry; saturation index
El área de estudio es de formación fluvio deltaica, con predominio de suelos cambisoles y fluvisoles. Los principales cultivos en la zona son frijol, maíz, sorgo, tabaco y tomatillo. Estos son regados con agua del río San Pedro. El agua superficial, cuando contiene altas concentraciones de sodio o bicarbonato, puede ocasionar efectos adversos en la agricultura. Con el objetivo de evaluar estos efectos, se establecieron nueve sitios de muestreo en el cauce y se realizaron cuatro muestreos en un periodo de dos años, en temporal de lluvia y sequía de cada año. Se determinó el pH, CE, aniones y cationes mayores, se estableció el tipo hidrogeoquímico y se calculó la RAS, RASº, RASaj, PSI, CSR y el índice de saturación. En el tramo del río desde El Rosarito a El Mezcal, el agua es de tipo sódico-cálcico-magnésico bicarbonatada y de Mexcaltitán a Boca de Camichín, ésta fue clorurada-sódica. La RAS en sus diferentes conceptualizaciones para el primer tramo fueron de 0.38 a 1.58, la CE osciló entre 131-367 µS cm-1 y el PSI< 3%; mientras que, para el último tramo, la RAS varío entre 9.06-161.16, la CE entre 2 350-4 3130 µS cm-1 y el PSI entre 6.16-73.14%. Las aguas del río San Pedro de El Rosario a El Mezcal resultaron ser de excelente a buena calidad. Las aguas cloruradas-sódicas no son aptas para uso agrícola.
Palabras clave: hidrogeoquímica; índice de saturación; RAS ajustado
Introduction
The San Pedro river basin, located in the states of Durango, Zacatecas and Nayarit, encompasses the Sierra Madre Occidental and the Pacific Coastal Plain physiographic provinces. The first is one of the great siliceous igneous provinces of the Cretaceous-Cenozoic, where the main types of rocks are andesitic, dacitic-rhyolitic, ignimbrite and alkaline basalts, which lie on a Pre-Cambrian, Paleozoic and Mesozoic basement; in its central zone, all the rocks are calcalcaline and their composition varies from diorite to granite, with granidioritic being the dominant one (Ferrari et al., 2005).
The Pacific Coastal Plain is a deltaic fluvial system formed by sediments from the San Pedro, Santiago and Acaponeta rivers and is related to marine transgressions during the late Pleistocene and Holocene (Curray et al., 1969). The rocks that make up this plain are extrusive igneous rocks from the Tertiary, alluvial and marshy deposits, made up of sand, gravel, silt and clay from the Quaternary (Ferrari et al., 2005). The main soils are cambisols and fluvisols (Bojorquez et al., 2006).
The Coastal Plain is of great importance because it has a high agricultural activity, in the study area 125 856 ha are cultivated and of which 85% are irrigated, and it is where the water from the San Pedro river is used for the Irrigation of beans (Phaseolus vulgaris), maize (Zea mayz), sorghum (Sorghum bicolor L. Moench), tobacco (Nicotiana tabacum L.) and tomatillo (Physalis ixocarpa Brot. ex Horn.). When this water is used for this purpose, it is important to consider the quality, since according to this is the management that must be given to prevent the problems that could cause.
The elements contained in natural waters come from the dissolution or weathering of rocks and soils, and are transported by surface currents and deposited in the soils of the lower parts, either naturally or through irrigation (Can-Chulim et al., 2008). From the ionic composition of the water, various criteria, index or associations are used, which allow classifying them, evaluating risks and determining their quality for agriculture.
Among these are the danger of salinization and that of sodification by means of the sodium adsorption ratio (RAS) and the percentage of exchangeable sodium (PSI), residual sodium carbonate (CSR) and others (Mandal et al., 2019). Most focus on the Na+ content, on the concentration of Ca2+, Mg2+ and on CO3 2- and HCO3 -. If the concentration of Na+ is high, the danger of alkalization is high, this is magnified when there are high contents of CO3 2- and HCO3 -, due to the tendency of these ions to form precipitates with Ca2+ and Mg2+, in addition to being in suspension the most soluble substances, including Na2CO3.
Yaron and Tomas (1968) demonstrated that high Na+ content in irrigation water considerably increases the PSI and when this happens they decrease the physical, chemical and nutritional properties of the soil. In this study, a hydrogeochemical classification was made, the quality of the water for irrigation was evaluated using the RAS, PSI, CSR indices, and the carbonate precipitation process using the San Pedro River water saturation index in Nayarit; with the aim of evaluating the adverse effects that the use of this water can cause in agriculture.
Materials and methods
Description of the study area
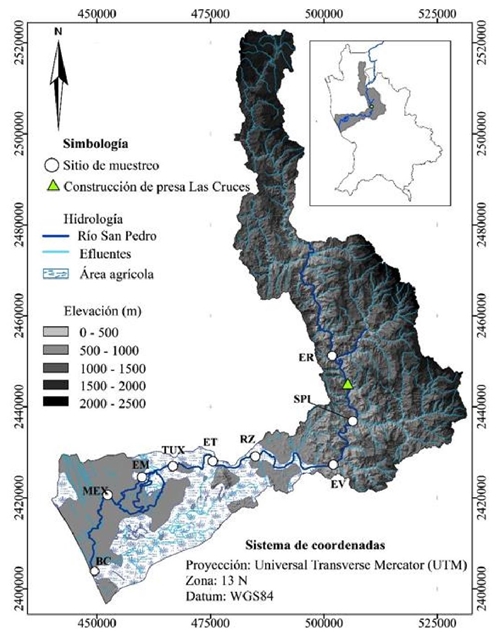
The San Pedro River is born in the Michis mountain range, in Durango, at 3 000 masl and empties into the Pacific Ocean, its channel crosses the Sierra Madre Occidental and Pacific Coastal Plain physiographic provinces. Its basin has an area of 29 366.53 km2 (INEGI, 2010). The study area is located in the Pacific Coastal Plain, San Pedro-Tuxpan sub-basin; which includes part of the municipalities of Rosamorada and Santiago Ixcuintla, completely Ruiz and Tuxpan, in Nayarit; it has an area of 3 018.71 km2; the subhumid warm climate (Aw) predominates with an annual average temperature of 23.8 °C, a maximum of 26 °C and a minimum of 20 °C, with the highest temperatures from May to October and rainfall from June to October with an annual average of 1 555.8 mm. (DOF, 2015).
Sampling design
Nine sampling sites were established on the bed of the San Pedro river, located according to the physiography, the communication routes and the agricultural area of the basin. The sites were El Rosarito (ER), San Pedro Ixcatan (SPI), El Venado (EV), Ruiz (RZ), El Tamarindo (ET), Tuxpan (TUX), El Mezcal (EM), Mexcaltitan (MEX) and Boca de Camichin (BC) (Figure 1).
Four samplings were carried out in the months of October 2016, April 2017, December 2017 and May 2018. Each site was georeferenced using a GPS with UTM coordinate system. Due to the formation processes that affect the basin, from Rosarito to Mezcal they are considered the first section and are waters from the natural channel of the San Pedro river. The Mexcaltitan and Boca de Camichin sites, being a transition zone between inland waters and marine intrusion waters, were considered the second section. Two samples were taken at each site, with 1 L polyethylene containers.
Chemical analysis
They were determined in triplicate, based on the APHA methods (2012): pH with a Thermo Scientific Orion Star A211 potentiometer; EC using an Oakton CON 700 conductivity meter; Ca2+ and Mg by titration with EDTA; Na+ and K+ by the photometric flame emission method with a Cole-Parmer Photometer; CO3 2- and HCO3 - by titration with sulfuric acid; SO4 2- by turbidimetry; and Cl- by titration with silver nitrate according to the NMX-AA-073-SCFI-2001 standard.
Analysis of data
Hydrogeochemical analysis. To establish the hydrogeochemical facies, their evolution and the causes that influence the ionic composition of the waters along the San Pedro river basin, the Piper diagram was used (Güler et al., 2002).
Quality parameters
Physical-chemical regime or pH. For agricultural use the desirable pH is between 5.5 and 6.5 (Steiner, 1968). Although according to water quality guidelines, a pH range between 6.5 and 8.5 is normal (Krishna et al., 2017).
Electric conductivity. The waters were classified based on electrical conductivity (EC) according to Richards (1990), who establishes that to prevent soil salinization by the application of irrigation the water is classified as: low salinity water C1:<250 µS cm-1), medium salinity water (C2: 250-750 µS cm-1), high salinity water (C3:750-2250 µS cm-1), very high salinity water (C4: 2 250-5 000 µS cm-1) and water of exceptionally high salinity (C5:>5 000 µS cm-1).
Sodium content. This evaluation was performed using the sodium adsorption ratio (RAS). This index foresees the risk of sodification and, consequently, the possible effects that waters can have on the physical properties of soils due to the effects of Na+ when precipitating calcite (CaCO3). The RAS values were determined in their different conceptualizations: original RAS (RASor), corrected RAS (RAS°) and adjusted RAS (RASaj). Using the equations.
Where: Na+, Ca2+ and Mg2+ are expressed in mmolc L-1. Cax 2+ represents the content of Ca in irrigation water in mmolc L-1, corrected for the salinity of the water (EC), for the content of bicarbonate ions in relation to its own content of calcium (HCO3 -/Ca2+) and for the partial pressure of carbon dioxide (CO2) exerted on the first millimeters of the soil (p= 0.0007 atm) (Suárez, 1981).
pHc is the theoretical pH in equilibrium with calcite, and 8.4 is
approximately the pH of a non-sodium soil in equilibrium with calcite.
To determine the ionic strength of the waters of the San Pedro river, the
equation
The RAS in its different conceptualizations are classified into four classes: low sodium water (S1), medium sodium water (S2), high sodium water (S3) and very high sodium water (S4).
Interchangeable sodium percentage (PSI). According to Sposito and Mattigod (1977), if it is assumed that Ca2+ and Mg2+ are chemically the same, in what refers to the exchange of cations, and that the exchangeable cations in the soil are only Na+, Ca2+ and Mg2+, the equation stated as.
The values of RASor, RAS° and RASaj were taken from the water of the San Pedro river and the PSI in the soils was calculated, this, under conditions of equilibrium between the irrigation water and the soil. To obtain the PSImin and PSImax, values, the KG ion selectivity constants were those used by Velazquez-Machuca et al. (2002) KGmin = 0.0072444 and KGmax = 0.0168999 that correspond to the soils with sandy-clayey-silty and clayey texture, respectively.
Residual sodium carbonate (CSR). When irrigation water has high
concentrations of HCO3
- and which is also higher than the concentration of
Ca2+ plus Mg2+, there is a possibility that sodium
carbonate (Na2CO3) will form. Due to its high
solubility, Na2CO3 can remain in solution, even after
Ca2+ and Mg2+ carbonates have precipitated as the
soil solution becomes more concentrated (Castellon-Gomez et al., 2015). The CSR index
was calculated using the equation.
Where: Ca2+, Mg2+, CO3 2- and HCO3 - are expressed in mmolc L-1. Values <1.25 are classified as good quality, between 1.25 and 2.5 as conditioned and >2.5 is not recommended (Nishanthiny et al., 2010). Negative values indicate that there are no problem and positive values indicate that Ca2+ and Mg2+ precipitate, and the higher the index, the greater the magnitude of the precipitation.
Saturation index. When irrigation waters have appreciable concentrations of
bicarbonates, a fraction of this constituent precipitates into the soil as
CaCO3, according to the equation:
Results and discussion
Hydrogeochemical classification. Using the Piper diagram (Figure 2), MEX and BC are classified as chlorinated-sodium (Cl-Na) and are characterized by the intrusion of seawater, since they are in a transition zone between continental and ocean waters. In the ER to EM sites, the hydrogeochemical type was sodium-calcium-magnesium-bicarbonate (Na-Ca-Mg-HCO3). According to Madrigal-Solis et al. (2017), bicarbonated waters generally correspond to recent water, which has had a short time of permanence and interaction with rocks, this absence of changes was related to the altitudinal gradient that does not allow long periods of contact with geological material.
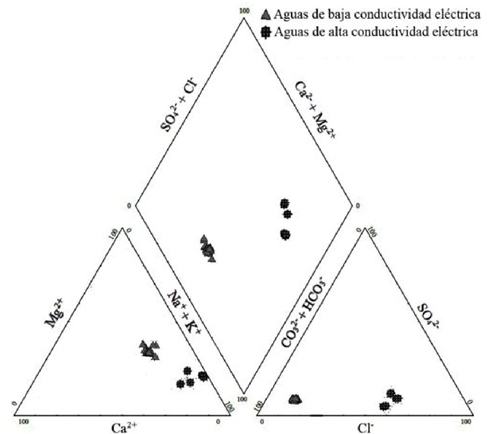
The ionic composition obeys the following order: Na+ + K+ > Mg2+ > Ca2+; for anions it was HCO3 - + CO3 2- > Cl- > SO4 2-, while in MEX and BC it was Cl- > HCO3 - + CO3 2- > SO4 2- (Table 1). Low ionic concentrations are due to the silicate material being insoluble. The alkaline behavior is caused by the ignimbrite rocks and alkaline basalts of the Sierra Madre Occidental. Based on Vidal-Solano et al. (2005), during post-subduction magmatism, ignimbrites in their composition have high iron and alkali contents up to Na2O+K2O= 8-10%, which explains the sodium behavior of water; also, according to Aranda-Gómez et al. (2005), the SMO basaltic rocks are rich in MgO and SiO2. Therefore, Mg2+ is one of the cations with the highest content.
Table 1 Ionic composition of the water of the San Pedro river in Nayarit.
pH |
CE (µS cm-1) |
Class |
Ca2+ |
Mg2 |
Na+ |
K+ |
Ʃ |
CO32- |
HCO3- |
Cl- |
SO42- |
Ʃ |
|
Error (%) |
||
(mmolc L-1) |
|
|||||||||||||||
|
|
|
|
Sampling 1 October 2016, rainy season |
||||||||||||
8 |
157 |
C1 |
0.32 |
0.5 |
0.65 |
0.06 |
1.53 |
0 |
1.18 |
0.19 |
0.12 |
1.49 |
|
1.32 |
||
7.7 |
141 |
C1 |
0.29 |
0.45 |
0.59 |
0.05 |
1.38 |
0 |
1.07 |
0.17 |
0.11 |
1.35 |
|
1.09 |
||
7.8 |
131 |
C1 |
0.27 |
0.42 |
0.55 |
0.04 |
1.28 |
0 |
0.97 |
0.18 |
0.1 |
1.25 |
|
1.19 |
||
7.8 |
139 |
C1 |
0.29 |
0.45 |
0.58 |
0.04 |
1.36 |
0 |
1.02 |
0.19 |
0.11 |
1.32 |
|
1.49 |
||
7.6 |
147 |
C1 |
0.3 |
0.47 |
0.62 |
0.05 |
1.44 |
0 |
1.1 |
0.18 |
0.12 |
1.4 |
|
1.41 |
||
7.4 |
158 |
C1 |
0.33 |
0.51 |
0.66 |
0.05 |
1.55 |
0 |
1.15 |
0.22 |
0.13 |
1.5 |
|
1.64 |
||
7.4 |
184 |
C1 |
0.38 |
0.59 |
0.77 |
0.06 |
1.8 |
0 |
1.34 |
0.26 |
0.15 |
1.75 |
|
1.41 |
||
7.4 |
2530 |
C4 |
2.45 |
4.4 |
16.77 |
1.12 |
24.74 |
0 |
7.73 |
13.53 |
2.84 |
24.1 |
|
1.31 |
||
7.3 |
23605 |
C5 |
5.57 |
49.8 |
172.6 |
2.88 |
230.8 |
0 |
87.36 |
126.2 |
11.26 |
224.8 |
|
1.31 |
||
|
|
|
Sampling 2 April 2017, drought season |
|||||||||||||
8.4 |
297 |
C2 |
0.6 |
0.95 |
1.24 |
0.11 |
2.9 |
0.12 |
2.12 |
0.36 |
0.23 |
2.83 |
|
1.22 |
||
8.5 |
276 |
C2 |
0.58 |
0.96 |
1.06 |
0.1 |
2.7 |
0.15 |
1.93 |
0.31 |
0.23 |
2.62 |
|
1.5 |
||
8.5 |
266 |
C2 |
0.56 |
0.88 |
1.06 |
0.1 |
2.6 |
0.14 |
1.85 |
0.34 |
0.21 |
2.54 |
|
1.17 |
||
8.5 |
237 |
C2 |
0.52 |
0.8 |
0.91 |
0.09 |
2.32 |
0.12 |
1.65 |
0.28 |
0.2 |
2.25 |
|
1.53 |
||
8.4 |
254 |
C2 |
0.56 |
0.82 |
1.01 |
0.09 |
2.48 |
0.14 |
1.74 |
0.32 |
0.2 |
2.4 |
|
1.64 |
||
8 |
314 |
C2 |
0.66 |
1.16 |
1.13 |
0.12 |
3.07 |
0 |
2.32 |
0.4 |
0.26 |
2.98 |
|
1.49 |
||
8 |
367 |
C2 |
0.78 |
1.35 |
1.32 |
0.14 |
3.59 |
0 |
2.69 |
0.5 |
0.3 |
3.49 |
|
1.41 |
||
7.6 |
4010 |
C4 |
3.87 |
6.95 |
26.62 |
1.77 |
39.21 |
0 |
12.3 |
21.38 |
4.49 |
38.17 |
|
1.34 |
||
7.4 |
35367 |
C5 |
7.36 |
70.7 |
263.5 |
4.32 |
345.8 |
0 |
131 |
188.9 |
16.89 |
336.9 |
|
1.31 |
||
|
|
|
Sampling 3 December 2017, Rainy season |
|||||||||||||
7.5 |
210 |
C1 |
0.44 |
0.68 |
0.84 |
0.09 |
2.05 |
0 |
1.55 |
0.27 |
0.18 |
2 |
|
1.23 |
||
7.7 |
190 |
C1 |
0.39 |
0.61 |
0.78 |
0.08 |
1.86 |
0 |
1.41 |
0.24 |
0.16 |
1.81 |
|
1.36 |
||
7.6 |
180 |
C1 |
0.39 |
0.59 |
0.71 |
0.07 |
1.76 |
0 |
1.34 |
0.22 |
0.14 |
1.7 |
|
1.73 |
||
7.8 |
190 |
C1 |
0.36 |
0.58 |
0.85 |
0.07 |
1.86 |
0 |
1.42 |
0.23 |
0.15 |
1.8 |
|
1.64 |
||
7.5 |
200 |
C1 |
0.41 |
0.64 |
0.83 |
0.08 |
1.96 |
0 |
1.5 |
0.24 |
0.15 |
1.89 |
|
1.82 |
||
7.4 |
210 |
C1 |
0.44 |
0.69 |
0.82 |
0.1 |
2.05 |
0 |
1.58 |
0.25 |
0.16 |
1.99 |
|
1.49 |
||
7.3 |
210 |
C1 |
0.42 |
0.7 |
0.83 |
0.11 |
2.06 |
0 |
1.58 |
0.28 |
0.15 |
2.01 |
|
1.47 |
||
7.3 |
3440 |
C4 |
4.98 |
5.67 |
21.43 |
1.56 |
33.64 |
0 |
10.18 |
19.62 |
2.92 |
32.72 |
|
1.39 |
||
7.5 |
43130 |
C5 |
8.9 |
86.25 |
321.3 |
5.28 |
421.7 |
0 |
159.6 |
230.5 |
20.6 |
410.8 |
|
1.32 |
||
|
|
|
Sampling 4 May 2018, drought season |
|||||||||||||
8.5 |
290 |
C2 |
0.56 |
0.98 |
1.17 |
0.13 |
2.84 |
0.12 |
2.03 |
0.37 |
0.25 |
2.77 |
|
1.25 |
||
8.6 |
270 |
C2 |
0.42 |
0.98 |
1.11 |
0.13 |
2.64 |
0.12 |
1.87 |
0.35 |
0.23 |
2.57 |
|
1.34 |
||
8.7 |
260 |
C2 |
0.55 |
0.84 |
1.04 |
0.11 |
2.54 |
0.18 |
1.73 |
0.33 |
0.22 |
2.46 |
|
1.6 |
||
8.6 |
230 |
C1 |
0.46 |
0.75 |
0.94 |
0.1 |
2.25 |
0.16 |
1.53 |
0.3 |
0.2 |
2.19 |
|
1.35 |
||
8.9 |
250 |
C2 |
0.42 |
0.91 |
1 |
0.11 |
2.44 |
0.18 |
1.7 |
0.29 |
0.2 |
2.37 |
|
1.46 |
||
7.7 |
290 |
C2 |
0.61 |
0.94 |
1.17 |
0.12 |
2.84 |
0 |
2.15 |
0.37 |
0.25 |
2.77 |
|
1.25 |
||
7.8 |
290 |
C2 |
0.59 |
0.95 |
1.18 |
0.12 |
2.84 |
0 |
2.14 |
0.37 |
0.25 |
2.76 |
|
1.43 |
||
7.8 |
16330 |
C5 |
12.98 |
37.61 |
98.69 |
9.41 |
158.7 |
0 |
46.45 |
93.2 |
13.87 |
153.5 |
|
1.66 |
||
7.7 |
43820 |
C5 |
9.08 |
87.98 |
321.9 |
5.39 |
424.4 |
0 |
157.1 |
235.2 |
21.01 |
413.3 |
|
1.32 |
||
ID= identification (sampling site); ER= El Rosarito; SPI= San Pedro Ixcatan; EV= El Venado; RZ= Ruiz; ET= El Tamarindo; TUX= Tuxpan; EM= El Mezcal; MEX= Mexcaltitan; BC= Boca de Camichin.
Physical-chemical regime (pH). For the ER-EM section, in the rainy season, waters were obtained from neutral to moderately alkaline pH, with values from 7.3 to 8. During the dry season, the pH was from moderately alkaline to strongly alkaline, with values from 7.7 to 8.9, where the highest results were obtained in the fourth sampling. For the MEX and BC sampling sites, the pH turned out to be neutral to mildly alkaline, in MEX the pHmin and pHmax were 7.3 and 7.8, and in BC 7.3 and 7.7 (Table 1).
Most of the salts derive from a strong base like Na+, K+, Ca2+ and Mg2+ and a weak acid like CO3 2- and HCO3 -, according to Raviolo and Farre (2017) the hydrolysis of these produces basic aqueous solutions, while the NaCl and MgSO4 derived from a strong base with a strong acid produce neutral solutions. The presence of Na2CO3 provides the water with high alkalinity (Sen, 2015), for this reason the pH of the San Pedro river is above neutrality (pH> 7). Normal pH values in irrigation water range from 6.5 to 8.5, the waters of the San Pedro River in a dry period reached values up to 8.9, according to Hong et al. (2013) these will have implications on the availability and management of nutrients. If they are used for fertigation, it will be necessary to lower the pH between 5.5 and 6.5.
Electric conductivity. The ECmin and ECmax in the ER-MS section were 131 and 367 µS cm-1, in MEX it was 2 530 and 16 330 µS cm-1, and in BC 23 605 and 43 820 µS cm-1. At the end of the rainy season, the waters of the ER-EM section were classified as C1; however, in the dry period, only RZ remained classified as C1, the other sites were classified as C2. MEX was classified in samples 1, 2 and 3 as C4, in sample 4 as all the samples from BC were classified as C5 (Table 1). Waters classified as C1 can be used for most crops, in almost any type of soil with very little probability that salinity will develop. Waters called C2 can be used as long as there is a moderate degree of washing, in almost all cases no special salinity control practices are needed. The water of the San Pedro river depending on its EC can be used for irrigation from ER to EM. For EC> 3 000 µS cm-1 the degree of restriction is severe (Castellón-Gómez et al., 2015), this situation occurs for MEX and BC, therefore it is not recommended for irrigation.
Sodium content. The values of RASor, RAS° and RASaj were less than 1.6 in the samples of the ER-EM section, and were classified as S1, both in the rainy season and in the dry season. They can be used for irrigation in most soils with little probability of reaching dangerous levels of exchangeable sodium. With the RASor MEX it was classified as S3 in samples 1, 2 and 3, while in sample 4, as well as in all BC samples, it was classified as S4. With RASaj, MEX and BC were S4 in the four samplings (Table 2). S3 and S4 waters are unsuitable for agricultural use, according to Richards (1990); Mandal et al. (2019) can produce toxic levels of exchangeable sodium in soils and cause infiltration problems, particle dispersion and structure loss.
Table 2 RASor, RAS°, RASaj, PSI, CSR and IS of the water of the San Pedro river in Nayarit.
RAS |
Class |
PSI |
RAS° |
Class |
PSI |
RASaj |
Class |
PSI |
CSR |
Classification |
IS |
Classification |
|
|
Sampling 1, rainy season |
||||||||||||
1.02 |
S1 |
1.21 |
0.82 |
S1 |
0.98 |
0.55 |
S1 |
0.67 |
0.36 |
-0.83 |
Dilute |
||
0.97 |
S1 |
1.16 |
0.76 |
S1 |
0.91 |
0.46 |
S1 |
0.56 |
0.33 |
-1.21 |
Dilute |
||
0.94 |
S1 |
1.12 |
0.71 |
S1 |
0.85 |
0.38 |
S1 |
0.46 |
0.28 |
-1.15 |
Dilute |
||
0.95 |
S1 |
1.14 |
0.74 |
S1 |
0.88 |
0.44 |
S1 |
0.53 |
0.28 |
-1.17 |
Dilute |
||
1 |
S1 |
1.19 |
0.79 |
S1 |
0.94 |
0.49 |
S1 |
0.59 |
0.33 |
-1.36 |
Dilute |
||
1.02 |
S1 |
1.21 |
0.82 |
S1 |
0.98 |
0.57 |
S1 |
0.68 |
0.31 |
-1.4 |
Dilute |
||
1.11 |
S1 |
1.31 |
0.92 |
S1 |
1.11 |
0.74 |
S1 |
0.88 |
0.37 |
-1.33 |
Dilute |
||
9.06 |
S3 |
9.72 |
10.14 |
S3 |
10.73 |
18.32 |
S4 |
17.68 |
0.88 |
-0.01 |
Dilute |
||
32.8 |
S4 |
27.43 |
- |
- |
- |
101.54 |
S4 |
52.78 |
31.99 |
0.96 |
Precipitates |
||
|
Sampling 2, drought season |
||||||||||||
1.41 |
S1 |
1.67 |
1.32 |
S1 |
1.57 |
1.49 |
S1 |
1.77 |
0.69 |
0.05 |
Precipitates |
||
1.21 |
S1 |
1.44 |
1.12 |
S1 |
1.33 |
1.23 |
S1 |
1.46 |
0.54 |
0.08 |
Precipitates |
||
1.25 |
S1 |
1.49 |
1.14 |
S1 |
1.36 |
1.23 |
S1 |
1.46 |
0.55 |
0.08 |
Precipitates |
||
1.12 |
S1 |
1.33 |
1 |
S1 |
1.19 |
1.02 |
S1 |
1.21 |
0.45 |
-0.02 |
Dilute |
||
1.22 |
S1 |
1.44 |
1.1 |
S1 |
1.31 |
1.17 |
S1 |
1.39 |
0.5 |
-0.08 |
Dilute |
||
1.18 |
S1 |
1.41 |
1.14 |
S1 |
1.35 |
1.32 |
S1 |
1.57 |
0.5 |
-0.25 |
Dilute |
||
1.28 |
S1 |
1.52 |
1.26 |
S1 |
1.5 |
1.58 |
S1 |
1.87 |
0.56 |
-0.14 |
Dilute |
||
11.44 |
S3 |
11.93 |
13.24 |
S3 |
13.52 |
27.02 |
S4 |
23.86 |
1.48 |
0.56 |
Precipitates |
||
42.17 |
S4 |
32.5 |
- |
- |
- |
140.2 |
S4 |
60.35 |
52.98 |
1.33 |
Precipitates |
||
|
Sampling 3, rainy season |
||||||||||||
1.12 |
S1 |
1.34 |
0.98 |
S1 |
1.16 |
0.88 |
S1 |
1.06 |
0.43 |
-1.11 |
Dilute |
||
1.1 |
S1 |
1.31 |
0.94 |
S1 |
1.12 |
0.78 |
S1 |
0.93 |
0.41 |
-0.96 |
Dilute |
||
1.01 |
S1 |
1.21 |
0.85 |
S1 |
1.02 |
0.7 |
S1 |
0.84 |
0.36 |
-1.11 |
Dilute |
||
1.24 |
S1 |
1.47 |
1.05 |
S1 |
1.25 |
0.83 |
S1 |
0.99 |
0.48 |
-0.93 |
Dilute |
||
1.15 |
S1 |
1.36 |
0.99 |
S1 |
1.18 |
0.86 |
S1 |
1.03 |
0.45 |
-1.11 |
Dilute |
||
1.09 |
S1 |
1.3 |
0.95 |
S1 |
1.14 |
0.87 |
S1 |
1.03 |
0.45 |
-1.2 |
Dilute |
||
1.11 |
S1 |
1.32 |
0.97 |
S1 |
1.16 |
0.86 |
S1 |
1.03 |
0.46 |
-1.37 |
Dilute |
||
9.29 |
S3 |
9.93 |
11.75 |
S3 |
12.2 |
22.36 |
S4 |
20.68 |
-0.47 |
0.35 |
Precipitates |
||
46.59 |
S4 |
34.64 |
- |
- |
- |
161.16 |
S4 |
63.5 |
64.5 |
1.56 |
Precipitates |
||
|
Sampling 4, drought season |
||||||||||||
1.33 |
S1 |
1.58 |
1.24 |
S1 |
1.47 |
1.35 |
S1 |
1.6 |
0.61 |
0.11 |
Precipitates |
||
1.33 |
S1 |
1.57 |
1.22 |
S1 |
1.44 |
1.14 |
S1 |
1.36 |
0.59 |
0.02 |
Precipitates |
||
1.25 |
S1 |
1.48 |
1.12 |
S1 |
1.34 |
1.21 |
S1 |
1.44 |
0.52 |
0.22 |
Precipitates |
||
1.21 |
S1 |
1.44 |
1.05 |
S1 |
1.26 |
1.01 |
S1 |
1.21 |
0.48 |
0.05 |
Precipitates |
||
1.23 |
S1 |
1.46 |
1.1 |
S1 |
1.31 |
1.03 |
S1 |
1.23 |
0.55 |
0.33 |
Precipitates |
||
1.33 |
S1 |
1.58 |
1.25 |
S1 |
1.48 |
1.41 |
S1 |
1.67 |
0.6 |
-0.65 |
Dilute |
||
1.34 |
S1 |
1.59 |
1.26 |
S1 |
1.49 |
1.4 |
S1 |
1.66 |
0.6 |
-0.56 |
Dilute |
||
19.62 |
S4 |
18.67 |
- |
- |
- |
63.65 |
S4 |
41.69 |
-4.14 |
1.68 |
Precipitates |
||
46.21 |
S4 |
34.46 |
- |
- |
- |
159.87 |
S4 |
63.32 |
60.08 |
1.8 |
Precipitates |
||
ID= identification (sampling site); ER= El Rosarito; SPI= San Pedro Ixcatan; EV= El Venado; RZ= Ruiz; ET= El Tamarindo; TUX= Tuxpan; EM= El Mezcal; MEX= Mexcaltitan; BC= Boca de Camichin. B= good, C= conditioned; NR= not recommendable.
Ionic strength was calculated to determine the implicit pHc in RASaj. The formula
to determine the activity coefficient of any ion in a solution is that of
Debye-Hückel:
Figure 3 shows the experimental
relationship
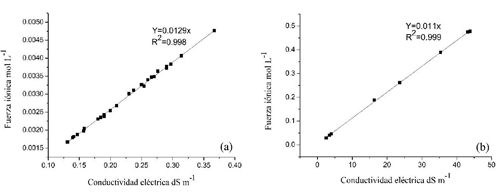
Figure 3 Functional relationship of ionic strength with the electrical conductivity of the water of the San Pedro river, Nayarit. a) ER-EM; and b) MEX-BC.
Leffelaar et al. (1983) in 50 extracts at saturation of various soil profiles, obtained a coefficient of α= 0.0144 and López-García et al. (2016) in wastewater obtained an α= 0.0116. These activity coefficients turned out to be like those determined in the water of the San Pedro river, therefore, with the EC it is sufficient to obtain an ionic force with a high degree of approximation.
Exchangeable sodium percentage. According to the Gapon selectivity constants used and the different RAS conceptualizations, the PSImin and PSImax of the waters of the San Pedro river were obtained. For the ER-EM section with low EC, the maximum values of PSI, which can be reached by the river waters when applied to the soil, were below 3%. Mexcaltitan with the different RAS their PSI was from 13.3 to 51.8% and BC from 35.7 to 73.1%. Table 2 shows the PSI averages for each sampling site. The predominant salts of the San Pedro river water are sodium, calcium and magnesium bicarbonates, followed by NaCl, and when evaporation processes exist, sodium carbonate appears.
According to López-García et al.
(2016), due to the high solubility of sodium salts, these are
dissolved even under evaporation conditions, and the CO3
2--HCO3
- system could be converted to CaMg(CO3)2,
which increases the concentration of sodium in the solutions and in turn the
PSI. Elbashier et al.
(2016) mentioned that the PSI of the ground and the RAS are
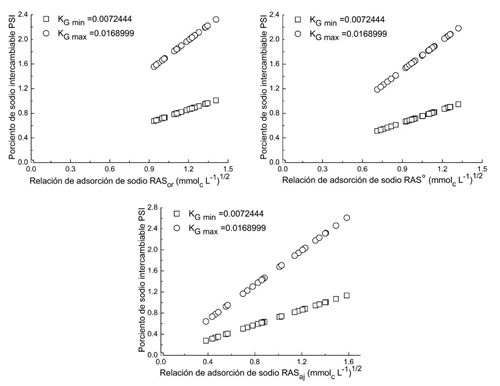
approximately the same. Figure 4 shows the
PSI-RAS relationship for the different RAS formulations of the waters of the San
Pedro river. It is observed that the variations of the PSI in the soils depend
on the KG values, if the relationship
Therefore, when increasing the RAS, the magnitude of the PSI increase will be a function of the texture, as shown in Figure 4, where the PSImax corresponds to a clay soil, while the PSImin to a sand-clay soil-slimy.
The PSI values that can be reached by the waters of the San Pedro river in the ER-EM section do not present a risk for application to the soil; however, Castellanos et al. (2000), mention that some soils can present permeability problems from 5% exchangeable sodium, especially if they are clayey. The agricultural area of the San Pedro river basin is characterized by having cambisol and fluvisol soils of coarse to medium texture (Bojorquez et al., 2006) therefore, the PSI will be less than the calculated PSImax. In practice, the actual PSI values in soil commonly turn out to be higher than those calculated by means of formulas, this is because the soil solution almost always has a higher sodium concentration than the irrigation water.
Residual sodium carbonate. The CSR indicates that the ER to EM and MEX sites in samples 1, 3 and 4 were classified as good quality water (<1.25). In sample 2, MEX is classified as conditional; BC in the four samplings was classified as not recommended (Table 2). Positive values indicate that there is a higher content of CO3 2- and HCO3 - than Ca2+ and Mg2+; however, this difference was not significant to restrict the use of these waters for irrigation. In the dry period, higher values were obtained than in the rainy season, this is because the flow rates are reduced and the concentrations of Ca2+ and Mg2+, due to their lower solubility than the Na+ salts, precipitate in the form of carbonates. Dhembare (2012) mentions that when negative values are obtained, they are due to the fact that Ca2+ and Mg2+ do not precipitate and remain in solution. Castellón-Gómez et al. (2015) mention that waters with high CSR values are not risky if used in fertigation, since CO3 2- and HCO3 - can be destroyed by adding acids.
Saturation index (IS). Negative values were obtained in the rainy season for ER to EM sites, indicating that the waters of the San Pedro river when applied in irrigation will dissolve CaCO3 in the soil. In the dry period, in the second sampling, in the ER, SPI and EV sites, the water showed a tendency to precipitate CaCO3 in the soil, this also happened in sampling 4 from ER to ET, the other sites obtained negative values. In the waters of MEX and BC, positive values were obtained, with the exception of MEX in sample 1 (Table 2).
The predominance of bicarbonates in the waters of the San Pedro river suggests a certain danger to be used for irrigation. According to Hannam et al. (2019), waters with high concentrations of HCO3 -, tend to precipitate calcium in the form of carbonates, as the soil solution is concentrated. Based on the solubility of the CO3 2- and HCO3 - salts, which can be formed with the majority cations in water, CaCO3 will be the first to precipitate, followed by MgCO3, processes that generally occur at pH> 8.2, by what when applying the irrigation with waters with this pH there will be precipitates. The IS indicates that in the rainy season the waters of the San Pedro river will dissolve calcite from the soil, however, in the evaporation process, the CO3 2- and HCO3 - will tend to precipitate, such as in the dry period. López-García et al. (2016), mention that the precipitation of calcite causes Ca2+ to stop participating in the exchange complex, and Na+ to participate more. The presence of Na+ in the cation exchange complex has a decisive influence on the physicochemical properties of the soil, since a high content of this ion in water considerably increases the PSI and, in turn, the pH.
Conclusions
The water from the San Pedro river in Nayarit from the section El Rosarito (ER) to El Mezcal (EM) was of the sodium-calcium-magnesium-bicarbonate type and presented higher alkalinity (pH> 7); they are of low electrical conductivity due to the short residence time, the insolubility of the silicate minerals of the Sierra Madre Occidental and the absence of significant sources of contamination; they are of good quality for crop irrigation. In the MEX-BC section it was chlorinated-sodium due to the mixture with the marine intrusion water and they are not suitable for agricultural use.
The CSR and the saturation index indicate that these waters tend to precipitate CaCO3 when the evaporation process occurs and in the dry season. The agricultural soils of the area are formed by alluvial sediments from the San Pedro River, therefore, over a geological-historical time span, the pedogeochemical profiles of the soils are constantly enriched with microscopic calcite.
Literatura citada
American Public Health Association (APHA). 2012. Standard methods for the examination of water and wastewater. Washington, DC, EEUU. [ Links ]
Aranda-Gómez, J. J.; Luhr, J. F.; Housh, T. B.; Valdez-Moreno, G. y Chávez-Cabello, G. 2005. El volcanismo tipo intraplaca del Cenozoico tardío en el centro y norte de México: una revisión. Boletín de la Sociedad Geológica Mexicana. 57(3):187-225. [ Links ]
Bojórquez, I.; Nájera, O.; Hernández, A.; Flores, F.; González, A.; García, D. y Madueño, A. 2006. Particularidades de formación y principales suelos de la Llanura Costera Norte del estado de Nayarit, México. Cultivos Tropicales. 27(4):19-26. [ Links ]
Bower, C. A.; Wilcox, L. V.; Akin, G. W. and Keyes, M G. 1965. An index of the tendency of CaCO3 to precipitate from irrigation waters. Soil Sci. Soc. Proceed. 29(1):91-92. [ Links ]
Can-Chulim, A.; Ramírez-Ayala, C.; Ortega-Escobar, M.; Trejo-López, C. y Cruz-Díaz, J. 2008. Evaluación de la relación de adsorción de sodio en las aguas del río Tulancingo, Estado de Hidalgo, México. Terra Latinoamericana. 26(3):243-252. [ Links ]
Castellanos, J. Z.; Uvalle-Bueno, J. X. y Aguilar-Santelises. A. 2000. Manual de interpretación de análisis de suelos y aguas. Segunda edición. 24-25 pp. [ Links ]
Castellón-Gómez, J. J.; Bernal-Muñoz, R. y Hernández-Rodríguez, M. L. 2015. Calidad de agua para riego en la agricultura protegida en Tlaxcala. Ingeniería. 19(3):39-50. [ Links ]
Curray, J. R.; Emmel, F. and Crampton, P. 1969. Holoceno history of strand plain, lagoonal coast, Nayarit, Mexico. Memorias del Simposio Internacional de Lagunas Costeras. Universidad Nacional Autónoma de México (UNAM)- Organización de las Naciones Unidas para la Educación, la Ciencia y la Cultura (UNESCO). México, DF. 63-100 pp. [ Links ]
Dhembare, A. J. 2012. Assessment of water quality indices for irrigation of Dynaneshwar Dam water, Ahmednagar, Maharashtra, India. Arch. Appl. Sci. Res. 4(1):348-352. [ Links ]
DOF. 2015. Diario Oficial de la Federación (Actualización de la disponibilidad media anual de agua en el acuífero San Pedro-Tuxpan (1802), estado de Nayarit. Comisión Nacional del Agua, Subdirección General Técnica, Gerencia de Agua Subterráneas, Subgerencia de Evaluación y Ordenamiento de Acuíferos. [ Links ]
Elbashier, M. A.; Xiaohou, S.; Ali, A. A. and Osman, B. 2016. Modeling of soil exchangeable sodium percentage function to soil adsorption ratio on sandy clay loam soil, Khartoum-Sudan. Inter. J. Plant Soil Sci. 10(5):1-6. [ Links ]
Ferrari, L.; Valencia-Moreno, M. y Scott, B. 2005. Magmatismo y tectónica en la Sierra Madre Occidental y su relación con la evolución de la margen occidental de Norteamérica. Boletín de la Sociedad Geológica Mexicana. 52(3):343-478. [ Links ]
Güler, C.; Thyne, G. D.; McCray, J. E. and Turner, K. A. 2002. Evaluation of graphical and multivariate statistical methods for classification of water chemistry data. Hydrogeol. J. 10(4):455-474. [ Links ]
Hannam, K. D.; Midwood, A. J.; Neilsen, D.; Forge, T. A. and Jones, M. D. 2019. Bicarbonates disolved in irrigation water contribute to soil CO2 efflux. Geoderma. 337:1097-1104. [ Links ]
Hong, J.; Chen, G.; Huang, X.; Zhang, L.; Ge, M.; Wang, S.; Du, L.; Ye, L. and Lian, Z. 2013. The effect of pH value of irrigation water on the available nutrients in soil. WIT Transactions on Ecol. Environ. 189:471-479. [ Links ]
INEGI. 2010. Instituto Nacional de Estadística y Geografía. Documento técnico descriptivo de la red hidrográfica escala 1:50,000 INEGI. Dirección General de Geografía y Medio Ambiente. RH11. [ Links ]
Krishna, K. S.; Babu, S. H.; Rao, P. E.; Selvakumar, S.; Thivya, C.; Muralidharan, S. and Jeyabal, G. 2017. Evaluation of water quality and hydrogeochemistry of Surface and groundwater, Tiruvallur District, Tamil Nadu, India. Appl. Water Sci. 7(5):2533-2544. [ Links ]
Langelier, W. F. 1936. The analytical control of anti-corrosion water treatment. J. Amer. Water Works Assn. 28(10):1500-1521. [ Links ]
Leffelaar, P. A.; Kamphorst, A. y Pal, R. 1983. Nomographic estimation of activity coefficients from the electrical conductivity data of soil extracts. Indian Soc. Soil Sci. 31(20):20-27. [ Links ]
López-García, A. D.; Ortega-Escobar, H. M.; Ramírez-Ayala, C.; Sánchez-Bernal, E. I.; Can-Chulim, A.; Gómez-Meléndez, D. J. y Vázquez-Alvarado, R. E. 2016. Caracterización fisicoquímica del agua residual urbano-industrial y su importancia en la agricultura. Tecnología y Ciencias del Agua. 7(6):139-157. [ Links ]
Madrigal-Solís, H.; Fonseca-Sánchez, A. y Reynolds-Vargas, J. 2017. Caracterización hidrogeoquímica de los acuíferos volcánicos Barva y Colima en el Valle Central de Costa Rica. Tecnología y Ciencias del Agua. 8(1):115-132. [ Links ]
Mandal, S. K.; Dutta, S. K.; Pramanik, S. and Kole, R. K. 2019. Assessment of river water quality for agricultural irrigation. Inter. J. Environ. Sci. Technol. 16(1):451-462. [ Links ]
Nishanthiny, C.; Thushyanthy, S.; Barathithasan, T. and Saravanan, S. 2010. Irrigation water quality based on hydro chemical analysis, Jaffna, Sri Lanka. American- Eurasian J. Agric. Environ. Sci. 7(1):100-102. [ Links ]
NMX-AA-073-SCFI-2001. Análisis de agua - determinación de cloruros totales en aguas naturales, residuales y residuales tratadas-método de prueba (cancela a la NMX-AA-073-1981). Secretaría de Economía (SE). México. [ Links ]
Raviolo, A. y Farré, A. 2017. Una evaluación alternativa del tema titulación ácido-base a través de una simulación. Educación Química. 28(3):163-173. [ Links ]
Richards, L. A. 1990. Diagnóstico y rehabilitación de suelos salinos y sódicos. Manual núm. 60. Sexta reimpresión. Departamento de Agricultura de los Estados Unidos-Laboratorio de Salinidad. Limusa. México, DF. 85-88 pp. [ Links ]
Sen, Z. 2015. Practical and applied hydrogeology. Elsevier. 1st (Ed.). Amsterdam, Netherlands. 424 p. [ Links ]
Sposito, G. y Mattigod, S. V. 1977. On the chemical foundation of the sodium adsorption ratio. Soil. Sci. Soc. Am. J. 41(2):323-329. [ Links ]
Steiner, A. A. 1968. Soilless culture. In: fertilization of protected crops, proceedings. International Potash Institute. (Ed.). Proceedings of the 6th Colloquium of the International Potash Institute. International Potash Institute. Florence, Italy. 324-341 pp. [ Links ]
Suarez, D. L. 1981. Relation between pHc and sodium adsorption ratio (SAR) and an alternative method of estimating SAR of drainage waters. Soil Sci. Soc. Am. J. 45(3):469-475. [ Links ]
Velázquez-Machuca, M. A.; Ortega-Escobar, M.; Martínez-Garza, A.; Kohashi-Shibata, J. y García-Calderón, N. 2002. Relación funcional PSI-RAS en las aguas residuales y suelos del Valle del Mezquital, Hidalgo, México. Terra. 20(4):459-464. [ Links ]
Vidal-Solano, J.; Paz-Moreno, F. A.; Iriondo, A.; Demant, A. and Cochemé, J. J. 2005. Middle Miocene peralkaline ignimbrites in the Hermosillo region (Sonora, México): Geodynamic implications. C. R. Geosciences. 337(16):1421-1430. [ Links ]
Yaron, B. N. and Tomas, G. S. W. 1968. Soil hydraulic conductivity as affected by sodic water. Water Res. Resch. 4(3):545-552. [ Links ]
Received: December 01, 2019; Accepted: January 01, 2020
 Este es un artículo publicado en acceso abierto bajo una licencia
Creative Commons
Este es un artículo publicado en acceso abierto bajo una licencia
Creative Commons
