


Servicios Personalizados
Revista
Articulo
 texto en
  Inglés (pdf)
 Artículo en XML
 Referencias del artículo
 Enviar artículo por email
Indicadores
-
 Citado por SciELO
 -
 Accesos
Links relacionados
-
 Similares en
SciELO
Similares en
SciELO
Compartir

 Permalink
Revista mexicana de ciencias agrícolas
versión impresa ISSN 2007-0934
Rev. Mex. Cienc. Agríc vol.11 no.2 Texcoco feb./mar. 2020 Epub 15-Mar-2021
https://doi.org/10.29312/remexca.v11i2.2304
Articles
Diversity of woody species in altered mesophilic remnant with agroforestry production
1Master in Agroforestry for Sustainable Development-Chapingo Autonomous University. Federal Highway México-Texcoco km 38.5, Chapingo, Texcoco, México. CP. 56230. Tel. 595 9521500, ext. 5382. (biologo-ugalde@hotmail.com; madeni@gmail.com; edna-alvarez30@yahoo.com.mx).
In 2017, the diversity of woody species in the community of Xaltepuxtla, Puebla was evaluated in a remnant of altered mountain mesophilic forest, ornamental system and silvopastoral system in order to know the tree diversity and propose species of high ecological value for their restoration. Ecological indices and a systematic sampling design were used with predetermined distances in grid form. 22 sites were sampled using quadrants with central point for tree vegetation with 100 m2 sites and embedded boxes for shrub and herbaceous vegetation. Wealth, abundance and diversity of woody species were obtained with estimators of Jacknife 1, relative abundance index (IAR) and Shannon-Wiener index. 19 species were registered in 15 families and 18 genera. The species with the greatest relative abundance per site were: Chamaecyparis lawsoniana (IAR= 0.96), Rhododendron simssi (IAR= 0.46) and Chamaecyparis. thyoides (IAR= 0.25). The sites with the greatest diversity were: 22 with an index of 2.54 and 20 and 21 with indexes of 2.53 respectively. The greatest diversity by condition was in the RBMM with an index of 2.92. With the Kruskal Wallis test, no significant differences were obtained between the ecological estimators, so all three conditions are subject to the same level of alteration. It was possible to know the wealth, abundance and diversity of the woody species in the study area.
Keywords: abundance; ecological indexes; silvopastoral system; wealth
En el año 2017 se evaluó la diversidad de especies leñosas en la comunidad de Xaltepuxtla, Puebla en un remanente de bosque mesófilo de montaña alterado, sistema ornamental y sistema silvopastoril con la finalidad de conocer la diversidad arbórea y proponer especies de alto valor ecológico para su restauración. Se emplearon índices ecológicos y un diseño de muestreo sistemático con distancias predeterminadas en arreglo a manera de cuadricula. Se muestrearon 22 sitios utilizando cuadrantes con punto central para vegetación arbórea con sitios de 100 m2 y cuadros empotrados para vegetación arbustiva y herbácea. Se obtuvo la riqueza, abundancia y diversidad de las especies leñosas con estimadores de Jacknife 1, índice de abundancia relativa (IAR) y índice de Shannon-Wiener. Se registraron 19 especies en 15 familias y 18 géneros. Las especies de mayor abundancia relativa por sitio fueron: Chamaecyparis lawsoniana (IAR= 0.96), Rhododendron simssi (IAR= 0.46) y Chamaecyparis. thyoides. (IAR= 0.25). Los sitios con mayor diversidad fueron: el 22 con un índice de 2.54 y el 20 y 21 con índices de 2.53 respectivamente. La mayor diversidad por condición fue en el RBMM con un índice de 2.92. Con la prueba de Kruskal Wallis no se obtuvieron diferencias significativas entre los estimadores ecológicos, por lo que las tres condiciones se encuentran sujetas al mismo nivel de alteración. Se logró conocer la riqueza, abundancia y diversidad de las especies leñosas en la zona de estudio.
Palabras claves: abundancia; índices ecológicos; riqueza; sistema silvopastoril
Introduction
In Mexico, the mountain mesophilic forest (BMM) represents a very valuable natural capital for the provision of multiple environmental services, both for local populations and for the rest of Mexican society (González-Espinosa et al., 2012). This ecosystem harbors an important world biodiversity, but it is strongly threatened because it exhibits the highest rates of deforestation among tropical forests (Aldrich et al., 2000).
In the community of Xaltepuxtla, Puebla has been causing very drastic alterations to this type of forest due to the introduction of production systems of ornamental plants, which has caused an environmental problem highlighting the decrease in plant species, loss of soil and decrease in ecosystem services.
Agroforetal systems are an alternative for the provision and conservation of these services, such as water, carbon sequestration and biodiversity among others (Ibrahim et al., 2006). This has motivated some researchers to carry out work in silvopastoral systems with the inclusion of woody species of the BMM (Sánchez-Gómez et al., 2017). Although this work exhibits the importance of silvopastoral systems with characteristic species of the BMM, the contribution to scientific knowledge is still scarce, in addition, the structure and floristic composition of a plant community in silvopastoral systems and remnants of mesophilic forest of altered mountain.
That is why the present study aims to evaluate the arborea diversity of woody species, in a silvopastoral system immersed in mesophilic forest altered through the use of ecological indexes to propose species of greater cultural value that can be used in restoration programs of the area helping the conservation of the forest.
Materials and methods
Description of the study area
The research was carried out in the community of Xaltepuxtla, belonging to the municipality of Tlaola, Puebla. It has an extension of 40 hectares that are part of the River Basin of the Necaxa River. This zone is located between the extreme coordinates 97° 58’ 5.303” west longitude and 20° 11’ 23.06” north latitude, 97° 57’ 30.836” west longitude and 20° 10’ 57.124” north latitude, at an altitude of 1 280 m. The climate is semi-warm, with little annual oscillation of the average monthly temperatures. The average annual rainfall is 1 992.4 mm and the average annual temperature is 17.5 °C. (SMN, 2016). The predominant soil type is mollic andosol and slight slopes until very pronounced ranging from 2% to more than 45%. The conditions under study are ornamental system (SO) with 37.3 ha, silvopastoral system (SS) with 0.43 ha and remnants of mesophilic mountain forest (RBMM) with 2.27 ha.
Sampling design
The polygonal and surfaces of each condition was delimited by digitizing the study area with the COGO tool of Arc map 10.1; from azimuth and distance from the boundaries of the property, rectified in the field with transects with a Garmin global geo-positioner (GPS) (Ruiz, 2016). The sampling design used was systematic sampling with predetermined distances and in arrangements in a manner of grid (Ralph et al., 1996), obtaining 22 units of choice or sites with distances between them of 141.4 m. Vegetation was sampled using quadrant methods with central point for tree vegetation (Cottam and Curtis, 1956) and embedded boxes for shrub and herbaceous vegetation (Oosting, 1956).
Variables evaluated
In each of the sites, cartesian coordinates were recorded with a GPS, as well as habitat variables such as exposure, slope and thickness of mulch and dasometric variables such as total height (H), clean shaft height (HFL) and diameter at 1:30 m. of the ground (DN). In the case of shrubs, the crown diameter (DC), number of branches for those species with foliage use, height (H) and number of individuals were measured for each individual, for the herbaceous, only the percentage of land covered was measured by them.
In each site, specimens of the different species found were collected for subsequent identification in the herbarium of the Division of Forest Sciences of the Autonomous University Chapingo (UACH).
Analysis of data
Frequency of observation. To know the percentage frequency of species wealth by condition and by site, the observation frequency index (FO) (Salas and Orduña, 1993) was used, with the total number of woody individuals registered per species among the total number of individuals per 100.
Wealth of species. The first-order non-parametric Jacknife estimator was used, using presence-absence or abundance data by species (Colwell, 2004), which represents one of the most accurate and least biased indexes (Palmer, 1990), using the computational program ‘EstimateS 6b1a’.
Relative abundance. To estimate the relative abundance of the species, present in the different sites and conditions, the abundance index defined by Carrillo and Cuarón (2000) was calculated; Aranda (2000), modified for this study.
Diversity of species Based on a review of the characteristics and assumptions of various species diversity indices (alpha diversity), the non-parametric index known as the Shannon-Wiener diversity index was chosen, using the ‘EstimateS’ version 6b1a (Colwell, 2000). To determine significant differences in the wealth, relative abundance and diversity of species recorded by condition and by site, a non-parametric test of Kruskal-Wallis (Zar, 1999) was performed, using the statistical software JMP IN version 4.
To determine if all species were considered in wealth, relative abundance and diversity of species recorded by condition and site, a ‘Chi square of Pearson’ analysis was carried out, (Molinero, 2003b): with a significance of α= 0.05, said analysis was used to assess whether the differences between the observed and expected frequencies are attributed to chance, under the hypothesis of independence. This analysis was carried out using JMP IN software version 4.
Poisson regression analysis (ARP)
An analysis was carried out in order to establish possible associations between the dasometric and habitat variables on the abundance of the woody species with the highest ecological value recorded in the three conditions evaluated. First, the effect between habitat and dasometric variables and the abundances of different woody species with greater ecological value was analyzed, using a Poisson regression model (González-Oreja, 2003).
The variables that explain the greater variability to select the model were then determined (Rotenberry and Wiens, 1980). Thus, the abundance of the woody species (y) was modeled before the dasometric and habitat variables (x), making an adjustment of the variable ‘y’ to the variables ‘x’, using a generalized linear model (McCullagh and Nelder, 1989) that will explain the relationship between a response variable ‘y’ and a set of explanatory variables ‘x’ through a linear relationship.
In this analysis, those in which p< 0.05 (McCullagh and Nelder, 1989; González-Oreja, 2003) were considered statistically significant coefficients. In this way, woody species were obtained that had an effect on independent variables (dasometric and habitat). This analysis was performed using the GLM procedure of the statistical software R-version 2.6.1. (Dalgaard, 2006).
Results
A total of 1050 individuals were registered, the most representative species are Chamaecyparis lawsoniana with 48.19% (506 individuals), Rhododendron simssi with 23.33% (245) and Chamaecyparis thyoides with 12.48% (131), some natives are below 3% (Figure 1).

Figure 1. Frequency of observation of woody species. The mostrepresentative species by condition was Chamaecyparis lawsoniana; found 45.74% (938 plants) in the ornamental system, 92.86% (42) for silvopastoral and 54.29% (70) for RBMM; the percentage value of the rest of the species exhibited a differential trend in each condition.
Species wealth
19 herbaceous species, 9 shrubs, 9 trees and one tree were recorded; all of them distributed in 15 families and 18 genders (Table 1).
Table 1 List of species registered in ornamental system, sivopastoral system and remnants of mesophilic mountain forest.
Common name |
Scientific name |
Biological form |
Family |
Azalea |
Rhododendron simssi |
Shrubs |
Ericaceae |
Camellia |
Camellia japónica |
Shrubs |
Theaceae |
Cedrela |
Chamaecyparis thyoides 'Top Point' |
Shrubs |
Cupressaceae |
Chima |
Chamaecyparis lawsoniana |
Shrubs |
Cupressaceae |
Ailite |
Alnus acuminata |
Tree |
Betulaceae |
Encino |
Quercus sp. |
Tree |
Fagaceae |
Pine |
Pinus patula |
Tree |
Pinaceae |
Myrtle |
Buxus sempervirens |
Tree |
Buxaceae |
Ocozote |
Liquidambar styraciflua |
Tree |
Hamamelidaceae |
Poplar |
Platanus mexicana |
Tree |
Platanaceae |
May flower |
Bejaria aestuans |
Shrubs |
Ericaceae |
Jonote |
Heliocarpus appendiculatus |
Tree |
Malvaceae |
Cuachalalate |
Amphipterygium adstringens |
Shrubs |
Anacardiaceae |
Makiki |
Cyathea salvinii |
Arborescent |
Cyatheaceae |
Guava |
Psidium guajava |
Tree |
Myrtaceae |
Ash tree |
Fraxinus uhdei |
Tree |
Oleaceae |
Oxocopaque |
Gaultheria erecta |
Shrubs |
Ericaceae |
Zapote |
Casimiroa edulis |
Tree |
Rutaceae |
Planchado |
Thuja occidentalis |
Shrubby |
Cupressaceae |
|
otras |
Shrubby |
|
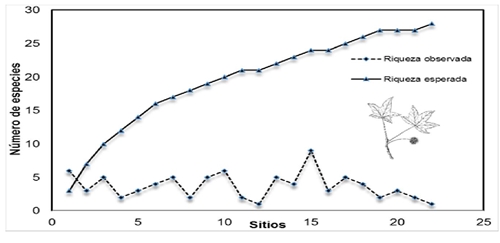
20 species were found so that, with the sampling effort carried out, 19% of the species theoretically present in the sites considered are known (Figure 2).
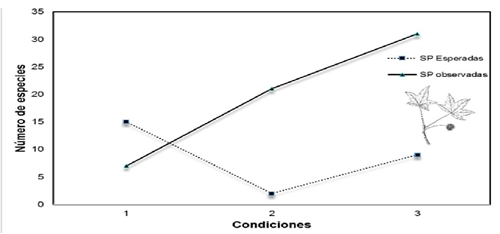
In the wealth of species by condition an estimated 15 species is indicated, so up to now, with the sampling effort carried out, 100% of the theoretically present species in this condition are known, for the silvopastoral system 2 species were registered, which It shows a sampling effort of 10% and for the RBMM, 9 species were observed, indicating a sampling effort of 29% (Figure 3).
The present work uses rarefaction curves for the first time with the Jackniffe 1 estimator for silvopastoral systems, so that beta-level registrations are obtained in this type of forest. The trends in recorded wealth coincide with what was reported by Chiarucci et al. (2003) who point out that data from large samples analyzed using Jacknife 1 present more precise values of wealth.
Relative abundance index (IAR) by sites
The results of the IAR for the frequency data recorded by species in all sites by condition, suggest that the species of greater relative abundance were: Chamaecyparis. lawsoniana (IAR= 0.96), Rhododendron simssi (IAR= 0.46), Chamaecyparis. thyoides (0.25), the values of the rest of the species show lower values (Figure 4a). By condition Chamaecyparis lawsoniana presented greater abundance (IAR= 0.96) in the ornamental system, (IAR= 1.86) for silvopastoral and (IAR= 1.09) for RBMM, the value of the rest of the species exhibited a differential trend in each condition (Figure 4b).

Species diversity
The results of Shannon-Wiener for the data of the different conditions under study suggest that the one with the greatest diversity was: the RBMM (H’= 2.92), followed by the silvopastoral system (H’= 2.61) and finally the ornamental system (H’= 2) (Figure 5).

Statistical analysis
The results of Kruskal Wallis for data on the wealth, abundance and diversity of woody species per site in the conditions under study suggest that there are no significant differences, therefore, the wealth, abundance and diversity of species found in the 22 sites are they are subject to the same levels of disturbance (Table 2).
X2 square test for sites
The results of X2 square for data on the wealth, abundance and diversity of woody species per site, under the conditions under study, suggest that not all the species that potentially exist in the study area were recorded (Table 3).
X2 square for conditions
The results of X2 square for the conditions evaluated suggest that not all species that potentially exist in the study area with R square of 1 and a Pearson value of 0.19 for each of the conditions were recorded.
Species of higher ecological value
The selection of the species with the highest ecological value was made with the indices of wealth, abundance and diversity, through the analysis and interpretation of these indices, the wealth allowed us to know the species existing in each study condition, the relative abundance the number of individuals by species and diversity the condition of each plant community (Table 4).
Table 4 List of species with the highest ecological value.
Common name |
Scientific name |
Biological form |
Family |
Camellia |
Camellia japonica |
Shrubs |
Theaceae |
Ailite |
Alnus acuminata |
Tree |
Betulaceae |
Encino |
Quercus sp. |
Tree |
Fagaceae |
Pine tree |
Pinus patula |
Tree |
Pinaceae |
Myrtle |
Buxus sempervirens |
Shrubs |
Buxaceae |
Ocozote |
Liquidambar styraciflua |
Tree |
Hamamelidaceae |
Poplar |
Platanus mexicana |
Tree |
Platanaceae |
May Flower |
Bejaria aestuans |
Shrubs |
Ericaceae |
Jonote |
Heliocarpus appendiculatus |
Tree |
Malvaceae |
Cuachalalate |
Amphipterygium adstringens |
Shrubs |
Anacardiaceae |
Makiki |
Cyathea salvinii |
Arborescent |
Cyatheaceae |
Guava |
Psidium guajava |
Tree |
Myrtaceae |
Ash tree |
Fraxinus uhdei |
Tree |
Oleaceae |
Oxocopaque |
Gaultheria erecta |
Shrubs |
Ericaceae |
Zapote |
Casimiroa edulis |
Tree |
Rutaceae |
Planchado |
Thuja occidentalis |
Shrubby |
Cupressaceae |
Four dasometric and habitat variables presented a degree of association with the abundance of the registered woody species, with an AIC= 174.94 (Table 5).
Table 5 Result of the Poisson regression analysis to explain the effect of the variables on species abundance.
Coefficients: |
Estimated |
Standard error |
Z value |
Pr(>|z|) |
Significance |
(Intercept) |
0.5741403 |
0.4189802 |
1.37 |
0.170585 |
|
0.0245615 |
0.004494 |
5.465 |
4.62e-08 |
||
-0.1221484 |
0.0416701 |
-2.931 |
0.003375 |
||
0.0023911 |
0.0007982 |
2.996 |
0.00274 |
||
0.0031595 |
0.0009217 |
3.428 |
0.000609 |
DC= shrub cup diameter, DN= diameter at 1.30 meters from the ground, H= height of trees and shrubs, HFL= clean shaft height of trees, significance codes: 0.001 ‘***’, 0.01 ‘**’, 0.05 ‘*’, ‘.’ 0.1, ‘-’ NS. Note: statistically significant coefficients (p< 0.001) of the GLM model.
Discussion
The greatest diversity of species was found in the RBMM; however, trends indicate that there is no significant difference in terms of diversity between sites, these results are consistent with those presented by Bogino and Bravo (2014) who also found no significant differences in species diversity between different anthropogenic disorders more widely spread in the arid and semi-arid regions of Argentina. While Sánchez et al. (2003) recorded a significant difference in some of their evaluated plots located in a mesophilic mountain forest in the Manantlan mountain range, Jalisco.
A greater number of induced species with ornamental value is found, the most abundant being Chamaecyparis lawsoniana, in contrast Mata and Terrazas (2003) in their research indicate that the highest frequency of species found are characteristic of the mountain mesophilic forest; however, this tendency is due to the fact that the study of these authors was carried out in one of the most diverse mountain mesophilic forests of the country, unlike the present one where a silvopastoral system is considered within the altered mountain mesophilic forest.
The best adjusted model for the abundance of species indicates that the tree stratum has a direct effect on the abundance of the species, this is because as the trees are higher, the number of individuals of the species increases, because the space that tree canopies normally occupy does not compete for space with shrubs or smaller trees, since these canopies are located in a stratum higher than those of shrubs, this is consistent with what Saavedra-Romero et al. (2016) said where they mention that the cups compete for resources, especially with neighboring trees, but perhaps the competition for growth space and radiation are the most important.
Another factor that has an effect on the abundance of species is the height of the clean shaft that allows the number of individuals to increase, because the branches of the trees branch off in upper strata and the branches do not enter into competition for space which agrees with the Corvalán and Hernández (2006) say where they mention, which basic components of the occupation of the space of the tree and the stand are the shaft, cup and its roots. The present study reports a Poisson distribution for woody species of a mesophilic mountain forest, not reported for a silvopastoral system, where the dasometric and habitat variables are considered to explain the abundance of the species in that system.
Conclusions
Results were obtained from the estimators of wealth, abundance and diversity in the remnant of mesophilic mountain forest, silvopastoral and ornamental systems. Therefore, the diversity in the different systems evaluated was recorded with stability values at beta level.
The native species of the mountain mesophilic forest are partially known, and the species with the highest ecological value are also known, so in restoration work it is proposed to use the species Alnus acuminata, Platanus mexicana, Heliocarpus appendiculatus, Fraxinus uhdei and Casimiroa edulis, because within all the native species and of greater ecological value, they only presented 1 to 2 individuals per species in the entire studied area.
Literatura citada
Aldrich, M.; Bubb, P.; Hostettler, S. y Van de Wiel, H. 2000. Bosques nublados tropicales montanos. Tiempo para la acción. WWF International/IUCN The World Conservation Union. Cambridge, Inglaterra. 28 p. [ Links ]
Aranda, M. 2000. Huellas y otros rastros de los mamíferos medianos y grandes de México. Instituto de Ecología, AC. Xalapa, México. 212 p. [ Links ]
Bogino, S. M. y Bravo, M. B. 2014. Impacto del rolado sobre la biodiversidad de especies leñosas y la biomasa individual de jarilla (Larrea divaricata) en el Chaco Árido Argentino. Quebracho-Rev. Cienc. Forest. 22(1-2):79-87. [ Links ]
Carrillo, E.; Wong, G. and Cuarón, A. D. 2000. Monitoring mammal populations in Costa Rican protected areas under different hunting restrictions. Conservation Biology. 14(6):1580-1591. [ Links ]
Chiarucci, A.; Enright, N. J.; Perry, G. L. W.; Miller, B. P. and Lamont, B. B. 2003. Performance of nonparametric species richness estimators in a high diversity plant community. Diversity and Distributions. 9(4):283-295. [ Links ]
Colwell, R. K. 2004. EstimateS user’s guide. Website: http://purl.oclc.org/estimates or http://viceroy.eeb.uconn.edu/estimates. 71 p. [ Links ]
Colwell, R. K. and Estimate, S. 2000. Statistical estimation of species richness and shared species from samples. Version Win 6b1a. User’s guide and application published. 73 p. [ Links ]
Comstock, J. H. 1918. Outline of laboratory work in the study of the venation of the wings of insects. Ithaca, New York, USA. The Comstock Publishing Company. 34 p. [ Links ]
Corvalán, P. y Hernández, J. 2006. Densidad del rodal. Universidad de Chile, Facultad de Ciencias Forestales. Departamento de Manejo de Recursos Forestales, Cátedra de Dasometría. 50 p. [ Links ]
Cottam, G. and Curtis, J. T. 1956. The use of distance measures in phytosociological sampling. Ecology. 37(3):451-460. [ Links ]
Dalgaard P. 2006. Repeated measures tools for multivariate linear models. Book of abstracts. The R User Conference 2006. 2nd International R User Conference. Vienna, Austria. 194 p. [ Links ]
González-Espinosa, M.; Meave, J. A.; Ramírez-Marcial, N.; Toledo-Aceves, T.; Lorea-Hernández, F. G. e Ibarra-Manríquez, G. 2012. Los bosques de niebla de México: conservación y restauración de su componente arbóreo. Rev. Ecos. 21(1-2):36-52. [ Links ]
González-Oreja, J. A. 2003. Aplicación de análisis multivariantes al estudio de las relaciones entre las aves y sus hábitats: un ejemplo con paseriformes montanos no forestales. Ardeola. 50(1):47-58. [ Links ]
Ibrahim, M.; Gobbi, J.; Casasola, F.; Chacón, M.; Ríos, N.; Tobar, D. y Pagiola, S. 2006. Enfoques alternativos de pagos por servicios ambientales: Experiencia del proyecto Silvopastoril. In Workshop on Costa Rica Experience with Payments for Environmental Services. San José 25-26 pp. [ Links ]
McCullagh, P. and Nelder, J. A. 1989. Generalized linear models. Núm. 37 in Monograph on Statistics and Applied Probability. 532 p. [ Links ]
Molinero, L. 2003b. ¿Y si los datos no se ajustan a una distribución normal? Bondad de ajuste a una normal, transformaciones y pruebas no paramétricas. Sociedad Española de Hipertensión. Liga Española para la lucha contra la hipertensión arterial. http://www.seh-lelha.org/pdf/noparame.pdf. [ Links ]
Oosting, H. J. 1956. The study of plant communities. Freeman. San Francisco, USA. 185 p. [ Links ]
Palmer, M. W. 1990. The estimation of species richness by extrapolation. Ecology. 71(3):1195-1198. [ Links ]
Ralph, C. J.; Geupel, G. R.; Pyle, P.; Martin, T. E.; DeSante, D. F. y Milá, B. 1996. Manual de métodos de campo para el monitoreo de aves terrestres. Gen. Tech. Rep. PSW-GTR159.Albany, CA: Pacific Southwest Research Station, Forest Service, U.S. Department of Agriculture. 46 p. [ Links ]
Rotenberry, J. T. and Wiens, J. A. 1980. Synthetic approach to principal component analysis of bird/habitat relationships. General technical report RM-Rocky Mountain Forest and Range Experiment Station. United States, Forest Service. 25-30 pp. [ Links ]
Ruiz, M. S. 2016. Calidad del suelo en sistemas de producción tradicionales y con tecnologías agroforestales en Xaltepuxtla, Puebla. Tesis de Maestría. Universidad Autónoma Chapingo, Texcoco de Mora, México. 120 p. [ Links ]
Saavedra-Romero, L. D. L.; Alvarado-Rosales, D.; Rosa, P. H. D. L.; Martínez-Trinidad, T.; Mora-Aguilera, G. y Villa-Castillo, J. 2016. Condición de copa, indicador de salud en árboles urbanos del bosque San Juan de Aragón, Ciudad de México. Madera y Bosques. 22(2):15-27. [ Links ]
Salas-Páez, M. A. y Orduña-Trejo, C. 1993. Las aves de la Sierra Purépecha del estado de Michoacán. Boletín Divulgativo del Instituto Nacional de Investigaciones Forestales y Agropecuarias. 79 p. [ Links ]
Sánchez Rodríguez, E. V.; López Mata, L.; García Moya, E. y Cuevas Guzmán, R. 2003. Estructura, composición florística y diversidad de especies leñosas de un bosque mesófilo de montaña en la Sierra de Manantlán, Jalisco. Boletín de la Sociedad Botánica de México. 73 p. [ Links ]
Sánchez-Gómez, A.; Becerril-Pérez, C. M.; Rosendo-Ponce, A. y Platas-Rosado, D. E. 2017. Oportunidades de conservación del bosque de niebla a través de tecnología agroalimentaria con sistemas silvopastoriles. Agroproductividad. 10(1):56-61. [ Links ]
Zar, J. H. 1999. Biostatistical analysis. 4th. New Jersey, USA: Prentice Hall, Inc. 929 p. [ Links ]
Received: January 01, 2020; Accepted: March 01, 2020
 Este es un artículo publicado en acceso abierto bajo una licencia Creative Commons
