


Servicios Personalizados
Revista
Articulo
 texto en
  Inglés (pdf)
 Artículo en XML
 Referencias del artículo
 Enviar artículo por email
Indicadores
-
 Citado por SciELO
 -
 Accesos
Links relacionados
-
 Similares en
SciELO
Similares en
SciELO
Compartir

 Permalink
Revista mexicana de ciencias agrícolas
versión impresa ISSN 2007-0934
Rev. Mex. Cienc. Agríc vol.11 no.1 Texcoco ene./feb. 2020 Epub 02-Mar-2021
https://doi.org/10.29312/remexca.v11i1.1954
Articles
Use of oat fiber with different particle size in baking: rheological and textural effect
1Departamento de Ingeniería Agroindustrial-Universidad Autónoma Chapingo. Carretera México-Texcoco km 38.5, Chapingo, Texcoco, Estado de México. CP. 56230. (diana-cof@hotmail.com).
2Coordinación de Tecnología de Alimentos de Origen Vegetal-Centro de Investigación en Alimentación y Desarrollo AC. Carretera Gustavo Astiazarán Rosas núm. 46, Col. La Victoria, Hermosillo, Sonora. CP. 83304. (pame@ciad.mx; aislas@ciad.mx).
3Departamento de Tecnología de Alimentos-Universidad Politécnica de Valencia, Camino de Vera s/n, Valencia, España. CP. 46022. (saveram@upvnet.upv.es).
4Departamento de Investigación y Posgrado en Alimentos-Universidad de Sonora. Boulevard Luis Encinas y Rosales, Hermosillo, Sonora. CP. 83000. (bramirez@guaymas.uson.mx).
The objective of this work was to evaluate the effect of replacing wheat flour (HT) with oat fiber flour (HFA) with different particle size on the rheological, textural and baking properties. The particle size obtained after grinding oat fiber was 250 and 177 µm (microns). The replacement percentages used were 10, 20 or 30%. Flour mixtures were determined color, water retention capacity (CRA) and viscosity profile. The dough was measured for strength and extensibility by the Kieffer test, while the bread was measured for specific volume, water activity and texture profile. The results showed increases in force in the dough when the two fractions of HFA (250 or 177 µm) were used in the substitution of HT with respect to that obtained from HT (0.25 N). In extensibility, the most important increases were observed when 177 µm HFA was used. The specific bread volume was favored when 10 or 20% of HFA (177 µm) was used, observing very similar values between them (4.54 and 4.56 cm3 g-1, respectively), without showing significant differences to that obtained from HT (4.57 cm3 g-1). The texture profile showed the obtaining of softer breads when HFA (177 µm) was used, in its three different replacement percentages (4.86, 4.71 and 7.05 N), even improved as measured in HT (7.84 N).
Keywords: fiber flour; wheat flour
El objetivo de este trabajo fue evaluar el efecto de la sustitución de harina de trigo (HT) con harina de fibra de avena (HFA) con diferente tamaño de partícula sobre las propiedades reológicas, texturales y de panificación. El tamaño de partícula obtenido después de la molienda de la fibra de avena fue de 250 y 177 µm (micrones). Los porcentajes de sustitución utilizados fueron de 10, 20 ó 30%. A las mezclas de harinas se les determinó color, capacidad de retención de agua (CRA) y perfil de viscosidad. A las masas se les midió fuerza y extensibilidad por la prueba de Kieffer, mientras que al pan se le midió volumen específico, actividad de agua y perfil de textura. Los resultados mostraron incrementos de fuerza en la masa cuando se utilizaron las dos fracciones de HFA (250 o 177 µm) en la sustitución de HT con respeto a la obtenida de HT (0.25 N). En extensibilidad, los incrementos más importantes fueron observados cuando se utilizó HFA de 177 µm. El volumen específico del pan se vio favorecido cuando se utilizó 10 o 20% de HFA (177 µm) observándose valores muy parecidos entre ellos (4.54 y 4.56 cm3 g-1, respectivamente), sin mostrar diferencias significativas al obtenido de HT (4.57 cm3 g-1). El perfil de textura mostró la obtención de panes más blandos cuando se utilizó HFA (177 µm), en sus tres diferentes porcentajes de sustitución (4.86, 4.71 y 7.05 N), incluso mejoró al medido en HT (7.84 N).
Palabras clave: harina de trigo; harina de fibra de avena; panificación
Introduction
The development of food products that use compound flours has increased considerably, especially in the production of bakery and pastry products. The production of food based on compound flours can maintain similar characteristics to products made only from wheat flour; however, there are many more positive effects that can be achieved, among them are effects on functional, sensory, rheological, physicochemical properties and even on health benefits due to their nutritional contribution.
Among these vegetable flours used in the replacement of wheat flour in order to improve the nutritional, organoleptic characteristics and even lower production costs are mainly sorghum grain, millet, corn gluten, corn germ flours defatted corn, sprouted cornmeal, oats, rye, triticale, rice, amaranth, tapioca flour, barley and even beer distillates, among others (Chavan et al., 1993). However, the replacement of wheat flour with others, can present important changes to be taken into account.
It has been observed that the substitution of wheat flour decreases the viscoelastic properties of the dough by the dilution of gluten. It is for the above, that substitutions of 10 to 20% have been shown to produce bread of acceptable quality and good organoleptic characteristics without an important impact on the color, crumb structure, texture and shelf life (Seibel, 2006).
Other researchers such as Verdu et al. (2015), investigated the effect of replacing wheat flour with chia at levels of 5, 10 or 15%, observing favorable effects on the gas retention capacity of the dough. Other studies have shown positive effects on bread firmness when 10% oatmeal and cornmeal have been used in wheat flour replacement, in addition to favoring the volume of the dough during fermentation. There are many cereals, vegetables or even by-products of the food industry that can be used to replace wheat flour; however, the use of these will depend greatly on the final properties that we wish to generate in the final product.
Oatmeal was used in this investigation, considering that it is the most nutritionally complete cereals, with high protein content (17%) and an important percentage of essential amino acids such as lysine (4.2 g 100 g-1 protein), as well as high content of soluble and insoluble dietary fiber (Serna-Saldivar, 1996). Based on the above, the objective established in this investigation was to evaluate the effect of replacing wheat flour with oat fiber meal with different particle size on the rheological, textural and baking properties.
Materials and methods
Raw material
Wheat flour (HT) and oat fiber flour (HFA) were used. Oat fiber was ground in a Pulvex Mill (Granulator Model, Mexico City). The flour obtained was passed through the 60 (250 µm) and 80 (177 µm) mesh (Dura Tap Sieve Shaker Model DT168, Advantech MFG, New Berlin, WI, USA) meshes to obtain two particle size fractions, the which were mixed with the HT in the proportions of: 10/90, 20/80 and 30/70 (weight/weight).
Moisture and protein analysis
Moisture and protein contents were determined by the following methods: 44-15.02, 46-13.01 (AACC, 2000).
Color determination
The Colorimeter was used (Konica Minolta Model Chroma Meter CR-400, Minolta Sensing, Inc., Osaka, Japan). The parameters evaluated were: L* (luminosity), a* (variation from red to green) and b* (variation from yellow to blue).
Viscosity analysis
The viscosity profile of the flours was obtained according to method 76-21.02 (AACC, 2000). The Rapid Visco Analyzer Super 4 viscometer, Newport Scientific Australia (RVA) was used. The standard test profile 1 was selected using the Thermocline software of the RVA.
Texture profile analysis in gels
The gels obtained after measuring the viscosity profile of the flours were measured. These were stored for 24 h at 8 °C. The TA-XT2 Texturometer (Texture Analyzer Stable Micro Systems, Surrey, UK) and the TA-3 device were used. The gel was compressed 50% of its height. The parameters obtained were firmness, elasticity, cohesiveness, rubberiness and chewiness (Verdú et al., 2015).
Water retention capacity (CRA)
The CRA was performed according to method 56-11.02 (AACC, 2000). The calculations were developed according to Haynes et al. (2009).
Strength (F) and extensibility (E)
The dough used was obtained from the Mixograph (National Mfg. Co. Lincoln, NE, USA), according to method 54-40.02 (AACC, 2000). The determination of F and E was performed following the technique described by Kieffer et al. (1998) at a test speed of 3.3 mm s-1, with a texture analyzer (TA-XT2, SMS/Kieffer dough extensibility Rig Stable Micro Systems, Godalming, Surrey, England).
Baking process
The baking process was carried out by method 10-10.03 (AACC, 2000). The ingredients (flour, yeast, sugar-salt solution, vegetable shortening and water) were mixed in the Mixograph bowl until the optimum kneading time. The obtained dough was introduced into a fermentation chamber at 30 °C and 90% RH for 40 min, then it was subjected to cooking at 215 °C for 17 min.
Bread weight
The bread was weighed on a scale (Sartorius Basic Model BA 210, Göttingen, Deutschland) after baking.
Volume measurement
The volume of the bread was calculated by the method of displacement with the rapeseed seed.
Texture profile analysis in bread
The bread was cut into slices 1.5 cm thick. The TA-XT2 Texturometer (Texture Analyzer Stable Micro Systems, Surrey, UK) and the TA-40 device were used. The test speed was 1.7 mm s-1 to compress the slice 50% of its height. The parameters obtained were firmness, elasticity, cohesiveness, rubberiness, chewiness and resilience (Verdú et al., 2015).
Water activity (aw)
From the crumb of the cold bread a disk of 4 cm in diameter and a thickness of 5 mm was taken. The AquaLab equipment (Dew Point Water Activity Meter 4TE, Pullman, WA, USA) was used to perform the analysis (Vásquez, 2016).
Statistical analysis
The design of experiments was completely randomized by one factor, the degree of replacement of HFA in HT. The results were analyzed by applying a multiple comparison procedure to determine which means are significantly different from others with a level of significance of 95%. To discriminate between the means, Fisher’s minimum significant difference (LSD) procedure was used. Statistical analysis was carried out with the Statgraphics Centurion XVI Program.
Results and discussion
Moisture, protein and color analysis of the flours
The results of moisture, protein, water retention capacity (CRA) and flour color are shown in Table 1. An increase in protein value was observed as the (%) substitution with fiber meal was increased. of oatmeal (HFA). This was more evident when the particle size of said flour was 177 µm (microns), reaching protein values of 13.51% with a difference of 1.56% greater than that determined in wheat flour (HT). In flours, this component is very important because of the capacity it shows in water retention, which can affect the functionality of the flours.
Table 1 Moisture, protein and color content of wheat flour (HT) and oat fiber meal flour (HFA) in different percentages with different particle sizes.
Flour |
Size particle (µm) |
Humidity (%) |
Protein (%) |
Color |
|||
L* |
a* |
b* |
|||||
177 |
10.15 |
11.95 |
66.63 ±0.77c |
94.61 ±0.22 |
0.14 ±0.01 |
7.58 ±0.11 |
|
HT-HFA 10% |
250 |
10.56 |
12.34 |
69.43 ±0.9d |
93.75 ±0.02 |
0.12 ±0.03 |
7.64 ±0.13 |
HT-HFA 20% |
250 |
10.22 |
12.73 |
77.52 ±0.57e |
92.94 ±0.05 |
0.27 ±0.02 |
7.81 ±0.02 |
HT-HFA 30% |
250 |
10.09 |
13.12 |
89.89 ±1.04f |
92.39 ±0.09 |
0.31 ±0.02 |
8.06 ±0.15 |
HT-HFA 10% |
177 |
10.51 |
12.47 |
63.43 ±0.61a |
94.15 ±0.12 |
0.13 ±0.01 |
7.59 ±0.11 |
HT-HFA 20% |
177 |
10.04 |
12.99 |
62.44 ±0.61a |
93.74 ±0.23 |
0.15 ±0.01 |
7.85 ±0.03 |
HT-HFA 30% |
177 |
10.26 |
13.51 |
64.88 ±0.42b |
93.53 ±0.35 |
0.19 ±0.04 |
7.91 ±0.15 |
HT= wheat flour; HFA= oat fiber flour; µm= microns; CRA= water retention capacity; L= luminosity; a= red to green; b= yellow to blue; (%)= level of replacement of HT with HFA. The percentage of protein is expressed on a dry basis.
However, in the bakery process not only a (%) high protein of the flours is important, so is the quality of these. This results in the formation of a gluten (gliadin and glutenin) with better viscoelastic properties with the possibility of forming a bread with a better specific volume, higher and rounded loaf. In general, it is assumed that a high presence of proteins and a special quality of bread shows that the viscoelastic properties of proteins are sufficient to explain the good volume of bread (Kieffer, 1998).
In the case of color, a decrease in L was observed with increasing % substitution for the two HFA particle sizes. Otherwise, it happened with the value of a and b.
This same behavior was observed by Hidalgo et al. (2014) in HT when the evaluation was carried out in flours with a size of 200 µm. Flour color parameters may be influenced by carotenoid content and genotypic characteristics, in addition to environmental conditions, grinding and storage conditions, among others.
With respect to CRA, significant increases were observed when the HFA used in the substitution of HT was 250 µm in particle size, even higher values were obtained than in HT (66.63%). The opposite happened when 177 µm HFA was used, observing values closer to that obtained in HT. Berton et al. (2002) attributed this behavior to the degree of grinding and the method used for grinding. In addition, they observed that the variation in the content of damaged starch, as well as the source of obtaining the flour are one of the most important factors in the variation of the CRA in the flours.
Viscosity analysis
The viscosity profile of the flours is observed in Table 2. The results obtained showed significant differences in the gelatinization temperature, observing differences of 16.68 °C to 20.23 °C for the flour mixtures with respect to HT. The swelling of the starch granule begins at the moment when the granule begins to hydrate being this an essential precursor for gelatinization, also when the starch is subjected to heat treatments in an aqueous environment undergoes a series of changes, absorbs water and swells breaking the crystalline structure forming a continuous gel.
Table 2 Viscosity profile of wheat flour (HT), and flours substituted with oat fiber meal (HFA) in different percentages with different particle size.
Flour |
Size particle (µm) |
Jelly Temperature (°C) |
Viscosity (cP) |
||||
Initial |
Final |
Minimum |
Breaking |
Restitution |
|||
177 |
69.38 ±0.02a |
2255 ±32.1b |
2787 ±31.8d |
1607 ±78.2b |
648 ±53.9b |
1180 ±46.4b |
|
250 |
89.61 ±0.87d |
1138 ±85.5a |
1649 ±74.6a |
822 ±62.1a |
316 ±24.8a |
826 ±23.1a |
|
250 |
86.06 ±0.44b |
2846 ±75.2e |
3522 ±14.4e |
1787 ±37.9cd |
1059 ±38.8e |
1734 ±48.6e |
|
250 |
86.61 ±0.46b |
2847 ±70.4e |
3764 ±87.3f |
1823 ±39.9c |
1024 ±33.5de |
1941 ±54.5f |
|
177 |
86.36 ±0.07b |
2587 ±6.65c |
3184 ±4.7c |
1721 ±35.5c |
866 ±28.9c |
1463 ±40.1c |
|
177 |
87.48 ±0.44c |
2737 ±52.7d |
3378 ±65.2d |
1753 ±69.6cd |
984 ±61.2d |
1625 ±58.1d |
|
177 |
88.05 ±0.05c |
2830 ±21.1de |
3596 ±25.7e |
1813 ±55.8cd |
1016 ±44.1de |
1782 ±80.1e |
|
HT= wheat flour; HFA= oat fiber flour; µm= microns; cP= Centipoise; (%)= level of replacement of HT with HFA. Means with the same letter within the column are not significantly different p< 0.05.
Studies conducted by Hüttner et al. (2010) worked with three different oatmeal to evaluate their baking capacity, which were analyzed in their viscosity profile obtaining gelatinization temperature values (82.37 to 83.57 °C) very similar to those obtained in this study. This gelatinization behavior was attributed to the amount of starch and the damaged starch in the flours, as well as the particle size. With regard to the initial and final viscosity, fundamental parameters in the rheological behavior of the flours, the tendency to increase was observed as the level of HT substitution increased.
This was best appreciated when 250 µm HFA was used in the replacement of 30% HT. The initial viscosity is related to a combination of the swelling of the starch granules and the rate of breakage of the granules. Flours with high swelling capacity of their starch granules tend to have a high initial viscosity. With regard to the final viscosity, increases in this parameter are associated with the formation of a gel during cooling due to a re-association between starch molecules, mainly by amylose generating increases in the final viscosity (Lei et al., 2008).
Parameters such as minimum viscosity, rupture and restitution showed a tendency to increase as the % substitution increased, this happened for the two HFA particle sizes (250 and 177 µm) used in this study. These parameters mentioned above are the result of a complex interaction between flours and water, affected by temperature and time and are frequently altered by the same flour by changing the time or temperature of the different stages.
Texture profile analysis in gels
Table 3 shows the texture results performed on the gels obtained during the viscosity analysis. The gel formed at the end of the RVA cooling cycle is essentially a three-dimensional network of intertwined amylose molecules that incorporate swollen, broken and dispersed starch granules. Baxter et al. (2004), observed an important relationship with the final viscosity of the gel and the reduction of firmness and adhesiveness. However, in our study, although if significant differences were observed in the initial and final viscosity of the gels obtained from the different flours, a behavioral pattern was not observed.
Table 3 Texture profile of the gels obtained from the viscosity profile of wheat flour (HT) and oat fiber meal flour (HFA) in the different percentages with different particle size.
Gel |
Particle size (µm) |
Firmness (N) |
Elasticity |
Cohesiveness |
Rubberiness |
Chewiness |
177 |
20.33 ±6.08d |
1.11 ±0.15b |
0.52 ±0.01ab |
10.72 ±3.32c |
11.68 ±2.05c |
|
250 |
3.4 ±0.26a |
0.97 ±0.01a |
0.45 ±0.07a |
1.21 ±0.24a |
1.51 ±0.35a |
|
250 |
14.72 ±4.58c |
0.96 ±0.01a |
0.51 ±0.02ab |
7.42 ±2b |
7.17 ±1.9b |
|
250 |
10.15 ±1.21bc |
0.97 ±0.01a |
0.53 ±0.03b |
5.38 ±0.34b |
5.24 ±0.31b |
|
177 |
4.89 ±0.14ab |
1 ±0.01ab |
0.52 ±0.02ab |
2.54 ±0.03a |
2.55 ±0.06a |
|
177 |
3.22 ±0.61a |
0.97 ±0.01ab |
0.48 ±0.01ab |
1.58 ±0.33a |
1.54 ±0.33a |
|
177 |
14.18 ±0.23c |
0.94 ±0.01a |
0.53 ±0.03b |
7.55 ±0.33b |
7.08 ±0.25b |
HT= wheat flour; HFA= oat fiber flour; µm= microns; N= Newton; (%)= level of replacement of HT with HFA. Means with the same letter within the column are not significantly different p< 0.05.
The firmness measurement showed significant differences between the gels obtained from the different flour mixtures and that of HT, examining in the latter the highest value for this firmness parameter. Regarding elasticity, significant differences were observed between HT and the values of the gels obtained when using 250 µm HFA in the substitution of HT. Contrary to this, the determination of cohesiveness showed no significant differences. On the other hand, the gum and chewable results did show significant differences between the gels obtained from the different substitutions; however, these differences were more evident when compared with the values obtained from HT.
The previous behavior observed for this texture profile may have been influenced by the concentration of starch, protein, time and temperature, agitation, as well as particle size that are determinants in the viscosity profile of the flours, which results in influencing in the resulting gel that was used to measure the texture profile.
Strength (F) and extensibility (E)
The results of F and E are shown in Figure 1. The F increased in all the doughs obtained from the flour mixtures that were made with HFA and HT in the different (%) substitution, being more evident when HFA was used ( 250 µm) at 30%, registering values of 0.61 N, more than double that obtained from HT (0.25 N). Similar values were also observed in this parameter of F when HFA (177 µm) was used, obtaining values with ranges from 0.32 to 0.39 N. The most similar ones (0.33 and 0.32 N) were obtained in the substitutions of 20 and 30%, respectively.
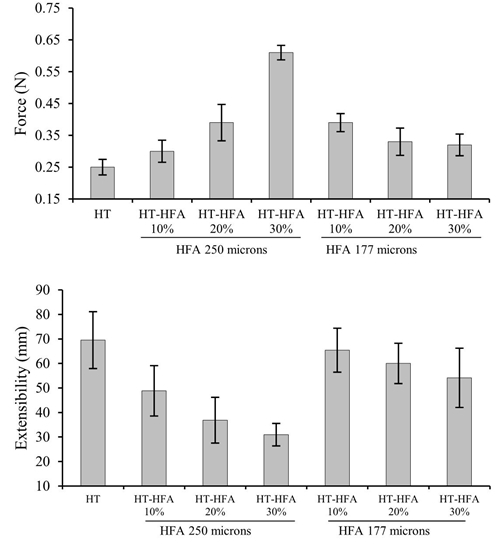
Figure 1 Strength and extensibility of the dough obtained from wheat flour (HT) and the flours substituted with oat fiber flour (HFA) in the different percentages with different particle size.
The strength of the dough can be a determining factor in the quality of bread. The lack of strength or excess of it is capable of causing problems of regularity in the quality of bakery products. Important factors that can influence this parameter are the quantity and quality of the gluten present in the flours, as well as the kneading conditions. Studies conducted by Islas et al. (2005), found that the extensibility and strength of the dough depends to varying degrees on the protein composition, the total amount of glutenin in the flours and the proportion of polymeric and monomeric proteins.
In the case of E, a very particular behavior was recorded when HFA (250 µm) was used, the E tended to decrease as the (%) substitution increased, an inverse behavior to that of F. The lowest values (30.94 mm) were observed when the substitution was 30%. This same behavior was also observed when HFA (177 µm) was used. The tendency was to decrease as was the replacement with HFA (250 µm); however, not in the same magnitude. The 30% substitution (54.14 mm) with HFA (177 µm) showed values of more than 23 mm difference with respect to the same percentage of substitution with HFA (250 µm).
The industrial characteristics of the dough such as strength and extensibility, and the quality of the final product derived from wheat are partially determined by the amount of protein. Important effects on extensibility are determined by high molecular weight and low molecular weight glutenins, in addition to gliadins, protein fractions found in cereals. However, the high molecular weight of glutenins is not only the reason for the appearance of extensibility. It is the fact that gluten proteins are exceptionally cohesive, mainly due to their ability to form hydrogen bonds between the side chains of the amino acid glutamine, which accounted for 35% of all residues (Kieffer, 1998).
In general terms, it was observed that the highest values in extensibility (69.52, 65.41 and 60.01 mm) together with force values of 0.25, 0.39 and 0.33 N respectively, were the doughs that produced the highest specific volumes of bread.
Physical properties of bread
Among the physical properties analyzed in bread were weight (g), volume (cm3), specific volume (cm3 g-1) and water activity. These results are observed in Figure 2. Regarding the weight of the bread that has an important relationship with the loss of dough during cooking, this is the loss of water after the bread is made. Studies conducted by Verdú et al. (2015) with chia flour at different replacement percentages (5, 10 and 15%) of wheat flour obtained a reduction in the weight loss of bread by increasing the degree of substitution.

Figure 2 Weight (g), volume (cm3), specific volume (cm3 g-1) and water activity (aw) of bread obtained from wheat flour (HT) and flours replaced with oat fiber meal (HFA) in different percentages with different particle size.
In our study this behavior was not observed, contrary to this a minimum increase (1.48 g) of the bread weight was obtained when using HFA (250 µm) at a replacement level of 30%, with respect to that obtained from HT (47.69 g). In contrast, when using HFA (177 µm) at the same substitution level of 30%, a tendency to decrease (47.61 g) was analyzed, although very close to that obtained in HT. On the other hand, when the bread volume was analyzed, a decrease in this was obtained by increasing the (%) substitution with HFA, this was more evident when the 30% substitution was made with 250 µm HFA (116.65 cm3) with regarding the elaborated only of HT (217.68 cm3).
It was also noted that when HFA (177 µm) was used at 10 or 20% (218.88 and 213.56 cm3, respectively) in the replacement of HT, the values obtained were very similar to those of HT. This is possible to explain how a dilution of HT gluten by increasing the % substitution with HFA. The optimal development of gluten is vital for the development of bread and crumb structure, this has an important relationship with the specific volume of bread.
Regarding the specific volume, important improvements were registered when 177 µm HFA was used, the smaller particle size favored the substitutions at 10 or 20% of HT, observing values very similar to that obtained from HT (4.57 cm3 g-1). This parameter is influenced by the quality and quantity of the proteins capable of forming a gluten with good viscoelastic characteristics and doughs with force to encapsulate the air generated during the fermentation process.
Finally, regarding the water activity of the breads obtained from the different mixtures, we can say that no significant changes were observed, values of around 0.9 were reached, value considered as normal in baking.
This parameter is important to keep below 0.95 to avoid the rapid development of fungi and yeasts that could affect the shelf life of the product. Studies conducted by Verdú et al. (2015)when making bread with mixtures of wheat flour and chia obtained values higher than those found in our study with ranges from 0.96 to 0.98.
Texture profile analysis
The texture profile of the loaves obtained is presented in Figure 3. This analysis is a technique that tries to use common bases for the subjective and objective methods used to estimate the quality associated with palatability/chewiness. Breads with lower or softer firmness values were obtained when 177 µm HFA was used in the replacement of HT in the 3 different % substitution (4.86, 4.71 and 7.05 N, respectively), otherwise this happened when 250 µm HFA was used, the above was more evident when the substitution occurred at 30% (57.39 N).

Figure 3 Texture profile of the bread obtained from wheat flour (HT) and the flours substituted with oat fiber flour (HFA) in the different percentages with different particle size.
Studies conducted by Gianonne et al. (2016) related to the aging of wheat bread, they observed that high firmness values were attributed to a low fermentative capacity along with the low gluten content and the excessive tenacity of gluten. With regard to elasticity and cohesiveness, these parameters showed a tendency to decrease as the % substitution for the two HFA particle sizes (250 and 177 µm) increased.
In addition, they found that the cohesiveness of bread is related to the degree of integration of the flour components in the dough matrix. As regards gum and chewiness, they did not show significant differences when HFA (177 µm) was used in the three % substitution; however, if there was a tendency to increase with increasing % substitution with HFA (250 µm), this could be better appreciated when it was used at 30%, observing values of 22.41 and 17.34, well above those found in HT (0.59 and 4.68, respectively) for these same parameters.
Regarding gum, studies by Bhol and Bosco (2014), observed important effects in this parameter with the influence on the water absorption capacity and variations in the chemical composition of breadcrumbs. With regard to chewiness, studies conducted by López and Goldner (2015), observed an important relationship with the level of dehydration of the crumb. At higher dehydration, crumbs showed lower chew values. Finally, the resilience parameter showed the same trend as cohesiveness.
There was a decrease by increasing the (%) substitution for the two particle sizes (250 and 177 µm) of HFA used in this study. This decrease was most noticeable when using HFA (250 µm) to replace HT in 30%. Studies carried out by Vásquez (2016), observed this same behavior when in making bread used oatmeal, corn or sorghum in the replacement of wheat flour.
The above may be related to the decrease in CRA of flour mixtures by increasing the (%) replacement of HT. Studies conducted by López and Goldner (2015) concluded that the parameters related to the bakery texture profile are determined by the quality, variety and chemical composition of the flours involved in the bakery process.
Conclusions
The use of HFA of a smaller particle size (177 µm) in the replacement of HT at 10 or 20%, favored a better balance of strength and extensibility in the doughs, as a consequence of this it was the obtaining of breads with very similar volume to the elaborated only of HT. Softer breads were also obtained when this same HFA particle size was used in the three % substitution, it even improved to that obtained only HT, regardless of whether the CRA observed in these flour mixtures has been less than quantified in wheat flour.
Literatura citada
AACC. 2000. Approved Methods of American Association of Cereal Chemists. 11th Ed. The association, St. Paul, MN, USA. Method 10-10.03 Optimized straight-doug bread-baking, method 44-15.02 moisture-air-oven, method 46-13.01 crude protein-micro Kjeldhal, Method 54-40.02 Mixograph, Method 56-11.02 solvent retention capacity profile, method 76-21.02 General Pasting Rapid Visco Analyser. [ Links ]
Baxter, G.; Blanchard, C. and Zhao, J. 2004. Effects of prolamin on the textural and pasting properties of rice flour starch. J. Cereal Sci. 3(40):205-211. [ Links ]
Berton, B.; Scher, J.; Villieras, F. and Hardy, J. 2002. Measurement of hydration capacity of wheat flour: Influence of composition and physical characteristics. Powder Technol. 2(128):326-331. [ Links ]
Bhol, S. and Don Bosco, S. 2014. Influence of malted finger milllet and red kidney bean flour on quality characteristics of developed bread. LWT-Food Sci. Technol. 55(1):294-300. [ Links ]
Chavan, J. K.; Kadam, S. S. and Ramka, R. N. 1993. Nutritional enrichment of bakery products by supplementation with nonwheat flours. Critical Reviews Food Sci. Nutr. 33(3):189-226. [ Links ]
Giannone, V.; Lauro, M. R.; Spina, A.; Pasqualone, A.; Auditore, L.; Puglisi, I. and Puglisi, G. 2016. A novel α-amylase-lipase formulation as anti-staling agent in durum wheat bread. LWT-Food Sci. Technol. 65(2):381-389. [ Links ]
Haynes, L. C.; Bettge, A. D. and Slade, L. 2009. Soft wheat and flour products methods review: Solvent retention capacity equation correction. AACC International Report. 4(54):174-175. [ Links ]
Hidalgo, A.; Fongaro, L. and Brandolini, A. 2014. Wheat flour granulometry determines colour perception. Food Res. Inter. 64(10):363-370. [ Links ]
Hüttner, E. K.; Dal Bello, F. and Arendt, E. K. 2010. Rheological properties and bread making performance of commercial wholegrain oat flours. J. Cereal Sci. 1(52):65-71. [ Links ]
Islas, A. R.; MacRitchie, F.; Gandikota, S. and Hou, G. 2005. Relationships of protein composition and dough rheological measurements with breadmaking performance of wheat flours. Rev. Fitotec. Mex. 28(3):243-251. [ Links ]
Kieffer, R.; Wieser, H.; Henderson, M. H. and Graveland, A. 1998. Correlations of the breadmaking performance of wheat flour with rheological measurements on a micro-scale. J. Cereal Sci. 1(27):53-60. [ Links ]
Lei, F.; Ji Chung, T.; Cai Ling, S. and Chun, L. 2008. RVA and farinograph properties study on blends of resistant starch and wheat flour. Agric. Sci. China. 7(7):812-822. [ Links ]
López, E. P and Goldner, M. C. 2015. Influence of storage time for the acceptability of bread formulated with lupine protein isolate and added brea gum. LWT-Food Sci. Technol. 64(2):1171-1178. [ Links ]
Seibel, W. 2006. Composite flours. In future of flour: a compendium of flour improvement. Popper, L. (Ed.). Verlag AgriMedia. 193-198 pp. [ Links ]
Serna-Saldívar, S. O. 1996. Química, almacenamiento e industrialización de los cereales. AGT, Editor, SA. México, DF. 61-65 pp. [ Links ]
Vásquez, F. 2016. Control y mejora de la panificación de masas bajas en harina de trigo. Universidad Politécnica de Valencia, España. Tesis de doctorado. 76-102 pp. [ Links ]
Verdú, S.; Vásquez, F; Ivorra, E.; Sánchez, A. J.; Barat, J. M. and Grau, R. 2015. Physicochemical effects of chía (Salvia hispanica) seed flour on each wheat bread-making process phase and product storage. J. Cereal Sci. 1(65):67-73. [ Links ]
Received: November 01, 2019; Accepted: February 01, 2020
 Este es un artículo publicado en acceso abierto bajo una licencia
Creative Commons
Este es un artículo publicado en acceso abierto bajo una licencia
Creative Commons
