


Services on Demand
Journal
Article
 text in
  English (pdf)
 Article in xml format
 Article references
 Send this article by e-mail
Indicators
-
 Cited by SciELO
 -
 Access statistics
Related links
-
 Similars in
SciELO
Similars in
SciELO
Share

 Permalink
Revista mexicana de ciencias agrícolas
Print version ISSN 2007-0934
Rev. Mex. Cienc. Agríc vol.10 n.8 Texcoco Nov./Dec. 2019 Epub Feb 05, 2021
https://doi.org/10.29312/remexca.v10i8.1765
Articles
Preliminary study to determine phenotypic differences and sample size in Cacahuacintle corn
1Centro de Investigación y Estudios Avanzados en Fitomejoramiento-Facultad de Ciencias Agrícolas-Universidad Autónoma del Estado de México. El Cerrillo Piedras Blancas, Toluca, Estado de México. AP. 435. Tel. 722 2965518, ext. 148. (ironmaden77@hotmail.com; djperezl@uaemex.mx).
2Campo Experimental Valle de México-INIFAP. Carretera Los Reyes-Texcoco km 13.5, Coantlichán, Texcoco, México. CP. 50250. Tel. 01 (800) 0882222, ext. 85353. (sangerman.dora@inifap.gob.mx; navarro468@yahoo.com.mx).
This study was carried out in spring-summer of 2016 in six communities of the municipality of Calimaya de Díaz González, State of Mexico to sample land of cooperating farmers and estimate phenotypic differences in plant and corn dimensions in the Cacahuacintle breed. In 30 plots, of one hectare each, distributed in the Municipal District, San Lorenzo Cuauhtenco, Santa María Nativitas, San Marcos de la Cruz, San Diego La Huerta and Zaragoza de Guadalupe, 50 plants and corn per producer were considered at random (almost 21 000 data). Simple statistics and values of n were calculated with two methodologies. With a principal component analysis, the relationship between producers, communities and variables was analyzed. The most outstanding results showed that there are important phenotypic differences in all characteristics. The values of n would allow sampling plots where Cacahuacintle is planted in that municipality, with method 1, only the population size should be known and a value assigned to the sampling error should be chosen. With the application of method 2 or other complementary techniques, fewer plants could be sampled than with method 1 but the arithmetic mean, standard deviation, standard error, coefficient of variation or proportions between two of these should be known. In the four quadrants of the biplot, at least three of the five cooperating farmers in each locality were grouped. There was a positive and significant correlation between the number of quality leaves for wrapping tamales (NHT) with the number of grains and rows of grain in the corn, this trend was also observed between the first and the length and diameter of the spine. Thus, NHT could be used as an indirect selection criterion to increase the size of the corn.
Keywords: Cacahuacintle race; High Valleys of central Mexico; plots of cooperating farmers; random sampling
Este estudio se hizo en primavera-verano del 2016 en seis comunidades del municipio de Calimaya de Díaz González, Estado de México para muestrear terrenos de agricultores cooperantes y estimar diferencias fenotípicas en las dimensiones de planta y elote en la raza Cacahuacintle. En 30 parcelas, de una hectárea cada una, distribuidas en la Cabecera Municipal, San Lorenzo Cuauhtenco, Santa María Nativitas, San Marcos de la Cruz, San Diego La Huerta y Zaragoza de Guadalupe, fueron consideradas al azar 50 plantas y elotes por productor (casi 21 000 datos). Se calcularon estadísticos simples y valores de n con dos metodologías. Con un análisis de componentes principales se analizó la relación entre productores, comunidades y variables. Los resultados más sobresalientes mostraron que hay diferencias fenotípicas importantes en todas las características. Los valores de n permitirían muestrear parcelas donde se siembra Cacahuacintle en ese municipio, con el método 1 sólo debe conocerse el tamaño de la población y elegir un valor asignado al error de muestreo. Con la aplicación del método 2 o de otras técnicas complementarias, podrían muestrearse menos plantas que con el método 1 pero deben conocerse la media aritmética, la desviación estándar, el error estándar, el coeficiente de variación o proporciones entre dos de éstos. En los cuatro cuadrantes del biplot se agruparon al menos tres de los cinco agricultores cooperantes de cada localidad. Hubo correlación positiva y significativa entre el número de hojas para envolver tamales (NHT) con el número de granos e hileras de grano en el elote, esta tendencia también se observó entre la primera y la longitud y el diámetro del raquis. Así, NHT podría emplearse como criterio de selección indirecta para incrementar las dimensiones del elote.
Palabras clave: muestreo aleatorio; parcelas de agricultores cooperantes; raza Cacahuacintle; Valles Altos del centro de México
Introduction
In Mexico, farmers contribute to the conservation and generation of genetic diversity in situ by selecting cobs and grains in their best creoles; through the morphological variants that have been presented by natural selection, mutation, introduction, recombination and geographic isolation, they are still creative and innovative when recombining them with each other or with materials of other races to increase this diversity (Wellhausen et al., 1951; González et al., 2006; Valdivia et al., 2010; Romero et al., 2018).
The Mexican breeds used for the production of corn and pozole are Ancho, Bofo, Bolita, Blanco de Sonora, Cacahuacintle, Elotes Occidentales, Gordo, Harinoso de ocho hileras, Jala and Tabloncillo, among others; In the first, farmers have practiced selection to increase grain size and quality, as well as totomoxtle, which have been favored by the environments that predominate in their ecological niche (Romero et al., 2018).
The Dulcillo del Norte races of rough grain and Elotero de Sinaloa are grown for tortillas, and their corn is delicious and sweeter. In the state of Hidalgo, the creoles corn is preferred for their sweetness and in Guanajuato the conical or western corn, of red and blue grains, stand out for their excellent tortillas of good color, softness and more anthocyanins. In Chiapas, the prices of a corn bought in the field vary from $1.00 to $2.50 and come from improved varieties or hybrids; their corn is long, with more rows of grain and up to 13.8 °Brix (Aguilar et al., 2006; Coutiño et al., 2010).
The localities and the years of evaluation associated with the Mexican central plateau contribute to the differences observed in producer lands or in trials established in the experimental stations (Reynoso et al., 2014). In the Toluca Valley, State of Mexico, both factors or their combination, soil types, altitude, temperature and precipitation, hail and frost are the main components of their heterogeneity (González et al., 2006; González et al., 2008; González et al., 2010). The Cacahuacintle race is marketed mainly for the production of corn and as a blunt grain for the elaboration of pozole; its grain yields in commercial and experimental sowing vary from 2.5 to 10.3 t ha-1, but its production as a blunt grain is 2 000 to 4 000 kg ha-1, with a price between $2 and just over $9.50 kg-1 in the time of greatest demand. Up to 20 000 quality corn can be produced in 50 000 plants ha-1 (Ramos and Gerón, 1998; Aguilar et al., 1999; González et al., 2006; Arellano et al., 2010).
Since the 50’s several features have also been improved in this special use corn. In experiments established in farmers’ plots the height of the plant varied from 2.24 to 2.47 m, the height of the cob from 1.25 to 1.67 m, the length of the cob is between 13.21 and 14. 43 cm, between 12 and 14.22 rows have been recorded of grain, the diameter of the cob is between 5.41 and 5.67 cm and the weights of olote and grain per cob range from 21.5 to 26.1 g and from 127.7 to 146.3 g, respectively, with yields of 4 066 to 6 379 kg ha-1 . However, this breed has little adaptability in other municipalities of the Mexican center, has a late biological cycle and is very susceptible to stem and root acame, and to the cob and grain rot caused by Fusarium spp., among others (González et al., 2006, 2007, 2008, 2010).
Cacahuacintle and Palomero Toluqueño are parents of the Conical race, and the latter and Tuxpeño gave rise to the Chalqueño racial complex (Wellhause et al., 1951), the former has also been used to form corn varieties and could be an excellent progenitor of forage varieties (Franco et al., 2015). Currently there are no improved or hybrid varieties and farmers are the owners of the empirical knowledge related to their technology (Aguilar et al., 1999; González et al., 1999). There are no data on sample sizes and little has been published about its variability, especially in dimensions of the spine and its relationship with performance and performance components (González et al., 2006, 2008).
Simple statistics are used in the majority of sampling methodologies for quantitative variables (Cochran, 1998; Pérez, 2005), hence the importance of obtaining preliminary data on their variability that allows us to reliably recommend how many farmers, plants, corncobs and cobs should considered (Gónzalez et al., 2006; González et al., 2008). Thus, the objectives of this study were to sample producer lands by plant and corn characteristics, propose sample sizes with two methodologies and define some relationships between agronomic variables.
Materials and methods
Description of the experimental area
This municipality is located 17 km south of Toluca. The municipal seat is located at 19° 09’ 30’’north latitude and 99° 37’17’’ west longitude, at 2 650 meters above sea level. Its subhumid temperate climate has an annual average of 12.8 °C, minimum and maximum of -4 and 26 °C. Its Andosol soils are derived from volcanic ash, acidic pH (between 3.8 and 6) and rest on a volcanic substrate of loose pumicite (tepojal), between 40 and 100 cm. It is made up of San Diego La Huerta (SD), Cabecera Municipal (CM), San Lorenzo Cuauhtenco (SL), Santa María Nativitas (SM), Zaragoza de Guadalupe (ZG), San Marcos de la Cruz (SMC), San Bartolito, San Andrés Ocotlán and Concepción Coatipa (Ramos and Gerón, 1998; González et al., 1999; González et al., 2006).
Genetic material
In this study, the 30 producers were considered shown in Table 1.
Table 1 Cooperating farmers and participating communities.
| Producer | Location | Abbreviation |
| Leobardo Jasso | Calimaya | CM |
| Francisco Bobadilla | Calimaya | CM |
| Fabián Espinoza | Calimaya | CM |
| Benjamín Rosas | Calimaya | CM |
| José Manjarrez | Calimaya | CM |
| Sergio Medina | San Lorenzo Cuauhtenco | SLC |
| Federico Colín | San Lorenzo Cuauhtenco | SLC |
| Salvador Delgado | San Lorenzo Cuauhtenco | SLC |
| Edilberto Carmona | San Lorenzo Cuauhtenco | SLC |
| Gregorio Jasso | San Lorenzo Cuauhtenco | SLC |
| Sergio Sánchez | San Diego la Huerta | SDH |
| Esteban López | San Diego la Huerta | SDH |
| Miriam Salazar | San Diego la Huerta | SDH |
| Amelia Robles | San Diego la Huerta | SDH |
| Tomas Mendoza | San Diego la Huerta | SDH |
| Roque Bobadilla | San Marcos de la Cruz | SMC |
| Santiago Bobadilla | San Marcos de la Cruz | SMC |
| Doroteo Carmona | San Marcos de la Cruz | SMC |
| Leónides Bobadilla | San Marcos de la Cruz | SMC |
| Silvio Carmona | San Marcos de la Cruz | SMC |
| Roberto Rosas | Zaragoza de Guadalupe | ZG |
| Ariel Colín | Zaragoza de Guadalupe | ZG |
| Fidel Jasso | Zaragoza de Guadalupe | ZG |
| Juan Rosas | Zaragoza de Guadalupe | ZG |
| Jorge Colín | Zaragoza de Guadalupe | ZG |
| Melitón Muciño | Santa María Nativitas | SMN |
| Amando Alegría | Santa María Nativitas | SMN |
| Edén Corrales | Santa María Nativitas | SMN |
| Francisco Alegría | Santa María Nativitas | SMN |
| Rubén Corrales | Santa María Nativitas | SMN |
Preliminary sample size
It was considered that: a) the value of N is known, but there is no information on n; b) random sampling without replacement will be applied to record simple statistics in r quantitative variables; c) the six locations are representative of that municipality; and d) the choice of plants with complete competence was made in 400 m2 of the center of one ha.
The first methodology was proposed by Rendon and Cervantes (1991) and is based on:
(i = 1, 2, 3 ,…, r)
Where: N and n are farmers and plants and corn considered, bi fluctuates from zero to one and is the proportion of the standard deviation (σi) for each of r variables (the smaller the more reliable, but the demand for more time and human resources and financial). This equation does not depend on unknown parameters and because of its simplicity it can be used to generate tables of n at different values of N and bi; its application leads to:
a) For N= 2 350 farmers (González et al., 1999) and bi= 0.2
b) In commercial planting of 50 000 ha-1 plants
N and n were approximate to 30 farmers and 50 plants and corn per farmer (almost 21 000 data) and the bi values used in the preliminary sampling were 0.05, 0.075 and 0.1.
Preliminary calculation of n with InfoStat
In this, the value is obtained to estimate a population average or proportion with a confidence of precision determined by the user. It also allows calculating n to detect, in a variance analysis of a fixed effects model in monofactorial experiments, a difference between means of groups or populations as small as specified by the user, as well as the sample size to estimate the difference between two populations (Balzarini et al., 2008; Di Rienzo et al., 2008). To estimate n the following is used.
Where: σ is the standard deviation, c is the amplitude required for the confidence interval (1-α) % for the population mean, c can be chosen arbitrarily or expressed as a fraction ‘f ’ of the sample mean (c= Ȳf) . In this study f took values of 0.05, 0.075 or 0.1.
Data register
They were quantified (CIMMYT, 1999; González et al., 2011): female flowering (FF; days), plant and corn heights (AP, AM; cm), stem diameter (DT; cm), length (LR), diameter (DR) and rachis weight (PR) (cm, cm, g), length (LE; cm) and corn diameter (DE; cm), rows of grain (NH), corn weight (PE; g) and quality leaf for wrapping tamales (NHT).
Statistical analysis
Simple statistics were obtained with the statistical analysis system (SAS) version 6.03 for Windows and with InfoStat (2008). The procedures are described in Gómez and Gómez (1984). An analysis of main components was also made with 30 farmers and 12 variables and another with six locations and those variables (Sánchez, 1995; González et al., 2010).
Results and discussion
Simple statisticians
The female flowering (FF) varied from 85 to 125 days, its mean and range were 103.47 and 40 days. Male flowering and FF are positively and significantly correlated and so are with physiological maturity; they are a reliable indicator of the biological cycle of Cacahuacintle but differ in part from that published by Arellano et al. (2010); González et al. (2006, 2008).
In Table 2 shows the heights of plant and corn (AP and AM) ranged from 1.26 to 3.9 m and from 1 to 2.9 m, their averages were 2.67 and 1.61 m. Both averages are similar to those recorded by González et al. (2006) and by Arellano et al. (2010). The stem diameters (DT) varied from 2.5 to 4.6 cm, their average was 3.07 cm, these are primary components of the grain and forage yield in maize of the Mexican center (Franco et al., 2015). In creoles, positive and significant correlations have been observed between them, but with higher plants there is more acame and cob rot and less grain yield (González et al., 2007; Arellano et al., 2010).
Table 2 Simple statistics for Cacahuacintle corn planted in farmers’ lands of the municipality of Calimaya, state of Mexico. 2016 data.
| Variable | n | Min | Max | Media | S2 | DE | EE | CV | As | Ku |
| FF | 1 460 | 85 | 125 | 103.47 | 78.92 | 8.89 | 0.23 | 8.59 | 0.24 | -0.77 |
| AM | 1 460 | 1 | 2.9 | 1.61 | 0.06 | 0.25 | 0.01 | 15.4 | 0.93 | 2.91 |
| AP | 1 460 | 1.26 | 3.9 | 2.67 | 0.12 | 0.35 | 0.01 | 12.97 | -0.28 | 1 |
| DT | 1 460 | 2.5 | 4.6 | 3.07 | 0.21 | 0.46 | 0.01 | 13.84 | 0.74 | 0.12 |
| NH | 1 460 | 6 | 26 | 12.08 | 3.52 | 1.88 | 0.05 | 15.54 | 0.27 | 3.13 |
| DCH | 1 460 | 4.6 | 9.7 | 7.16 | 0.50 | 0.71 | 0.02 | 9.88 | -0.16 | 0.17 |
| DM | 1 460 | 3.6 | 7.7 | 5.89 | 0.33 | 0.57 | 0.02 | 9.76 | -0.24 | 0.22 |
| NG | 1 460 | 11 | 40 | 24.75 | 17.6 | 4.2 | 0.11 | 16.95 | -0.28 | 0.52 |
| NHT | 1 460 | 0 | 7 | 2.92 | 0.78 | 0.88 | 0.02 | 30.19 | 0.69 | 1.27 |
| DR | 1 460 | 1.5 | 2.1 | 1.85 | 0.04 | 0.12 | 0.31 | 6.41 | -0.28 | -0.39 |
| LR | 1 460 | 3 | 30 | 13.09 | 16.59 | 4.07 | 0.11 | 31.13 | 0.45 | 0.38 |
| LE | 1 460 | 7.1 | 30 | 20.38 | 6.7 | 2.59 | 0.07 | 12.71 | -0.14 | 1.31 |
| PE | 1 460 | 100 | 999 | 530.44 | 18498 | 136.06 | 3.56 | 25.65 | 0.29 | 0.23 |
| PR | 1 460 | 5 | 90 | 27.2 | 188.94 | 13.75 | 0.36 | 50.55 | 0.72 | 0.61 |
FF= flowering; AM and AP; corn and plant heights; DT= stem diameter; NH= number of rows; DCH and DM= diameters with leaves and corn; NG and NHT= number of grains and leaves for tamale; DR and LR= rachis diameter and length; LE and PE= corn length and weight; PR= spine weight; n sampled plants; min, max, minimum and maximum; S2= variance; DE and EE= standard deviation and error; CV= coefficient of variation; As= asymmetry; Ku, Kurtosis.
The number of rows (NH) varied from 6 to 26, with an average of 12.08. In other NH studies, it ranged from 8 to 20, with an average of 14. Cacahuacintle cobs with six rows had not been detected and with only 26 in Palomero Toluqueño (González et al., 2006; González et al., 2008). In the first case perhaps sterility or insects damaged two rows of grain.
The diameter of corn with leaves (DCH) varied from 4.60 to 9.70 cm, with an average of 7.16 cm. The corn diameters (DM) were located between 3.6 and 7.7 cm, with an average of 5.81 cm. Both are components of the corn’s visual quality; the best ones will be commercialized between $0.50 and just over $2.00 per piece (Aguilar et al., 2006; González et al., 2006).
The number of grains in a row of corn (NG) ranged from 11 to 40, with an average of 24.75. Grains and cobs per plant and grain weight are reliable indicators of the productivity of a cultivar (Andrade et al., 2000). Arellano et al. (2010) recorded between 0.63 and 1.28 cobs per plant in Cacahuacintle, with weights of 100 seeds between 33 and 67 g. With 12 rows per cob there would be between 132 and 480 grains. If 80% of 50 000 ha-1 plants produce cob there would be between 5 280 000 and 19 200 000 grains, if all the grains of the cob are used as seed, they could be planted between 88 and 320 ha.
The number of quality leaves for wrapping tamales (NHT) ranged from 0 to 7, with an average of 2.92. In times of greatest demand, a profit of up to $3.00 per chosen plant is obtained. In this and other surrounding municipalities there are people specialized in exploiting this activity to supply the local markets of the Toluca Valley. There are no studies in this breed to determine whether NHT could be considered as an indirect selection criterion.
Spinal diameters (DR) ranged between 1.5 and 2.1 cm, with an average of 1.85 cm. The length of the spine (LR) varied from 3 to 30 cm, with an average of 13.09 cm. Spine weights (PR) differed from 5 to 90 g, with a central value of 27.2 g. It would be desirable to define whether these are important in the translocation of assimilated leaves and stems to the corn or the cob to use them as criteria for indirect selection in plant breeding and seed production.
The length of the corn (LE) ranged from 7.1 to 30 cm, its average was 20.38 cm. Corn weights with totomoxtle (PE) varied from 100 to 999 g, with an average of 530.44 g (Table 2). These results are mainly attributed to the efficient empirical improvement that farmers have made and the application of better technological packages. Both are very important to obtain a better price, in other regions of Mexico, a corn bought in the field costs from $1.00 to $2.50 at the time of greatest demand (Aguilar et al., 2006; Arellano et al., 2010; Coutiño et al., 2010). Long cobs, 8 and 12 rows, would be used for the production of pozole and those between 14 and 16 would be marketed as corn (Aguilar et al., 1999; González et al., 2006), but the corn of the Jala breed should be considered up to 60 cm (Aguilar et al., 2006). In corn diameter, with and without totomoxtle, its dimensions are larger than those recorded in the other four races of High Valleys of Central Mexico (González et al., 2007; González et al., 2008).
Principal component analysis
The results observed in Figure 1 confirm that in the municipality of Calimaya there are very heterogeneous environmental conditions; there are altitude gradients from 2,610 to more than 3 000 m (Aguilar et al., 1999; González et al., 2006; Arellano et al., 2010). These differences are not observable in the Tenango del Valle-Toluca-Atlacomulco region, except in its mountainous parts (González et al., 2008, 2011). Calimaya’s agriculture is rainfed, so temperature, humidity, hail and frost, together with the heterogeneity of its soils, have contributed to its differentiation (Aguilar et al., 1999; González et al., 1999). Although there are few, little genetic variability has been estimated in this breed, which supports the previous results (González et al., 2006; González et al., 2008).
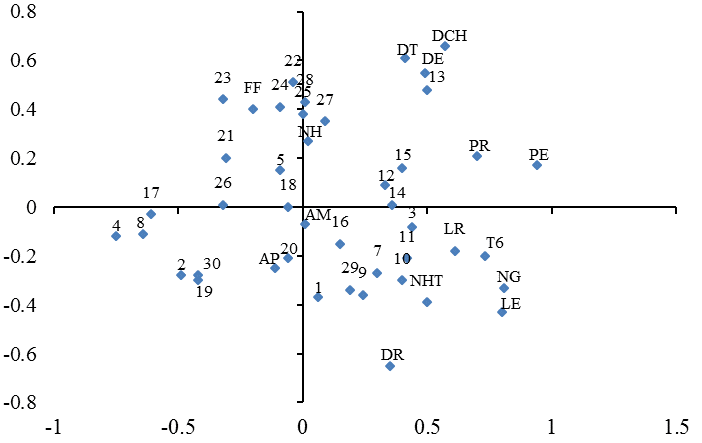
Figure 1 Biplot for cooperating producers (in number) of the municipality of Calimaya and variables evaluated (in letters) in Cacahuacintle corn.
The other components that contribute to this differentiation are the empirical genetic improvement that the farmers have made, the diversity of technological packages that they apply and the different agronomic management they provide to their plots (Aguilar et al., 1999; González et al., 1999). In trials conducted on farmers’ lands it has been estimated that the genetic variability in Cacahuacintle varied from 15.9 to 50.2% in plant and cob heights, length and rows of the cob and grain yield, but in cob diameter, pot weights and there were negative estimates of grain per plant and volumetric (González et al., 2006).
Regarding the variables, several groups (G’s) were detected: in G1 FF and NH were identified, in G2 the stem, corn and corn leaf diameters were observed; in G3 the rachis and corn weights appeared. In G4, rachis length and diameter stood out, number of quality leaves for wrapping tamales, number of grains per row and length of corn, in G5, plant and cob heights were associated (Figure 1). González et al. (2006) concluded that grain yield had a greater relationship with plant and cob heights, and length, diameter, and weights of grain and pot per cob.
The previous results also suggest stratifying the sampling area to reduce the environmental differences that exist between locations, as González et al. (2006); González et al. (2008); Arellano et al. (2010); Romero et al. (2018).
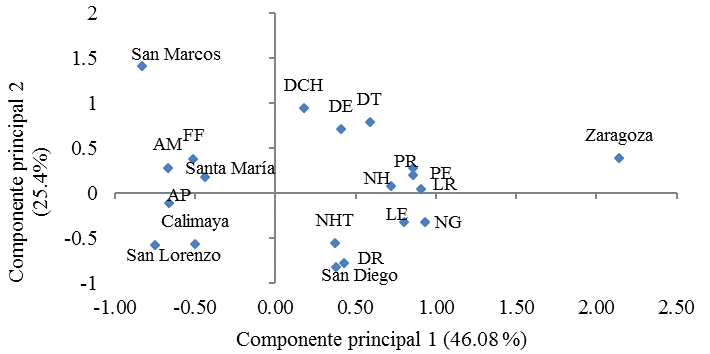
The interrelations shown in Figure 2 have been verified in the Cacahuacintle creole evaluation experiments in Calimaya (González et al., 2006; González et al., 2008a, b), but there are no antecedents for the dimensions of the spine. González et al. (2011) concluded that the dimensions of the spine were positively and significantly correlated with grain yield in maize of the Conical breed. These results also suggest that the collection of creoles where Cacahuacintle predominates could be used to form a balanced compound that could be used to conserve, increase and use its genetic diversity in situ, or cross these compounds with other breeds of flour grain, with subsequent improvement by selection and hybridization.
Sample sizes proposed
With method 1, n= 396 when bi= 0.05; yes bi= 0.075 or 0.1, n= 175 or 100. With method 2, when bi= 0.05, n varies from 45 (FF) to 7588 (DR), but with bi= 0.075 or 0.1 should be evaluated between 20 and 3 372 or between 11 and 1897 plants or corn (Table 3). The previous results allow us to verify that method 1 is simpler. With it, the same number of plants and corn is sampled in each variable at the same value of bi, nor are population means and variances required, among other simple statistics (Rendón and Cervantes, 1991; Cochran, 1998; Pérez, 2005).
Table 3 Sample sizes proposed to characterize Cacahuacintle corn for the production of corn on farmland in the municipality of Calimaya, State of Mexico, based on two methodologies. 2016 data.
| Variable | n | Min | Max | Mean | S2 | DE | EE | CV | As | Ku |
| FF | 1 460 | 85 | 125 | 103.47 | 78.92 | 8.89 | 0.23 | 8.59 | 0.24 | -0.77 |
| AM | 1 460 | 1 | 2.9 | 1.61 | 0.06 | 0.25 | 0.01 | 15.4 | 0.93 | 2.91 |
| AP | 1 460 | 1.26 | 3.9 | 2.67 | 0.12 | 0.35 | 0.01 | 12.97 | -0.28 | 1 |
| DT | 1 460 | 2.5 | 4.6 | 3.07 | 0.21 | 0.46 | 0.01 | 13.84 | 0.74 | 0.12 |
| NH | 1 460 | 6 | 26 | 12.08 | 3.52 | 1.88 | 0.05 | 15.54 | 0.27 | 3.13 |
| DCH | 1 460 | 4.6 | 9.7 | 7.16 | 0.50 | 0.71 | 0.02 | 9.88 | -0.16 | 0.17 |
| DM | 1 460 | 3.6 | 7.7 | 5.89 | 0.33 | 0.57 | 0.02 | 9.76 | -0.24 | 0.22 |
| NG | 1 460 | 11 | 40 | 24.75 | 17.6 | 4.2 | 0.11 | 16.95 | -0.28 | 0.52 |
| NHT | 1 460 | 0 | 7 | 2.92 | 0.78 | 0.88 | 0.02 | 30.19 | 0.69 | 1.27 |
| DR | 1 460 | 1.5 | 2.1 | 1.85 | 0.04 | 0.12 | 0.31 | 6.41 | -0.28 | -0.39 |
| LR | 1 460 | 3 | 30 | 13.09 | 16.59 | 4.07 | 0.11 | 31.13 | 0.45 | 0.38 |
| LE | 1 460 | 7.1 | 30 | 20.38 | 6.7 | 2.59 | 0.07 | 12.71 | -0.14 | 1.31 |
| PE | 1 460 | 100 | 999 | 530.44 | 18498 | 136.06 | 3.56 | 25.65 | 0.29 | 0.23 |
| PR | 1 460 | 5 | 90 | 27.2 | 188.94 | 13.75 | 0.36 | 50.55 | 0.72 | 0.61 |
However, for the characteristics that present little variability, it could lead to choosing very large sample sizes, such as in FF, AM, AP, NH, DCH, DM, and NG, since with the methodology 2 a value of n smaller is proposed to 60. If there are budgetary, time or qualified personnel restrictions, the values of n provided by both methodologies could be combined. Consideration should also be given to the fact that in that municipality the environmental conditions, genetic variability, technological packages and the different agronomic management that farmers apply will lead to variability, regardless of the method and technique of sampling (González et al., 2006; González et al., 2008; Arellano et al., 2010).
The variables were defined in Table 1. E1, E2, E3, are the maximum permissible errors (%) for method 1; F1, F2, F3, are the products between the arithmetic mean with the values of bi, at 0.05, 0.075 and 0.1 respectively and correspond to method 2.
The calculation of sample sizes with other methodologies, based on the preliminary values presented in this study, could provide better unbiased estimates of population parameters, particularly if a stratification of the communities in the upper part is performed and considering the different technological packages that producers use. The use of genetic and experimental designs, for better control of environmental heterogeneity and to divide genetic variability, would also be very useful.
Conclusions
There was significant phenotypic differentiation in all the variables evaluated. To sample plots in Cacahuacintle it is desirable to stratify the municipality of Calimaya to reduce the heterogeneity between their locations. With method 1, for bi= 0.05, 0.075 or 0.1, n= 396 in all variables.
With method 2 should be evaluated from 11 to 7588 plants or corn, depending on the products between the arithmetic mean with the values of bi, at 0.05, 0.075 and 0.1 respectively and the sampled variable. The use of genetic and experimental designs would help to make the sampling techniques used more efficient because they exercise greater control of environmental heterogeneity.
At least four of the five cooperating farmers were grouped in the four quadrants of the biplot. There was a positive and significant correlation between number of quality leaves for wrapping tamales (NHT) with number of grains and rows of grain in the corn, there was also between the first and length and diameter of the spine. It is suggested to use NHT as an indirect selection criterion to increase the size of the corn.
Literatura citada
Aguilar, C. J. A.; Carballo, C. A.; Castillo, G. F.; Santacruz, V. A.; Mejía, C. J. A.; Crossa, H. J. y Baca, C. G. 2006. Diversidad fenotípica y variantes distintivas de la raza Jala de maíz. Agric. Téc. Méx. 32(2):57-66. [ Links ]
Aguilar, M. L. B.; Calvo, Ch. G.; Nájera, M. F. I.; Serrato, C. R.; Landeros, F. V.; Pérez, L. D. J.; Esquivel, A. C. y González, H. A. 1999. Agrodiversidad en la raza de maíz Cacahuacintle en Calimaya, México. In: Seminario Internacional sobre Agrodiversidad Campesina. C. Arriaga J. (Ed.). Centro de Investigación en Ciencias Agropecuarias. Universidad Autónoma del Estado de México. Toluca, México. 12-14 de mayo de 1999. 84-89 pp. [ Links ]
Andrade, F. H.; Cirilo, A. G. and Echarte, L. 2000. Factors affecting kernel number in maize. Chapter 5:59-74 pp. In: physiological bases for maize inprovement. (Eds.). Otegui, Ma. E. A. and Slafer, G. Food Products Press. The Haworth Press, Inc. 217 p. [ Links ]
Arellano, V. J. L.; Gámez, V. A. J. y Ávila, P. M. A. 2010. Potencial agronómico de variedades criollas de maíz Cacahuacintle en el valle de Toluca. Rev. Fitotec. Mex. 33(4):37-41. [ Links ]
Balzarini, M. G.; González, L.; Tablada, M.; Casanoves, R.; Di Rienzo, J. A. y Robledo, C. W. 2008. Manual del usuario. Grupo InfoStat. Editorial Brujas. Córdoba, Argentina. 60-62 pp. [ Links ]
CIMMYT. 1999. Manejo de los ensayos e informe de los datos para el programa de ensayos internacionales de maíz del Centro Internacional del Maíz y Trigo (CIMMYT). 5ª Reimp. México, DF. 21 p. [ Links ]
Cochran, W. G. 1998. Técnicas de muestreo. Compañía Editorial Continental, SA de CV. 13a Reimpresión. México, DF. 513 p. [ Links ]
Coutiño, E. B.; Vidal, M. V. A.; Cruz, G. B. y Cruz, V. C. 2010. Aptitud combinatoria general y específica del contenido de azúcares en maíces criollos eloteros. Rev. Fitotec. Mex. 33(4):57-61. [ Links ]
Coutiño-Estrada, B.; Vidal-Martínez, V. A. y Sánchez-Grajales, G. 2010. Selección de maíces criollos con calidad elotera bajo condiciones de riego y temporal en Chiapas. 178-190 pp. [ Links ]
Di Rienzo, J. A.; Casanoves, F.; Balzarini, M. G.; González, L.; Tablada, M. y Robledo, C. W. 2008. InfoStat, versión 2008. Grupo InfoStat, FCA. Universidad Nacional de Córdoba, Argentina. [ Links ]
Franco, M. J. R. P.; González, H. A.; Pérez, L. D. J. y González, R. M. 2015 Caracterización fenotípica de híbridos y variedades de maíz forrajeros en Valles Altos del Estado de México. Rev. Mex. Cienc. Agríc. 6(8):1915-1927. [ Links ]
Gomez, K. A. and Gomez, A. A. 1984. Statistical procedures for agricultural research. 2nd (Ed.). John Wiley and Sons, Inc. Printed in Singapore. 680 p. [ Links ]
González, A.; Pérez, D. J.; Sahagún, J.; Franco, O.; Morales, E. J.; Rubí, M.; Gutiérrez, F. y Balbuena, A. 2010. Aplicación y comparación de métodos univariados para evaluar la estabilidad en maíces del Valle Toluca-Atlacomulco, México. Agron. Costarric. 34(2):129-143. [ Links ]
González, H. A.; Aguilar, L. B.; Nájera, F. I.; Calvo, G.; Sahagún, J.; Pérez, D. J.; Landeros, V. y Serrato, R. 1999. Problemática ambiental y análisis económico de la agricultura del municipio de Calimaya de Díaz González, México. In: Memoria del Primer Seminario Internacional Tecnología-Industria-Territorio. UAQ-IPN (Coord.). Querétaro, México. 34-44 pp. [ Links ]
González, H. A.; Pérez, L. D. J.; Domínguez, L. A.; Franco, M. O.; Balbuena, M. A.; Ramos, M. A. y Sahagún, C. J. 2008b. Variabilidad genética, diversidad fenotípica e identificación de poblaciones sobresalientes de maíz Cacahuacintle. Ciencia Ergo. 15(3):297-305. [ Links ]
González, H. A.; Pérez, L. D. J.; Franco, M. O.; Nava, B. E. G.; Gutiérrez, R. F.; Rubí, A. M. y Castañeda, V. A. 2011. Análisis multivariado aplicado al estudio de las interrelaciones entre cultivares de maíz y variables agronómicas. Rev. Cienc. Agríc. Informa. 20(2):58-65. [ Links ]
González, H. A.; Pérez, L. D. J.; Landeros, F. V.; Serrato, C. R.; Sahagún, C. J.; Nájera, M. F. I.; Aguilar, M. y Calvo, Ch. 1999. Agromisión. 1-14 pp. [ Links ]
González, H. A.; Sahagún, C. J.; Pérez, L. D. J.; Domínguez, L. A.; Landeros, F. V. y Serrato, C. R. 2006. Diversidad fenotípica del maíz Cacahuacintle en el Valle de Toluca, México. Rev. Fitotec. Mex. 29(3):255-261. [ Links ]
González, H. A.; Vázquez, G. L. M.; Sahagún, C. J. y Rodríguez, P. J. E. 2008. Diversidad fenotípica de variedades e híbridos de maíz en el Valle Toluca-Atlacomulco, México. Rev. Fitotec. Mex. 31(1):67-76. [ Links ]
González, H. A.; Vázquez, G. L. M.; Sahagún, C. J.; Rodríguez, P. J. E. y Pérez, L. D. J. 2007. Rendimiento del maíz de temporal y su relación con la producción de mazorca. Agric. Téc. Méx. 33(1):67-76. [ Links ]
Pérez, L. C. 2005. Muestreo estadístico. Conceptos y problemas resueltos. Editorial Pearson-Prentice-Hall, 1a Edición. Madrid, España. 392 p. [ Links ]
Ramos, R. A. y Gerón, X. F. 1998. origen y distribución geográfica, diversidad y potencial productivo de la raza de maíz Cacahuacintle. In: Memoria del Seminario Mesoamericano sobre Agrodiversidad en la Agricultura Campesina. UAEM. Toluca, Estado de México. 89-94 pp. [ Links ]
Rendón, S. G. y Cervantes, S. A. 1991. La forma más fácil para calcular tamaños de muestra (varianza fija). Monografías y manuales en estadística y cómputo. Centro de Estadística y Cálculo. Colegio de Postgraduados-Institución de Enseñanza e Investigación en Ciencias Agrícolas. Chapingo, Estado de México. 10(4):84-85. [ Links ]
Reynoso, Q. C. A.; González, H. A.; Pérez, L. D. J.; Franco, M. O.; Torres, F. J. L.; Velázquez, C. G. A.; Breton, L. C.; Balbuena, M. A. y Mercado, V. O. 2014. Análisis de 17 híbridos de maíz sembrados en 17 ambientes de los Valles Altos del centro de México. Rev. Mex. Cienc. Agríc. 5(5):871-882. [ Links ]
Romero, P. J. F.; Castillo, G. A.; Carapia, R. V. E.; Andrade, R. M.; Ortega, P. R.; Gómez, M. N. O.; Perdomo, R. F. y Suárez, R. R. 2018. Variación morfológica en colectas de maíz ancho nativo del estado de Morelos, México. Rev. Pensamiento Actual. 18(31):35-45. [ Links ]
Sánchez, G. J. J. 1995. El análisis biplot en clasificación. Rev. Fitotec. Mex. 18(3):188-203. [ Links ]
Valdivia, B. R.; Caro, V. F. de J.; Medina, T. R.; Ortiz, C. M.; Espinoza, C. A.; Vidal, M. V. A. y Ortega, C. A. 2010. Contribución genética del criollo Jala en variedades eloteras de maíz. Rev. Fitotec. Mex. 33(4):63-67. [ Links ]
Wellhausen, E. J.; Roberts, L. M.; Hernández, X. E. y Mangelsdorf. P. C. 1951. Razas de maíz en México, su origen, características y distribución. Oficina de Estudios Especiales. Secretaría de Agricultura y Ganadería (SAGAR). Folleto técnico núm. 5. México, DF. 237 p. [ Links ]
Received: August 01, 2019; Accepted: October 01, 2019
 Este es un artículo publicado en acceso abierto bajo una licencia
Creative Commons
Este es un artículo publicado en acceso abierto bajo una licencia
Creative Commons
