


Servicios Personalizados
Revista
Articulo
 texto en
  Inglés (pdf)
 Artículo en XML
 Referencias del artículo
 Enviar artículo por email
Indicadores
-
 Citado por SciELO
 -
 Accesos
Links relacionados
-
 Similares en
SciELO
Similares en
SciELO
Compartir

 Permalink
Revista mexicana de ciencias agrícolas
versión impresa ISSN 2007-0934
Rev. Mex. Cienc. Agríc vol.10 no.8 Texcoco nov./dic. 2019 Epub 05-Feb-2021
https://doi.org/10.29312/remexca.v10i8.2151
Articles
Optimization model for the distribution of guava from Mexico to the United States of America
1Colegio de Postgraduados-Postgrado en Economía. Carretera México-Texcoco km 36.5, Montecillo, Texcoco, Estado de México. CP. 56230. Tel. 595 9520200, ext. 1839 y 1835. (quintero.juan@colpos.mx; miguelom@colpos.mx).
2Campo Experimental Valle de México-INIFAP. Carretera Los Reyes-Texcoco km 13.5, Cuatlinchán, Estado de México. CP. 56250. AP. 307 y 10. Tel. 800 0882222, ext. 85353. (sangerman.dora@inifap.gob.mx).
In Mexico, the production of guava (Psidium guajava L.) is very representative, since year after year, it is among the first 10 fruits harvested with higher yields. From 2008, fresh guava began to be sent to the United States of America, aimed at the nostalgia market, complying with the tariff and phytosanitary requirements for the crossing to this country, as one of these requirements is that the cargo is irradiated, which is the elimination of bacteria and pathogens harmful to health. The present work, shows the methodology and procedures before an open market essential for the competitive strategy and the generation of income that improves the planning of the distribution of fresh guava in all the federal entities of Mexico both producing and consuming United States of America; through the formulation in linear programming of a distribution optimization model for this fruit, which minimizes transport costs where it identifies potential consumption centers and recommends that quantities should be supplied to said market, to maintain the balance between the supply and demand of fresh guava, in order to make the products and services available to customers at the time and place, in the desired conditions and forms, in the most cost-effective manner refer.
Keywords: export logistics; open market; optimization; transport model
En México, la producción de guayaba (Psidium guajava L.) es muy representativa, pues año con año, se encuentra entre los primeros 10 frutos cosechados con mayores rendimientos. A partir de 2008 se empezó a enviar guayaba en fresco a Estados Unidos de América, dirigido al mercado de la nostalgia, cumpliendo con los requisitos arancelarios y fitosanitarios para el cruce a este país, pues uno de estos requisitos es que el cargamento esté irradiado, que es la eliminación de bacterias y patógenos nocivos a la salud. El presente trabajo, muestra la metodología y procedimientos ante un mercado abierto esencial para la estrategia competitiva y la generación de ingresos que mejora la planeación de la distribución de guayaba en fresco en todas las entidades federativas de México tanto productoras y consumidoras de Estados Unidos de América; a través, de la formulación en programación lineal de un modelo de optimización de distribución para este fruto, el cual minimiza los costos de transporte donde identifica los potenciales centros de consumo y recomienda que cantidades deben de abastecer a dicho mercado, para mantener el equilibrio entre la oferta y la demanda de la guayaba en fresco, a fin de hacer que los productos y servicios estén disponibles para los clientes en el momento y lugar, en las condiciones y formas deseadas, de la manera más efectiva en cuanto a costos y tiempos se refiere.
Palabras claves: logística de exportación; mercado abierto; modelo de transporte; optimización
Introduction
Guava is characterized by being one of the most complete fruits in nutrients; it contains vitamins, proteins, mineral salts and trace elements. The contents of vitamins A, B1 and B2, are high and produces more than twice vitamin C than orange; the fruit has 16 vitamins. The levels of essential amino acids such as tryptophan, lysine, and methionine, are very high and is rich in tannins (attacks microbes), in addition to having intestinal astringent properties.
The States of the Mexican Republic that produce the greatest amount of guava (CLM, 2013) are, in order of importance: Michoacán, Aguascalientes, Zacatecas, State of Mexico, Jalisco and Guerrero, with more than 200 ha harvested by each state and more than 1 000 t produced. It should be noted that the state of Querétaro, although it has less than 100 ha to produce guava, is also significant for its more than 250 t produced with better product quality.
These seven states are mostly profitable in their production of fresh guava, which allows them to supply the national and international markets, because there is enough farmland and techniques to substantially increase productivity given its characteristic of precocity and its high nutritional content (SAGARPA-Plan Rector del Sistema Producto Guayaba, 2008a).
The yield obtained in the state of Zacatecas is 15.65 and Aguascalientes with 15.41 t ha-1, being superior to that of all other states, despite having fewer natural resources, such as water; Michoacán and the State of Mexico follow with yields of 14.72 and 11.35 t ha-1 respectively; however, the average national performance for that year was 14.45 t ha-1.
The destination markets with the highest demand after Mexico City are Guadalajara, Monterrey, Puebla and Torreon, markets that are an important part of the distribution to the northwest, east and west of the national territory. They are required to supply more than 45% of the entire supply of the existing guava (SAGARPA, 2008b).
The relative advantages of each of the main producers with respect to the possible destination markets would be determined by the geographical proximity, existence and density of the ethnic population in the recipient country, tariff preferences and pre-established distribution channels in the tropical fruit segment (PEEGM, 2008).
As of the end of 2008, the market of the United States of America was opened for the sale of fresh guava, the producing states began to export guava to the Hispanic markets in that nation, such as California, Texas, Illinois, among others. In that year, the export was only 839 t. By 2012, the export made increased to 3 928 t of the 226 884 t available for sale.
Materials and methods
The model used optimizes transportation for supply in an open market and was developed with linear programming, where national production and consumption is considered by eliminating the amount sent for industry and waste. For the formulation of the model, it is necessary to know the decision variables such as the objective function and the supply and demand restrictions. To define the objective function, all transport costs from each of the origins to each of the destinations must be known. In the supply restrictions, the origins and quantities available and in demand, the destinations and the quantities demanded (Wood et al., 1999).
For the transport model, the sources of information were obtained from statistics and databases consulted in the Agrifood and Fisheries Information Service of the Ministry of Agriculture, Livestock, Fisheries and Food (SAGARPA-SIAP, 2010a) from which the production of guava by state and cycle, as well as the area planted, the National Population Council (CONAPO, 2010a) and the population and housing census of the National Institute of Statistics and Geography (INEGI) and the United States CENSUS of the Latino population in the different American states.
For the solution to the open market model, once the origins, the quantity they offer, the destinations of the guava in demand (inside and outside) and the transport costs per ton were identified, their model was formulated. When developing the objective function, the transport costs Cij of the origins (m) to each of the destinations (n) are considered, multiplied by the quantity (X) that should be sent to each of them and represented by Xmn. The objective function of the model is as follows.
Where:
j= index of destination state (demandant), where j = 1, 2, ..., n; Xij= decision variable that is determined with the solution of the model, is the resulting amount of guava assigned from origin i to destination j; Cij= Coefficient of the variable Xij, represents the amount with which each unit of the variable Xij contributes, to the total value desired in the objective. In the model it represents the cost of transportation from origin i to destination j.
Each model has as many supply restrictions as the number of origins i exist and as many demand restrictions as the number of destinations j that exist. Abstractly the open market model, mathematically in the following.
Subject to:
A surplus model A deficit model
In the open market transport model, only national production and internal and external consumption were considered. The aim was to distribute the fruit of those entities with surplus production optimally to the deficient markets that require this fruit.
In the solution of the model, the value of the objective function will be obtained and what will be the optimal quantities that must be sent from each origin to each of the destinations, allowing a balance between supply and demand, since it is based on the assumption that all fresh production available is all that will be consumed fresh.
The markets where most of the Latinos are concentrated, who know and demand the guava in the cities of the United States of America where the fresh guava is distributed are McAllen, Houston, Dallas, San Antonio, Atlanta, Orlando, Philadelphia, New York, Chicago, Los Angeles and San Francisco (Wilson, 2000).
Results and discussion
The transit that mexican guava has to make to reach its last consumer in the United States of America is complex, since many processes have to be carried out and each one has its own complexity and for each one there must be specifications of quality and fully established and disseminated processes so that the guava that arrives, is present in the ideal physicochemical quality conditions, as well as with a pleasant appearance and an adequate consistency so that your shelf life is as long as possible (PRSPG, 2013).
The stages of the supply chain for export that has fresh guava, from the collection in the garden to the point of sale to the final consumer, are shown in Figure 1.
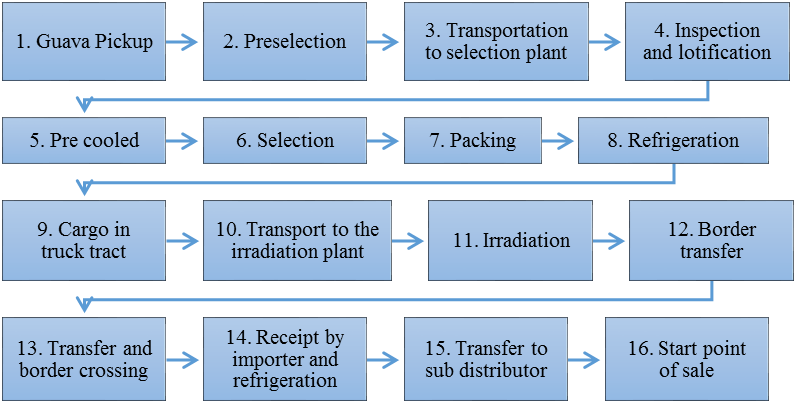
In order for guava to become available for purchase by end consumers in the United States, it is required to complete 15 stages perfectly. This process becomes complex because by provision of the Food and Drugs Administration (FDA) administration of food and drugs, the guava must carry out the Irradiation process (stage 11), since it is only with this type of treatment that customs clearance is accepted and integrated into the American markets for distribution and sale (among other requirements) (Coyle, 2003).
When obtaining the information of state production of fresh guava for commercialization and the Population by federative entity, the surplus and deficit states are obtained according to state consumption and per capita consumption (181 061 kg) (Bowerson et al., 2002).
For the American states, only Florida is the one who produces guava because of its favorable climate to produce this fruit, but it does not satisfy its production, because even with that production, it demands more product. As for the others, zero production is taken with demand from Latinamerican.
Once the calculations have been made, Table 1 shows the balance of fresh guava consumption, where the states of Aguascalientes, Michoacán and Zacatecas (the main producers of the fruit in Mexico) offer more than 205 000 t and will be consumed by the 29 Mexican states and the seven demanding American states (PRSPG, 2013).
Table 1 Offering states and guava constituents in Mexico, 2013.
| Origin state | Offer (t) | Destination state | Demand (t) | ||
| Aguascalientes | 70 191.83 | Baja California | 6 117.82 | ||
| Michoacán de Ocampo | 105 558.23 | Baja California Sur | 1 267.12 | ||
| Zacatecas | 29 984.45 | Campeche | 1 593.88 | ||
| Total Offer | 205 734.51 | Coahuila de Zaragoza | 9 268.85 | ||
| Colima | 6 184.26 | ||||
| Chiapas | 4 814.66 | ||||
| Chihuahua | 1 264.34 | ||||
| Distrito Federal | 16 103.1 | ||||
| Durango | 2 650.78 | ||||
| Guanajuato | 9 774.96 | ||||
| Guerrero | 4 311.78 | ||||
| Hidalgo | 4 709.18 | ||||
| Jalisco | 12 017.42 | ||||
| México | 28 53.5 | ||||
| Morelos | 3 234.95 | ||||
| Nayarit | 1 345.91 | ||||
| Nuevo León | 8 946.33 | ||||
| Oaxaca | 7 114.18 | ||||
| Puebla | 10 698.4 | ||||
| Querétaro | 3 178.9 | ||||
| Quintana Roo | 2,688.68 | ||||
| San Luis Potosí | 4 892.53 | ||||
| Sinaloa | 5 225.28 | ||||
| Sonora | 5 162.89 | ||||
| Tabasco | 3 412.86 | ||||
| Tamaulipas | 6 267.13 | ||||
| Tlaxcala | 2 250.11 | ||||
| Veracruz | 14 062.52 | ||||
| Yucatán | 3 714.93 | ||||
| Texas | 4 524.68 | ||||
| Georgia | 473.43 | ||||
| Florida | 450.93 | ||||
| Mississippi | 36.49 | ||||
| New York | 443.67 | ||||
| Illinois | 1 264.53 | ||||
| California | 7 713.77 | ||||
| Total demand | 205 734.75 |
Elaboration with data from: SAGARPA-SIAP (2007, 2008a, 2008b); CONAPO (2009); CSCMP (2007)
Once the bidding and demanding states are obtained, the transportation costs of each of the origins to each of the destinations are sought. Each of these values is represented in the objective function by Cij costs. In the calculation of transport costs, a refrigerated box trailer with a capacity of 20 t is considered, with approximate measures of 14.4 x 2.82 x 2.52 m. The total cost per trailer is divided by 20 t of which is the average tons transported by each truck to obtain its transport cost per ton (PRSPG, 2013).
Studies carried out such as those of Alonso and Alarcón (1999), have indicated that, for the states of Zacatecas, Michoacán and the State of Mexico, who produce guava with export quality, do not make any transportation to the American nation, because only the shipment is sent to the state of Aguascalientes where the collector is certified export and from there go to the irradiation process in Tepeji del Rio, Hidalgo, as regulated by the FDA.
To pose a problem of linear programming, it is necessary to identify the following elements: the problem decision variable, the objective function, the linear constraints and the non-negativity constraints, both in demand and supply. A destination can receive its demanded amount from one or more origins (Ballou, 2004).
In the case of the open market model, it is assumed that there are m origins and n destinations. Let ai be the number of units available to be offered at each origin i= (i= 1, i= 2, … , i= m) and let bj be the number of units required at the destination j= (j= 1, j= 2, … , j= n). Let cij be the cost of transport per unit on the route (i, j) that joins the origin i and the destination j. The objective is to determine the number of units transported from origin i to destination j in such a way that the total transport costs are minimized.
For the development of the open model, the origin states and the demanding states are considered, including the seven American markets through which the surplus of production of the country will come out. In this model the objective function will contain 108 terms, which represent the costs of each of the three origins to the 36 national and American markets along with the supply restrictions that are also extended in each of them equal to the surplus, but for the In the state of Zacatecas, they are equal to zero because they do not have the cost of transport to export but it serves as a shadow destination to balance the function and thus obtain their production as refers Taff (1978).
With the complete and solved matrix in the Linda® 6.1 linear programming computing package, the results of the model are obtained where it is indicated that all the surplus of Aguascalientes goes out to the different American markets and that only he is the one who can export due to its low costs The seven American markets require 14 907.5 t of which, Aguascalientes will be responsible for distributing the fruit with its own production and the other states of Michoacán, Zacatecas and State of Mexico, which have certified orchards for export. With this, the objective function that results in a value of 0.1247296E+09 is maximized, which indicates that the cost to transport the entire guava production optimally is $124 729 600.00 pesos (Rodríguez, 2009).
In the optimal distribution modeled for 2013, Aguascalientes distributes to 10 national states and seven American states, Michoacán offers to 14 national states the guava and for Zacatecas only to seven national states, which can share their offer to one or more states (Table 2).
Table 2 Optimal distribution of origins to open market destinations.
| Destination-origin | Aguascalientes | Michoacán | Zacatecas |
| BCN | 6 117.82 | ||
| BCS | 1 267.12 | ||
| Campeche | 1 593.88 | ||
| Coahuila | 8 651.95 | 616.9 | |
| Colima | 6 184.26 | ||
| Chiapas | 4 814.66 | ||
| Chihuahua | 1 264.34 | ||
| Ciudad de México | 16 103.1 | ||
| Durango | 2 650.78 | ||
| Guanajuato | 9 774.96 | ||
| Guerrero | 4 311.78 | ||
| Hidalgo | 4 709.18 | ||
| Jalisco | 12 017.42 | ||
| México | 28 553.5 | ||
| Morelos | 3 234.95 | ||
| Nayarit | 1 345.91 | ||
| Nuevo León | 8 946.33 | ||
| Oaxaca | 7 114.18 | ||
| Puebla | 10 698.4 | ||
| Querétaro | 3 178.9 | ||
| Quintana Roo | 2 688.68 | ||
| San Luis Potosí | 4 892.53 | ||
| Sinaloa | 5 225.28 | ||
| Sonora | 5 162.89 | ||
| Tabasco | 3 412.86 | ||
| Tamaulipas | 6 267.13 | ||
| Tlaxcala | 2 250.11 | ||
| Veracruz | 1 695.02 | 12 367.5 | |
| Yucatán | 3 714.93 | ||
| Texas | 4 524.68 | ||
| Georgia | 473.43 | ||
| Florida | 450.93 | ||
| Mississippi | 36.49 | ||
| New York | 443.67 | ||
| Illinois | 1 264.53 | ||
| California | 7 713.77 | ||
| Total | 70 179.92 | 105 567.71 | 29 987.12 |
Elaboration with model results
The percentages of the total distribution of guava nationwide and in the United States of America, is given by: Aguascalientes of its total supply, distributes to the American states 21.24%, with California being 10.99%, Texas 6.45%, Illinois 1.8% , Georgia 0.67%, Florida with 0.64%, New York 0.63% and Mississippi only 0.05% of its production (DCUSA, 2005). For the Mexican states, Jalisco offers 17.12%, Guanajuato 13.93% and 12.33% for Coahuila as the largest demandant (PRSPG, 2013).
Michoacán distributes mostly to the State of Mexico with 27.05%, to the Distrito Federal 15.25% and Veracruz 11.72% and to a lesser extent to Quintana Roo with 2.55%, Tlaxcala 2.13% and Campeche with 1.51% of its total production.
The total production of Zacatecas, 29.83% is for Nuevo Leon, 20.40% for Baja California Norte, 17.43% is for Sinaloa, 17.22% for Sonora, 8.84% Durango, Baja California Sur with 4.23% and Coahuila 2.06% (PRSPG, 2013).
The following illustrations show the distribution made nationally (Figure 1) and internationally to the United States of America (Figure 2), according to the results of the open market model. Authors like Lerma (2002) have mentioned it in studies, a nationwide the distribution of the state of Michoacán is entrusted to the central, southern and southern regions of Mexico; while for Zacatecas it is done only for northern states, and for Aguascalientes it is done in the central region, to three northern states and mainly for distribution to the US states (Frances, 2005).
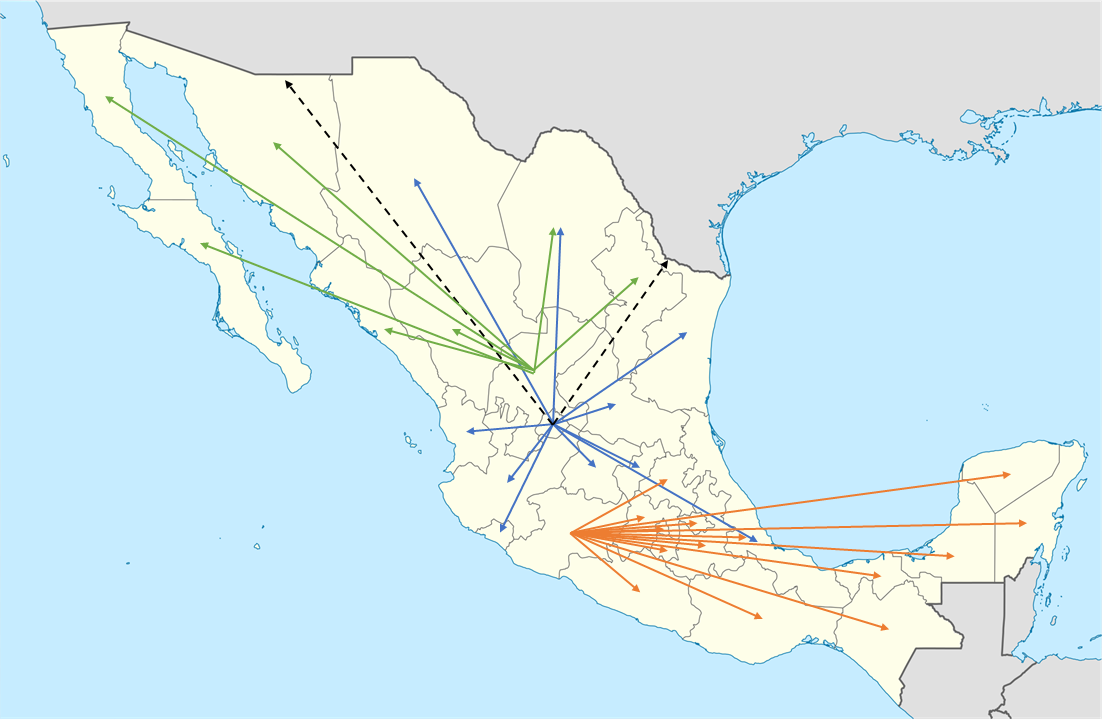
Figure 1 National distribution network of fresh guava supplying states. Elaboration with data obtained from the result of the model.

Figure 2 Distribution network of fresh guava to North American States. Elaboration with data obtained from the result of the model.
Where your entry to this country, given the optimization of the logistics routes applied, is through Nogales, Sonora customs to the market of the American state of California (Figure 3) and through Laredo Tamaulipas customs for the American states of Texas, Georgia, Florida, Mississippi, New York and Illinois (Figure 4), in its different cities and centers of consumption where there is a market for nostalgia demanding fresh guava fruit (Wlongberg, 2002; DCUSA, 2005).
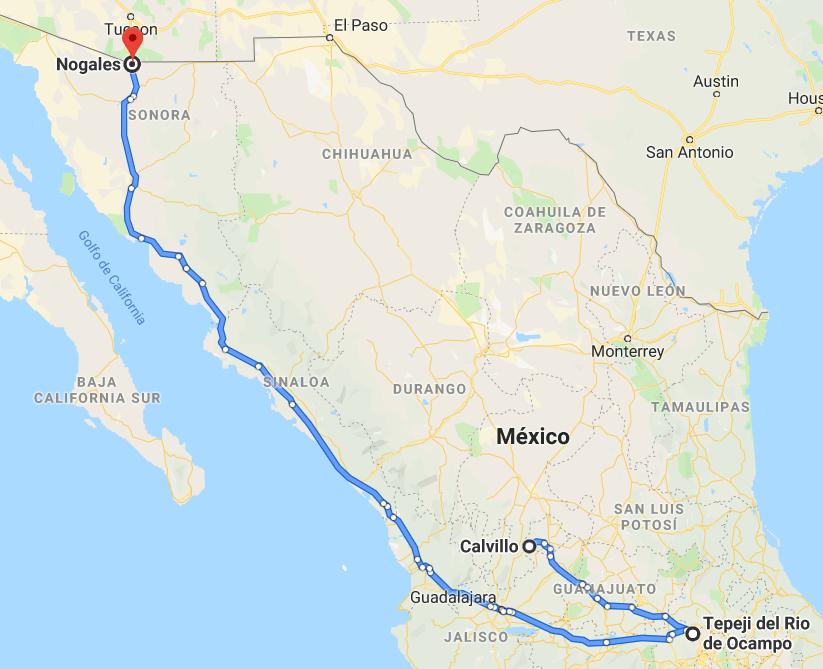
Figure 3 Logistic distribution route with border in Nogales, Sonora. Elaboration with data obtained from transport costs (SCT, 2013).
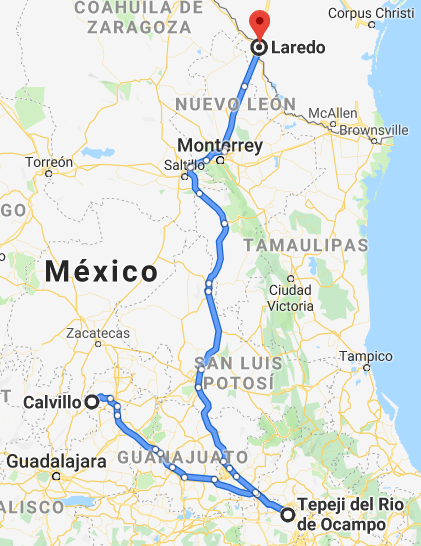
Figure 4 Logistic distribution route with border in Laredo, Tamaulipas. Elaboration with data obtained from transport costs (SCT, 2013).
Conclusions
Logistic modeling is given by the assignment of objective mathematical functions, which allows to minimize costs and maximize distribution according to the demand requested by deficit states.
The open market model refers to the equitable distribution at national and international level, since there is surplus product once it has been programmed or supplied to all national states, because there is surplus production of guava in the states of Aguascalientes, Michoacán and Zacatecas and that with these surplus amounts it has been programmed or supplied to all the deficient and demanding states (national and American), thus having the maximization of the distribution with the minimization of transport costs. The export takes place at the borders of Nogales Sonora and Nuevo Laredo in Tamaulipas, optimizing their transport routes.
A maximization of the objective function of more than 124 million Mexican pesos in the distribution cost of fresh guava is obtained, both nationally and to those demanding American states. It should be noted that transportation costs are made only to the borders with the United States of America and upon arrival there, the cargo is delivered with another distribution company responsible for delivering the product to the American markets, because given the international trade regulations, you cannot pass with the tract or the driver who drives it.
The results after the linear programming, we obtain that Aguascalientes will be the only one in charge of distributing more than 70 000 t of guava that includes the seven American states and 10 Mexican states; Michoacán, will send more than 105 000 t to 14 states in Mexico and Zacatecas will only supply seven states of Mexico, its almost 30 000 t in excess.
The routes corresponding to the export to the states of the American Union, will be made by the borders of Nogales, Sonora and Laredo, Tamaulipas, because given the distribution logistics to be carried out, these borders optimize road transport costs, which only deliver the cargo and that another subsidiary company to the transport agent take the product to the required markets.
Literatura citada
Alonso, S. A. y Alarcón, L. S. 1999. La logística en la empresa agroalimentaria: transporte, gestión de stocks y control de calidad. Ediciones Mundi-Prensa. Madrid. 210 p. [ Links ]
Ballou, R. H. 2004. Logística. Administración de la cadena de suministro. Quinta Edición. Pearson Educación. México, DF. 816 p. [ Links ]
Bloomberg, D. J.: Stephen, L. y Joe, B. H. 2002. Logística. Prentice Hall. New Jersey. 254 p. [ Links ]
Bowerson, D. J.; Closs, J. D. y Bixby, C. M. 2002. Gestión logística de la cadena de suministro. McGraw Hill. New York. 658 p. [ Links ]
CLM. 2010. Consejo de la dirección logística. Council of logistic management. 254 p. [ Links ]
Coyle, J. J.; Novak, R. A.; Gibson, B. y Bardi, E. J. 2003. Transporte: una perspectiva de la cadena de suministro. Séptima edición. South-Western Cengage Learning. Estados Unidos de América. 521 p. [ Links ]
CONAPO, 2013. Consejo Nacional de Población. http://wwwconapo. [ Links ]
CSCMP. 2007. Consejo de profesionales de la cadena de suministro. Council of supply chain management professionals. 431 pp. [ Links ]
Frances, R. A. 2005. Logística de transporte. Universidad Politécnica de Catalunya. Barcelona. 207 p. [ Links ]
Lerma, K. A. E. 2000. Comercio internacional, metodología para la formulación de estudios de competitividad empresarial. Guía práctica. Editorial ECAFSA. México, DF. 436 p. [ Links ]
Departamento de Comercio de los Estados Unidos (DCUSA). 2005. Oficina del Censo. Datos estadísticos. Washington DC. Estados Unidos. http://www.census.gov. [ Links ]
PEEGM. 2008. Productores y empacadores exportadores de guayaba de México, AC. Diagnóstico de las necesidades de infraestructura estratégica para impulsar el mercado de exportación de guayaba. [ Links ]
Rodríguez, D. 2009. Logística para la exportación de productos agrícolas, frescos y procesados. Cuaderno de exportación. San José Costa Rica. 58 p. [ Links ]
SAGARPA. 2007. Secretaría de Agricultura, Ganadería, Desarrollo Rural, Pesca y Alimentación. Plan Rector del Sistema Producto Guayaba. Comité de Sistema Producto Guayaba. [ Links ]
SAGARPA. 2008a. Secretaría de Agricultura, Ganadería, Desarrollo Social, Pesca y Alimentación. Sistema producto guayaba. http://www.campomexicano.gob.mx/portal-sispro/index. México, DF. [ Links ]
SAGARPA. 2008b. Secretaría de Agricultura, Ganadería, Desarrollo Social, Pesca y Alimentación Plan Rector del Sistema Producto Guayaba. México, DF. [ Links ]
SAGARPA. 2010a. Secretaría de Agricultura, Ganadería, Desarrollo Social, Pesca y Alimentación Plan Rector del Sistema Producto Guayaba. México, DF. http://www.sagarpa.gob.mx. [ Links ]
SAGARPA. 2010b. Secretaría de Agricultura, Ganadería, Desarrollo Social, Pesca y Alimentación Sistema de Información Agroalimentaria y Pesca (SIAP). http://www.siap.gob.mx. [ Links ]
SCT. 2013. Secretaría de Comunicaciones y Trasportes. Vías de trasporte de productos perecederos. http://wwwsct. [ Links ]
Chopra, S. and Meindl, P. 2007. Administración de la cadena de suministro: estrategia, planeación y operación. 3a. (Ed.). Prentice Hall. New Jersey. 278 p. [ Links ]
Taff, Ch. A. 1978. Management of physical distribution and transportation. 6th (Ed.). Homewood. 357 p. [ Links ]
Wilson, R. A. 2000. Transporte en América 2000. Décima octava edición. Washington. 51 p. [ Links ]
Wood, D. F.; Wardlow, D. L.; Murphy, P. R. y Jonhnson, J. C. 1999. Logística contemporánea. 7a. (Ed.). Prentice Hall. New Jersey. 585 p. [ Links ]
Received: September 01, 2019; Accepted: November 01, 2019
 Este es un artículo publicado en acceso abierto bajo una licencia
Creative Commons
Este es un artículo publicado en acceso abierto bajo una licencia
Creative Commons
