


Services on Demand
Journal
Article
 text in
  English (pdf)
 Article in xml format
 Article references
 Send this article by e-mail
Indicators
-
 Cited by SciELO
 -
 Access statistics
Related links
-
 Similars in
SciELO
Similars in
SciELO
Share

 Permalink
Revista mexicana de ciencias agrícolas
Print version ISSN 2007-0934
Rev. Mex. Cienc. Agríc vol.10 n.7 Texcoco Sep./Nov. 2019 Epub Dec 04, 2020
https://doi.org/10.29312/remexca.v10i7.2114
Investigation notes
Total sugars and protein in beans native to the Triqui Alta region, Oaxaca
1Campo Experimental Valle de México-INIFAP. Carretera los Reyes-Texcoco km13.5, Coatlinchán, Texcoco, Estado de México. AP. 10. CP. 56250.
2Tecnológico de Estudios Superiores de Chimalhuacán (TESCHI).
3Colegio de Postgraduados-Campus Montecillo. Carretera México-Texcoco km 36.5, Montecillo, Texcoco, Estado de México. CP. 56230.
Sowing bean compounds, which combine sizes and colors, is a cultural tradition in rural Mexico, used primarily for self-consumption. Bean blends have a visual appeal; however, little is known about the characteristics of flavor and nutritional value represented by this way of consuming beans. The objective was to know the content of protein and total sugars in native bean compounds from the Triqui Alta region of Oaxaca. In 2017, the study of three bean seed samples was carried out. Bean color was determined visually and the weight of 100 grains was measured. The total sugar content was determined with the Antrona method, and the protein content with the Kjeltec semi-automated equipment. The analyzes were performed in duplicate. In each sample at least 4 different colors and grain sizes identified as common beans (Phaseolus vulgaris L.) and ayocote (Phaseolus coccineus L.) were identified. The sugar content in medium grains was 6.17 to 6.48%, while, in large grains, -ayocote-, it was from 9.45 to 11.6%. Protein content varied between subsamples from 21.7% in black P. coccineus, to 24.8% in yellow P. vulgaris. Grain color was not associated with protein or total sugar content; however, the grain size does. A larger grain size, higher percentage of sugars (r= 0.88**) and lower protein content (r= -0.61*).
Keywords: Phaseolus vulgaris; P. coccineus; bean compounds; color of the testa
La siembra de compuestos de frijol, que combinan tamaños y colores, es una tradición cultural en las zonas rurales de México, utilizados principalmente para autoconsumo. Las mezclas de frijol tienen un atractivo visual; sin embargo, poco se sabe de las características de sabor y valor nutrimental que representa esta forma de consumir el frijol. El objetivo fue conocer el contenido de azúcares totales y de proteína en compuestos de frijol nativo provenientes de la región Triqui Alta de Oaxaca. En el 2017 se realizó el estudio de tres muestras compuestas de semilla de frijol. El color de la testa se determinó visualmente y se midió el peso de 100 granos. El contenido de azúcares totales se determinó con el método de antrona, y el contenido de proteína con el equipo semiautomatizado Kjeltec. Los análisis se realizaron por duplicado. En cada muestra se identificaron al menos 4 diferentes colores y tamaños de grano identificados como frijol común (Phaseolus vulgaris L.) y ayocote (Phaseolus coccineus L.) El contenido de azúcares en los granos medianos fue de 6.17 a 6.48%, mientras que, en los granos grandes (ayocote), fue desde 9.45 a 11.6%. El contenido de proteína varió entre submuestras desde 21.7% en P. coccineus negro, hasta 24.8% en P. vulgaris amarillos. El color de grano no se asoció con los contenidos de proteína ni de azúcares totales; sin embargo, el tamaño de grano sí. A mayor tamaño de grano, mayor porcentaje de azúcares (r= 0.88**) y menor contenido de proteína (r= -0.61*).
Palabras clave: P. vulgaris; P. coccineus; color de la testa; compuestos de frijol
Within foods, the group of edible legumes, beans are one of the most important foods in Mexico, because of their low cost and being an essential nutritional supplement in the diet, since the seed provides almost all the vegetable proteins, carbohydrates, dietary fiber, vitamins and minerals consumed by the majority of the population in the country (Gispert et al., 2004).
Because of its nutritional value, beans are a food whose consumption should be stimulated in the Triqui region, because according to the study carried out by Ramos and Mendoza (2007), the Triquis, inhabitants of the Mixteca region high and low, in the state of Oaxaca they have changed their diet to a higher consumption of industrialized foods of high caloric density and low nutritional value so that malnutrition and obesity coexist in the nutritional state. On the other hand, women are more likely to be short, which poses a risk to pregnancy. Primary malnutrition (exclusively food cause), is much more frequent in children and in pregnant or lactating women, is due to chronically insufficient or poorly structured feeding, in which energy insufficiency is combined with deficiency in the consumption of proteins, iron, and some vitamins and minerals (Bourges, 2001).
Beans constitute one of the main sources of protein in the diet of large segments of the population, mainly in rural and marginal urban areas. Protein content in 65 native genotypes of P. vulgaris beans in the state of Hidalgo varied from 16% (goat’s eye type) to 26.9% (black type). Protein, like other quality factors, is affected by the environment (Muñoz-Velázquez et al., 2009).
In the Triqui region, as in other rural areas of Mexico, different types of native beans are grown. In Mexico there are different species of beans that are sometimes planted as compounds that combine different sizes and colors, which, in addition to a cultural tradition, is an alternative to adverse environmental factors and ensures food for the families of farmers whose production it is mostly for self-consumption and sometimes a part is for sale in local markets (Martínez-López, 2018).
The mixture of types and colors of bean seeds is attractive to the eye. Anthocyanins are pigments responsible for the range of colors ranging from red to blue of many fruits, vegetables and cereals. The interest in these pigments has intensified thanks to their possible therapeutic and beneficial effects, which include the reduction of coronary heart disease, anti-cancer, anti-tumor, anti-inflammatory and anti-diabetic effects, in addition to the improvement of visual and behavioral acuity cognitive (Garzón, 2008). It has been observed that black beans can contain from 37.7 to 71.6 mg 100 g-1 of anthocyanins, Mesoamerica varieties (small grain and opaque testa) had the highest grain and testa content, so they can be used as natural antioxidants, because they are mainly of the non-acylated type (Salinas-Moreno et al., 2005).
The mixture of flavors and textures stimulates the palate of consumers. In vegetables, the sweet taste is the result of their sugar content (Sims and Golaszewski, 2003). Ingesting sugars such as glucose and fructose different receptors are activated (Lee and Owyang, 2017). Sugars not only affect the taste but can also alter the perception of flavors associated with other organic compounds Auerswald et al. (1999). Tests with panelists have shown that P. vulgaris varieties classified as sweet are preferred, and even used sweetness as a feature to differentiate between cultivars (Wszelaki et al., 2005; Mkanda et al., 2007).
Vanden Langenberg et al. (2012), report significant differences between green bean genotypes, both in the amount of sugars, as well as in the patterns of sugar accumulation; while they did not observe interactions between genotype*year of culture for the mentioned variables. In the common bean variety Puebla 152 Vanden Langenberg et al. (2012), found that as the development of the plant progressed, sucrose content remained stable, while fructose and glucose increased linearly. With this background the objective of the present study was to know the content of protein and total sugars in native bean compounds from the Triqui region of Oaxaca, planted for self-consumption.
Biological material
Three samples composed of bean seed from Santo Domingo del Estado, Oaxaca, were used and collected in 2016 at homes where bean mixtures with different colors and sizes are planted and used for self-consumption. Each sample was assigned a number (14 979, 14 981 and 14 983).
Morphological parameters of the seed
200 g of each composite sample were weighed and grouped by color and grain size. Each compound was divided into subsamples based on their size and color.
Color
It was determined visually and the seeds that constituted more than 10% in each sample, as they are the most representative.
Weight and size
The weight of 100 grains was measured, which were randomly selected and weighed on a digital semi-analytical balance. Those with a weight less than 25 g 100 seeds-1 were classified as small grains, medium those whose weight was 25 to 40 g 100 seeds-1 and large when their weight was greater than 40 g 100 seeds-1 (Allende, 2006).
Analysis of the content of total sugars and crude protein
The analyzes were performed in duplicate. The total sugar content was determined using the Antrona method (Yemm y Willis, 1954). The UV-VIS spectrophotometer was read at 630 nm. The protein content was determined according to the Kjeldahl method using the Kjeltec-1030 semi-automated equipment. The protein percentage was calculated from total nitrogen using factor 6.25.
The data were analyzed under a completely randomized design, three treatments (composite samples) and two to three subsamples, each with two repetitions. The General Linear Model (GLM) procedure of the Statistical Analysis System version 8 (SAS Institute, 1999) was used. The comparison of means was made with the Tukey test (p< 0.05). In addition, a Pearson correlation matrix was obtained.
Table 1 shows the color of the subsamples with the highest to lowest predominance of the bean grains into which each composite sample was subdivided, as well as the weight of 100 seeds, the protein content and total sugars.
Table 1 Physical characteristics, protein and sugar content in three samples composed of beans from the High Triqui region of Oaxaca.
|
Sample of number |
Color/species |
Proportion (%) |
100 seed weight (g) |
Protein * (%) |
Total sugars * |
14 979 |
Yellow (P. vulgaris L.) |
55.9 |
32.7 |
24.8 |
6.5 |
|
Black (P. vulgaris L.) |
19.2 |
31.3 |
23.7 |
6.4 |
|
Dark red (P. vulgaris L.) |
13.7 |
30.1 |
24.4 |
6.4 |
|
Pinto beige/black (P. vulgaris L.) |
6.3 |
31.8 |
||
|
Beige (P. vulgaris L.) |
4 |
|||
14 981 |
Red ( P. coccineus) |
73.8 |
73.3 |
23.4 |
9.5 |
|
Yellow (P. vulgaris L.) |
15.8 |
25.3 |
23.3 |
6.2 |
|
Black (P. vulgaris L.) |
8.5 |
34.7 |
||
|
Pinto beige |
1.9 |
20 |
||
14 983 |
Black (P. coccineus) |
76.8 |
70 |
21.7 |
9.6 |
|
Pinto wine ( P. coccineus) |
10.3 |
61.3 |
23.5 |
11.6 |
|
Wine ( P. coccineus) |
7.9 |
70.1 |
||
|
Beige (P. coccineus) |
5 |
64.2 |
nd= data not available; *= data on dry basis.
Four to five different colors and grain sizes were identified in each composite sample, including small (<25 g 100 seeds-1), medium (between 25 and 40 g 100 seeds-1) and large (> 40 g 100 seeds-1). Small and medium grains were identified as common beans (Phaseolus vulgaris L.), while large ones were identified as ayocote. (Phaseolus coccineus L.) black and red P. coccineus beans, as well as yellow and black P. vulgaris beans, were the most frequent among the three composite samples; followed by pints, wine and beige, the latter represented a proportion less than 10% in the samples.
The grain weight varied from 20 g 100 seeds-1 to 73.3 g 100 seeds-1. Highly significant statistical differences were detected between the composite samples (p≤ 0.01) for the variable weight of 100 seeds. Sample 14 979 was made up of medium-sized P. vulgaris, although of different colors, weighing between 30 and 33 g 100 seeds-1. The predominant grain size in two of the samples was the large one (>40 g 100 seeds-1), since it is P. coccineus, which represented 74% of the 14 981 and 100% of the sample 14 983. The grains of size Small were rare and accounted for less than 2% of the sample 14 981.
Sample 14979 contained yellow, black, red and pinto grains. Three of the four colors that made it up are similar to those reported by Espinosa-Pérez et al. (2015), for the 040 collection of Oaxaca, which is a Ensaladilla type with black, red and pinto black beans and its size between small and medium, does not exceed 36 g 100 seeds-1. In sample 14 981 the red grain P. coccineus (73.3 g 100 seeds-1) was the predominant and 24% of the sample consisted of yellow and black P. vulgaris of medium size (25.3 and 34.7 g 100 seeds-1 respectively, and only 2% small-colored P. vulgaris beige (20 g 100 seeds-1). Finally, in sample 14 983 the four beans were P. coccineus, 77% black and 23% colors pinto, wine and beige.
Total sugar content
The percentage of total sugars in grain types was 6.2 to 6.5%, in P. vulgaris grains, classified in medium size, while in P. coccineus, classified in large size, sugars accounted for 9.5 to 11.7%. Highly significant statistical differences were detected between the composite samples (p< 0.01) in the total sugar content. The concentration of total sugars was positively correlated with the grain size (r= 0.88**).
Differences in the sugar content of the different grain colors were observed; however, the most notable differences were observed between the two species: P. vulgaris and P. coccineus. Also in green beans, differences between genotypes in the amount of total sugars have been observed, while in Puebla 152 common bean it was observed that as the development of the plant progressed the concentration of some sugars was modified, the sucrose content remained stable, while fructose and glucose increased (Vanden Langenberg et al., 2012).
The higher sugar content in P. coccineus compared to P. vulgaris, is associated with a sweeter taste, which according to the work of (Mkanda et al., 2007; Wszelaki et al., 2005). It can motivate greater acceptance by consumers. The above is reaffirmed with testimonies of the women of Santo Domingo in the state, who affirmed that the black and red ayocote beans are the best tasting, so they are part of the traditional dishes; they are used to make bean atole (nakinj runee), one of the typical dishes of the High Triqui region, can be consumed on the day of the dead and in the wake (Martínez-López et al., 2018). Figure 1 shows the total sugar content and the grain size of each bean subsample in the three composite samples.
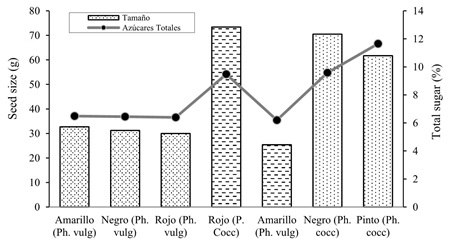
Each bar texture groups the subsamples that make up a compound.
Figure 1 Total sugar content and grain size of three bean compounds (P. vulgaris and P. coccineus).
The differences in the content of total sugars between the P. vulgaris and the P. coccineus that make up the sample, suggest that each of the samples, according to the predominance of one or the other of these bean species will have greater or lesser intensity Sweet taste and with it its organoleptic attributes will be different. Protein content showed significant statistical differences between the composite samples (p< 0.05). The variation between subsamples was from 21.7% in P. coccineus black, to 24.8% in P. vulgaris yellow (Table 1).
The protein content in the P. vulgaris genotypes was within the range reported for beans native to different areas of Mexico that was between 17.8 and 26.5% (Jacinto-Hernández et al., 2002). The tendency to higher protein content was observed in P. vulgaris beans, whose weight varied between 25.3 and 34.7 g 100 seeds-1, compared to P. coccineus that showed weight between 61.3 to 73.3 g 100 seeds-1.
The above contributed to a negative correlation between grain size and protein content (r= -0.61*). However, differences in protein content between genotypes of the same species were also observed. Figure 2 shows the protein content and grain size of each bean subsample in the three composite samples.
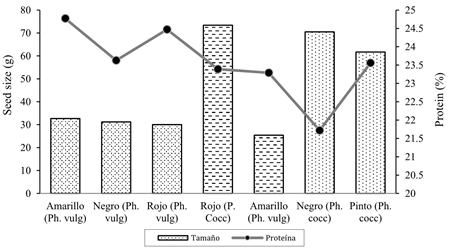
Each bar texture groups the subsamples that make up a compound.
Figure 2 Crude protein content and grain size of three bean compounds (P. vulgaris and P. coccineus).
The composite sample 14 979 the protein range in the P. vulgaris samples ranged from 23.7 to 24.8%, the medium-sized yellow and red beans were the ones with the highest protein content with 24.8 and 24.5% (Table 1), while in sample 14981 both P. coccineus and P. vulgaris showed close values, 23.3 and 23.4% respectively.
Compound 14983 showed a difference between the two P. coccineus samples that comprise 21.7% black and 23.5% pinto- wine protein. Grain color was not associated with protein content and total sugars; however, the grain size does. A larger grain size, a higher percentage of sugars (r= 0.88**) and a lower protein content (r= -0.61*).
Conclusions
Higher sugar content was observed in P. coccineus beans compared to P. vulgaris; while the latter tended to show higher protein content. A larger grain size was associated with higher total sugar content (r= 0.88**) and lower protein content (r= -0.61*).
The composite sample 14 979, made up of different colors of P. vulgaris, showed higher average protein content (24.3%) while the sample 14 983 formed by P. coccineus showed the sweetest taste (10.7% total sugars), although lower average protein content (22.7%).
The values obtained indicated that the grain color was not associated with the protein or total sugar content.
The natural variation that tends to exist between the content of crude protein and total sugars between P. vulgaris and P. coccineus, can be used to design compounds with different sensory and nutritional characteristics that can be incorporated into both local markets in rural and urban populations.
Literatura citada
Auerswald, H., D. Schwarz, C. Kornelson, A. Krumbein, and B. Bruckner. 1999. Sensory analysis, sugar and acid content of tomato at different EC values of the nutrient solution. Sci. Hort. 82(3):227-242. [ Links ]
Bourges, R. H. 2001. Alimentación y nutrición en México. Comercio Exterior. 51(10):897-904. [ Links ]
Espinosa-Pérez, E. N., Ramírez-Vallejo, P., Crosby-Galván, M. M., Estrada-Gómez, J. A., Lucas-Florentino, B., & Chávez-Servia, J. L. 2015. Clasificación de poblaciones nativas de frijol común del centro-sur de México por morfología de semilla. Rev. Fitotecnia Mexicana. 38(1):29-38. [ Links ]
Garzón, G. A. 2008. Las antocianinas como colorantes naturales y compuestos bioactivos: revisión. Red de Revistas Científicas de América Latina, Redalyc. Org. 13(3):27-36. [ Links ]
Gispert C., M., A.R. Gonzáles E., H. Rodríguez G., L. Luna C., I. de la Cruz C. I. 2004. La montaña de Humo. Tesoros Zoques de Chiapas. 1ª ed. Universidad Nacional Autónoma de México (UNAM). 101 p. [ Links ]
Jacinto-Hernández, C., Bernal-Lugo, I. Garza-García, R., 2002. Food quality of drybean (Phaseolus vulgaris L.) landraces from different states of México. Annual Report of the Bean Improvement Cooperative BIC. Michigan State University. East Lansing, MI 48824. 45(1):222-223. [ Links ]
Lee, A. A., and Owyang, C. 2017. Sugars, Sweet Taste Receptors, and Brain Responses. Nutrients, MDPI, 9(7):653-685. [ Links ]
Martínez-López, L., Zapata-Martelo, E., Ayala-Carrillo, M. d., Martínez-Corona, B., Vázquez-Carrillo, G., Jacinto-Hernández, C., y Espinosa-Calderón, A. 2018. Conocimiento práctico y teórico de maíz y frijol en la Región Triqui Alta, Oaxaca. Revista Mexicana de Ciencias Agrícolas. 9(1):111-121. [ Links ]
Martínez-López, L. 2018. Comunicación personal. 21 de noviembre de 2018. [ Links ]
Mkanda, A.V., A. Minnaar, and H.L. de Kock. 2007. Relating consumer preference to sensory and physicochemical properties of dry beans (Phaseolus vulgaris). J. Sci. Food Agr. 87(15):2868-2879. [ Links ]
Muñoz-Velázquez, E. E., Rubio-Hernández, D., Bernal-Lugo, I., Garza-García, R., y Jacinto-Hernández, C. 2009. Caracterización de genotipos nativos de frijol del estado de Hidalgo, con base a calidad del grano. Agricultura Técnica en México. 35(4):429-438. [ Links ]
Ramos R., R. M., & Sandoval M., K. 2007. Estado nutricional en la marginación y la pobreza de adultos triquis del estado de Oaxaca, México. Rev. Panam. Salud Pública. 22(4):260-267. [ Links ]
Salinas-Moreno, Y., Rojas-Herrera, L., Sosa-Montes, E., y Pérez-Herrera, P. 2005. Composición de antocianinas en variedades de frijol negro (Phaseolus vulgaris L.) cultivadas en México. Agrociencia. 39:385-394. [ Links ]
Sims, C. A. and R. Golaszewski. 2003. Vegetable flavor and changes during postharvest storage. In: Bartz, J.A. and J.K., Brecht (eds.). Postharvest physiology and pathology of vegetables. Marcel Dekker, New York, NY. 331-340 pp. [ Links ]
Statistical Analysis Systems Institute (SAS Institute). 1999. The SAS for windows version eight. SAS Institute Inc. Cary, N. C., USA. 1028 p. [ Links ]
VandenLangenberg, H. M. Bethke, P. C. Nienhuis, J. 2012. Patterns of fructose, glucose, and sucrose accumulation in snap and dry bean (Phaseolus vulgaris) pods. HortScience. 47(7):874-878. [ Links ]
Wszelaki, A.L., Delwiche, J.F., Walker, S.D., Liggett, R.E., Miller, S.A. and Kleinhenz., M.D. 2005. Consumer liking and descriptive analysis of six varieties of organically grown edamametype soybean. Food Qual. Prefer. 16(8):651-658. [ Links ]
Yemm, E. W. and A. J., Willis. 1954. The estimation of carbolhy-drates in plant extracts by anthrone. Biochem. J. 57(1):508-514. [ Links ]
Received: September 01, 2019; Accepted: October 01, 2019
 Este es un artículo publicado en acceso abierto bajo una licencia Creative Commons
