


Services on Demand
Journal
Article
 text in
  English (pdf)
 Article in xml format
 Article references
 Send this article by e-mail
Indicators
-
 Cited by SciELO
 -
 Access statistics
Related links
-
 Similars in
SciELO
Similars in
SciELO
Share

 Permalink
Revista mexicana de ciencias agrícolas
Print version ISSN 2007-0934
Rev. Mex. Cienc. Agríc vol.10 n.5 Texcoco Jun./Aug. 2019 Epub Mar 03, 2020
https://doi.org/10.29312/remexca.v10i5.1852
Articles
Economic growth rates of legumes with low water consumption
* Universidad Politécnica de Pénjamo. Carretera Irapuato-La Piedad km 44, Predio El Derramadero, Pénjamo, Guanajuato, México. CP. 36921. Tel. (469) 6926000. (gmoreno@uppenjamo.edu.mx; elicea@uppenjamo.edu.mx; acastro@uppenjamo.edu.mx/).
The objective of this work was to analyze the production behavior and economic growth rates of beans (Phaseolus vulgaris L.) and chickpea (Cicer arietinum L.). In Mexico, about 1.93 million hectares are destined to the cultivation of five legumes, which corresponds to beans (91.7%), chickpeas (6.4%), faba beans (1.4%), lentils (0.4%) and peas (0.1%). The production data were obtained from the statistical yearbook of production (http://infosiap.siap.gob.mx/aagricola-siap-gb/icultivo/, for the period 2013-2017). The area planted with beans, presented a positive annual growth rate of 0.84%, with the state of Zacatecas and Durango participating with 59% of the total ha nationwide, while Guanajuato has a 6% share, with Penjamo being the which has a total of 8% of the surface in the state. In chickpea, an annual average growth rate was obtained, with negative values, for the planted area, -5.01%, being Sinaloa and Sonora those that represent 77% of the total area sown nationally, Guanajuato contributes 6%, while that the municipalities of Pénjamo and Valley of Santiago had the highest values. The price per ton and the value of the production had positive values with respect to the average annual growth rates in the bean crop, while in chickpeas the growth rates with positive values were the yield, the price per ton and the production value.
Keywords: Cicer arietinum L.; Phaseolus vulgaris L.; bean; chickpea; production
El objetivo de este trabajo fue analizar el comportamiento de la producción y tasas de crecimiento económico de frijol (Phaseolus vulgaris L.) y garbanzo (Cicer arietinum L.). En México, se destinan alrededor de 1.93 millones de hectáreas al cultivo de cinco legumbres, que corresponde a frijol (91.7%), garbanzo (6.4%), haba (1.4%), lenteja (0.4%) y chícharo (0.1%). Los datos de producción se obtuvieron del anuario estadístico de la producción (http://infosiap.siap.gob.mx/ aagricola-siap-gb/icultivo/, del periodo 2013-2017). La superficie sembrada de frijol presentó una tasa positiva de crecimiento media anual de 0.84%, siendo el estado de Zacatecas y Durango que participan con 59% del total de ha a nivel nacional, mientras que a Guanajuato le corresponde 6%, siendo Pénjamo el que tiene un total de 8% de la superficie en el estado. En garbanzo, se obtuvo una tasa de crecimiento media anual, con valores negativos, para la superficie sembrada, -5.01%, siendo Sinaloa y Sonora los que representan 77% del total de la superficie sembrada a nivel nacional, Guanajuato aporta 6%, mientras que los municipios de Pénjamo y Valle de Santiago tuvieron los valores más altos. El precio por tonelada y el valor de la producción tuvieron valores positivos con respecto a las tasas de crecimiento media anual en el cultivo de frijol, mientras que en garbanzo las tasas de crecimiento con valores positivos fueron el rendimiento ha, el precio por tonelada y el valor de la producción.
Palabras clave: Cicer arietinum L.; Phaseolus vulgaris L.; frijol; garbanzo; producción
Introduction
Despite the fact that population growth rates have gradually decreased, it is expected that in the coming years the world population will exceed 9 billion people, of whom almost 70% will inhabit developing countries, including Mexico, which will generate an increased demand for food FAO (2009). According to the projection of the FAO for the year 2050, these countries will contribute 80% of the increase of the agricultural production through the implementation of intensive cultivation and with better yields. This represents a great challenge for agriculture in Mexico, since despite the fact that almost a quarter of its population lives in rural areas and performs agricultural activities, less than 10% of the rural economic units (UER, for its acronym in Spanish) account for 74% of the market sales.
In contrast, 73% of the UER are family-type where more than 90% or the total of their agricultural production is for self-consumption (FAO, 2012). The main source of protein in human food is of animal origin, whose production requires more resources than agriculture, so it has been proposed to grow legumes as an alternative protein source to cover the demand for food (Acosta et al., 2013). The legume family has an approximate of 19 400 species (Ríos, 2017). The bean is the most cultivated legume in the world, with more than 34.9 million hectares planted in 2017 (FAOSTAT, 2017), followed by the chickpea with 14.5 million hectares.
According to data from the Agri-Food and Fisheries Information Service (SIAP), in Mexico, the center of origin of beans, during 2017, 1 843 million hectares were allocated to the cultivation of five legumes, where beans contributed 91.1%, followed by chickpeas with 6 % and faba beans, lentils and dry peas with less than 3%.
Besides corn, it is one of the most important crops in the agricultural sector of Mexico (García et al., 2006), which contributes 35% of the world production, being the main producing states Zacatecas, Sinaloa, Durango, Chihuahua, Chiapas, Nayarit and Guanajuato. The consumption of beans is governed by economic, cultural and natural factors; this is given by income of the families and in function of the price of the grain, in addition to fulfilling alimentary and socioeconomic functions (Ayala et al., 2008; Rodríguez-Licea et al., 2010).
The bean, is developed in climates of variable ecological conditions, giving rise to the selection and development of cultivated genotypes, with different characteristics. In turn, it is susceptible to diseases such as common mosaic virus, rust and pests, which limit its yield, which fluctuates between 600 and 900 kg ha-1. In nutritional aspects, this legume, is a supplement of cereals as a source of vegetable protein with a contribution of 22%, minerals such as iron, calcium, potassium and phosphorus, is rich in B vitamins and low sodium USDA, FAS (2013), in turn, is also a source of economic income for the farmer (Ríos, 2017).
The cultivation of chickpea (Cicer arietinum L.) occupies the 2nd place in the world, for its high nutritional value, use and preference. In Mexico, its production is destined to human consumption and as grain of export, in smaller quantity its consumption is fresh, it is also produced for the formulation of balanced feed in the pork industry in Guanajuato, Michoacán and Jalisco (Acosta et al., 2013). Two types of cultivated chickpea, Kabuli and Desi, are identified, whose main differences are focused on seed characteristics and plant development, due to adverse effects, both biotic and abiotic (García, 2015).
The chickpea that is grown in Mexico, is characterized by the shape, color and size of grain, which is large and produced by varieties developed in Mexico. This crop is sown in the autumn-winter agricultural cycle, due to its low water requirements for its development and its economic importance, which is a generator of foreign exchange, since it is reported that in a period of five years more was obtained of 100 million dollars in the sale of the production in the international market (Manjarrez et al., 2004). The chickpea has a high nutritional value, 100 g provide 360 calories, contain 20% protein, 6.5% fat, 130 mg of calcium, 8 mg of iron and vitamins (García, 2015), is also a source of tryptophan and phenylalanine, amino acids that help in the level of satisfaction and satiety, to combat overweight problems (Montenegro et al., 2011).
It is marketed fresh and its quality is associated with the number of grains per pod, size and turgor of the pod, Palmer and Young (2000). The producing states nationwide are Sonora, Sinaloa, Baja California, Michoacán and Guanajuato (SIAP, 2017). The chickpea has social importance by the demand of labor, since most of the harvest is done manually. In the region of Ciénega de Chapala, in Jalisco, Mexico, chickpea cultivation is widely known by producers, since traditionally it is sown in residual moisture and develops without weed problems and on a smaller scale in irrigation (Soltero et al., 2010).
Materials and methods
Bean production data for the spring-summer and chickpea cycle of the autumn-winter cycle were obtained from the database of the statistical yearbook of production (http://infosiap.siap.gob.mx/aagricola-siap-gb/icultivo/), it includes the period of (2013-2017). In the database, the states with the highest production at the national level were identified and in the state of Guanajuato, the municipalities with the greatest impact on the production of both crops were identified. The average annual growth rate was calculated, and the following variables were analyzed: Area sown (ha) yield per hectare, production (t), rural average price (PRM) and production value.
Results
In Figure 1, the trend of the planted area of beans nationwide between the 2013-2017 period, during the spring summer cycle, shows an increase of 7.7% corresponding to 1 487 070 ha in 2014, however in the following years there was a gradual decrease to 5.18%, registering a total of 1 413 741 ha in 2016, for 2017, there was a slight increase of 0.40%, with an average annual growth rate of 0.84%, due to the variation in the reduction of the area sown with beans.

Figure 1 Area planted with beans (millions of hectares), nationally, during the spring-summer agricultural cycle, in the period 2013 to 2017 (SIAP- Statistical yearbook of agricultural production).
During the period from 1980 to 2014. De Los Santos-Ramos et al. (2017) reported a negative trend, with an average annual growth rate of -0.24%, because the planted area increased from 1 967 162 to 1 773 996 ha, with a decrease of 193 165 ha, this situation was due to gradual deterioration of the prices paid to producers, generating the search for more profitable crop alternatives; it is worth mentioning that this downward trend continued to occur in the years from 2013 to 2017. In turn, García et al. (2006) mentions that the decrease in the area planted to beans is attributed to the fact that farmers stop working their land and seek options for establishing more profitable crops, with the consequent deterioration of rural income due to the fall in prices paid to the producers; as well as the international migration mainly to the United States of North America and the internal migration that occurs towards the big cities of Mexico (Carrera, 2008) swelling the ranks of unemployment or belts of misery.
Considering the area sown nationally, the state of Zacatecas ranks first with 42%, followed by Durango with 17%, Chihuahua and San Luis Potosí with 8% respectively, Guanajuato 6%, Chiapas 5%, Puebla 4%, while the rest of the states contribute 10%.
As mentioned, Guanajuato contributes 6% of the national total, where the surface is distributed in a similar manner in all municipalities, with San Felipe, Pénjamo, Salamanca and Irapuato, Abasolo and Valley of Santiago participating with 9, 8, 5 and 4% respectively, while 65% includes the other municipalities of the state (Figure 2).

Figure 2 Percentage of distribution of planted area of beans, by municipalities of the state of Guanajuato, during the spring-summer agricultural cycle, in the period from 2013 to 2017 (SIAP- Statistical yearbook of agricultural production).
In Figure 3, the ratio of production and yield per hectare is reported, with respect to bean production, the highest values were recorded in 2013 with 1 041 235 t, later, it decreased by 15.4%, up to reach a total of 880 951 t in 2017, thus having a negative growth rate of -3.79%.
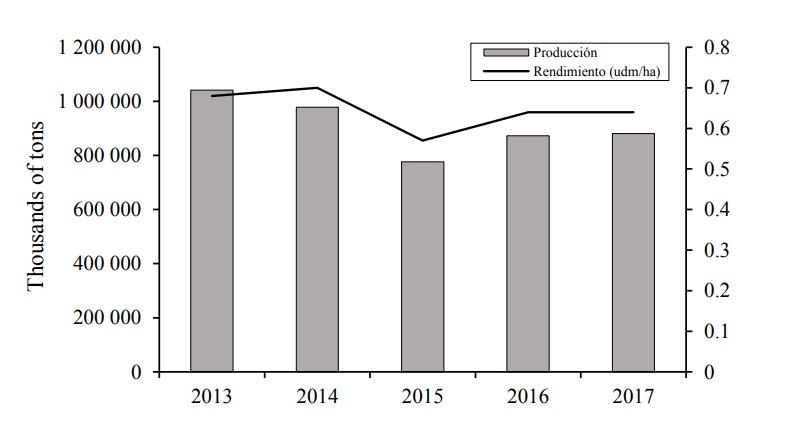
Figure 3 Production (thousands of tons) and yield per hectare of beans nationwide, during the spring-summer agricultural cycle, in the period from 2013 to 2017 (SIAP- Statistical yearbook of agricultural production).
This indicates that the decline in bean production during the years from 2013 to 2017, continues to be maintained, and may be due to the fact that, in recent years, 70% of bean production is obtained from areas of rain-fed (Ortega and Ochoa, 2003), generating serious effects on yield due to abiotic factors such as drought, excessive rainfall, early frost and biotic due to the attack of pests and diseases (Márquez et al., 2006).
On the other hand, De Los Santos-Ramos et al. (2017), they identified a great variation with an annual average growth rate of 0.89% and an increase of 338 783 t, in 2014 the production was 1 273 957 t, in turn, in 1989 the lowest value was registered, with 593 436 t, while in 2002 it amounted to 1 549 091 t, these increases were mainly due to the use of improved seeds in the irrigation production system (FIRA, 2015).
In the yield per ha, the variation was lower, since the highest value was 700 kg ha-1 in 2014, while in 2015 the yield decreased to 570 kg ha-1 which corresponds to 18.5%, there was a slight recovery in subsequent years, and reached 640 kg ha-1; however, it was lower than in 2013 with 680 kg ha-1, there was a negative annual average growth rate with a value of -1.21% for 2017. De Los Santos-Ramos et al. (2017), indicate that bean yields went from 600 to 760 kg, with an average annual growth rate of 0.68%, for 35 years that comprised the study period, with their respective variants.
In 1988, the lowest yield was registered with 440 kg ha-1 and the highest in 2009 with 860 kg ha-1, this was attributed to the introduction of technological packages, encouraged by government programs, such as the corn, rice and beans program (PROMAF), which provided economic resources to producers, technical advisory services, training, technological innovation, organizational development, as well as the induction towards sustainable agriculture and the use of credit to capitalize and improve profitability.
Considering the production and yield of beans, there was a trend similar to the area planted, with Zacatecas being the state that occupied the first place with 42%, followed by Durango with 16%, Chihuahua with 11%, Guanajuato with 6%, Puebla 5%, San Luis Potosi and Chiapas 4% respectively and the rest of the states contributed 12%. The trend of price per ton (t) and value of production is shown in Figure 4, with a positive trend during the period 2013-2017, due to the increase in both variables.
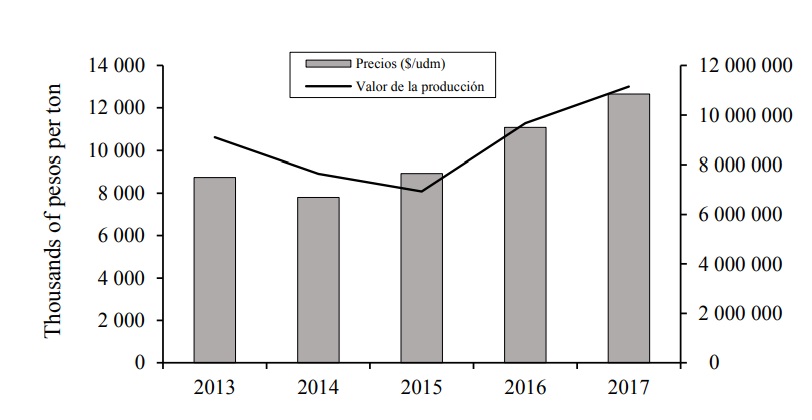
Figure 4 Price (thousands of pesos per t) and value of production (millions of pesos) of beans nationwide, during the spring-summer agricultural cycle, in the period from 2013 to 2017. (SIAP- Statistical yearbook of agricultural production).
The price per ton had an increase that goes from $8 735.00 pesos in 2013 to $12 651.00, which represents 30.9% more and with an average annual growth rate of 7.688%, with respect to the value of production in 2013, $9 096 081.00 pesos, while for 2017 they reached values of $11 145 577.00 representing an increase of 18.38%, with an average annual growth rate of 4.148%.
During the period from 1995 to 2014, there was an average annual growth rate of beans of 0.95%, so the decrease in the income of the producers led to the decapitalization of the field, the increase of poverty in rural areas, unemployment and migration (Dussel, 2004). During this period, Mexican producers have suffered various problems that seriously affect the decrease in profitability and competitiveness (SAGARPA-SIACON, 2006). On the other hand, in the states with the largest production of beans, Zacatecas, Durango, Chihuahua, Guanajuato, Puebla, San Luis Potosí and Chiapas, the average price per ton corresponds to 21%, while the rest covers the other producing states.
It is important to mention that the value of bean production is centered in the states of Zacatecas with 20%, Durango 15% and Chihuahua 12%, while Chiapas, Guanajuato and Puebla account for 15% and San Luis Potosi with 4% and the rest, 35% corresponds to the other producer states.
Guanajuato that participates with 5% of the value of production, Figure 5, the distribution of prices is similar throughout the state, since Pénjamo contributes 9% of the total in the state, followed by Irapuato and Salamanca 6% each and Abasolo, Valley of Santiago, San Felipe with 5% respectively, while the remaining 64% corresponds to the other municipalities in the state.

Figure 5 Percentage of distribution of the value of bean production in the state of Guanajuato, during the spring-summer agricultural cycle, in the period from 2013 to 2017 (SIAP- Statistical yearbook of agricultural production).
The chickpea (Cicer arietinum L.) is a crop of autumn-winter agricultural cycle, it is a legume that requires low moisture content for its development and presents delicate problems when there are rains out of season, causing an incidence of pathogens of the soil, such as Fusarium, resulting in considerable crop losses; however, in good environmental conditions it can generate important profits for producers.
In 2013, the area planted with chickpeas at the national level, Figure 6, was 123 196 ha; however, there was a gradual decrease of 46% until reaching 2016 with a total of 65 943 ha, in 2017 there was an increase of 30.7%, representing 95 259 ha, still below the highest value in the year 2013, with a negative annual average growth rate of -5.01%. In 2015, according to data from the Agrifood and Fisheries Information System (SIAP, 2015), an area of 81 262 ha was planted in Mexico, with a production of 126 589 t and an average yield of 1.6 t ha-1.

Figure 6 Area sown (thousands of hectares) of chickpeas nationally, during the autumn-winter agricultural cycle, in the period from 2013 to 2017 (SIAP- Statistical yearbook of agricultural production).
Of the planted area of chickpea that is reported nationally, Sinaloa and Sonora are the states with the largest participation, 56% and 21% respectively; while the rest is distributed in Michoacan with 9%, Guanajuato 6%, Baja California Sur with 6%, Jalisco 1% and the rest of the states with only 2%, therefore, the northwest region is the main producing area. The states of Sinaloa, Sonora and Baja California Sur, occupied more than 60 000 ha of planted area and production was exported to Spain, Algeria, Italy, Turkey and Portugal (Palau, 2014).
Chickpea production has had a considerable decline during the period from 2013 to 2017, Figure 7, since in 2013 209 031 t were reported, with a drop of 43.1%, which equals 118 808 t in 2016; however, in 2017 it rose to 183 501 t, which corresponds to an increase of 35.2%, with an annual negative rate of growth of -2.57%. As for the yield per hectare, it increased in 2013 from 1.82 t ha-1 to 1.95 t ha-1, which is equivalent to 6.6% and a growth rate of 1.39%.
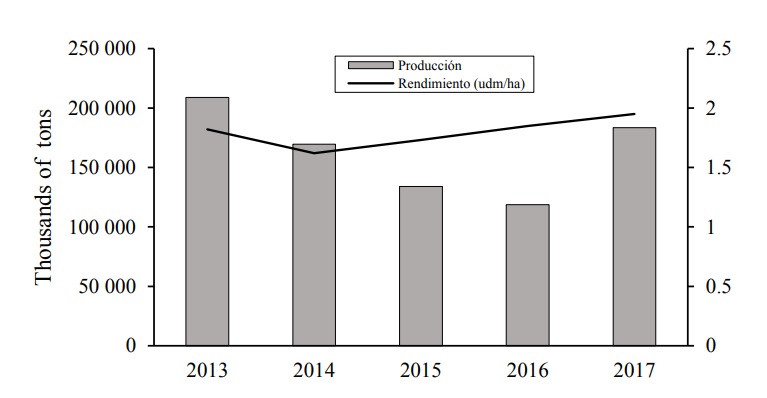
Figure 7 Production (thousands of tons) and yield per hectare of chickpea, during the autumn-winter agricultural cycle, in the period from 2013 to 2017 (SIAP- Statistical yearbook of agricultural production).
This production, presented a tendency similar to that of the sown area (Figure 6), since it is concentrated in the states of Sinaloa and Sonora 54% and 26% respectively, while the rest is distributed in Michoacan with 8%, Baja California Sur 5%, Guanajuato with 5%, Jalisco and the other states with 1% each.
The price of the chickpea during 2013 had a value of $12 520.00 pesos per ton, there was a decrease in 2014 of 27.90% to a total of $9 010.00 pesos, later it increased again to 50.30%, until reaching a total of $18 180.00 pesos t , in 2017 (Figure 8), thus having a growth rate of 7.74%. The value of production decreased 47.40% during the period from 2014 to 2016, from a total of $2 617 201.00 pesos in 2013, to $1 375 047.00 pesos in 2016; however, in 2017 the value of production increased by 58.7%, with a total of $3 336 084.00 pesos, with an average annual growth rate of 4.97%.

Figure 8 Price (thousands of pesos) and value of the production (millions of pesos) of chickpea, during the autumn-winter agricultural cycle, in the period from 2013 to 2017 (SIAP- Statistical yearbook of agricultural production).
Experts in the matter, affirm that the chickpea has a variable price, since it rotates in function of the offer and the demand, in addition to not forms part of the basic basket. Samuel López Angulo, president of the State Committee of Plant Health of Sinaloa (Cesavesin), says that in 2018 there were variable prices in the commercialization of the chickpea, because at the beginning of the harvest was around 18, 20 pesos per kilo and finally after there was an overproduction and went down to 12, in another part to 13 or 14 per kg.
The value of the production of chickpeas is distributed in greater proportion in the states of Sinaloa and Sonora with 54% and 26% respectively, production that is largely for export to Spain, Algeria, Italy, Portugal, India, Turkey and Arab Nations, and the remaining 20% is distributed in Michoacán with 8%, Guanajuato and Baja California Sur with 5% each and the remaining 2% corresponds to Jalisco and the other producing states.
In Figure 9, it is shown how the distribution of the planted area of garbanzo in the municipalities of the state of Guanajuato, where Jerecuaro stands out with an average of 625 ha, Jaral del Progreso 180 ha, Pénjamo 957 ha, Valley of Santiago 851 ha and Yuriria 526 ha, there is a large variation in the period from 2013 to 2017, showing a negative growth rate of -3.487%. In 2014, Pénjamo and Valley of Santiago reported a total of 2 787 ha and 3 648 ha, respectively, the largest area planted during that period.

Figure 9 Area sown (ha) of chickpea, in municipalities of the state of Guanajuato, during the autumn-winter agricultural cycle, in the period from 2013 to 2017 (SIAP- Statistical yearbook of agricultural production).
In Figure 10, the distribution of chickpea yield per ha is indicated in the municipalities of the state of Guanajuato, where Penjamo and Valley of Santiago had on average yields of 1.62 and 1.67 t ha-1, higher than Yuriria with 1.47 t ha-1, Jaral del Progreso with 1.19 t ha-1 and Jerecuaro with 0.8 t ha-1, with an average annual growth rate of 7%.

Figure 10 Yield per hectare of chickpea, in municipalities of the state of Guanajuato, during the autumn-winter agricultural cycle, in the period from 2013 to 2017 (SIAP- Statistical yearbook of agricultural production).
The yield depends to a great extent on the environmental conditions that occur during its development cycle, such as frosts and atypical rains in winter that cause root rot in the cultivation of chickpea, and among them the most important one is Fusarium wilt or vascular wilt, caused mainly by Fusarium oxysporum f. sp. Ciceris (FOC) (Trapero-Casas and Jiménez-Díaz, 1985a), vascular fusariosis caused by FOC is characterized by two distinguishable symptoms ‘vascular withering’ and ‘vascular yellowing’.
Both symptoms are the result of vascular infections in the plant that are associated with a dark brown coloration of the xylem and occasionally the marrow of the root, neck and stem of the infected plants (Trapero-Casas and Jiménez-Díaz, 1985b).
Conclusions
The planted area of beans, during the period 2013 to 2017, presented an average annual growth rate of 0.842%, with the state of Zacatecas and Durango accounting for 59% of the total ha nationwide, while the state of Guanajuato it corresponds 6%, being Pénjamo the municipality that has a total of 8% of the surface in the state.
During the same period, bean production at the national level had an average growth rate with negative values, -3.79%, while yield per hectare also decreased, reaching a negative growth rate of -1.21%. The variables that presented positive average growth rates were the price per ton and the value of the production with a value of 7.68% and of 4.148%, respectively.
In the cultivation of chick-pea, an annual average growth rate was obtained, with negative values, for the planted area, -5.01%, within which the states with the highest production are Sinaloa, Sonora, which represent 77% of the total area sowed at a national level, in the case of Guanajuato, it contributes 6%, while within the state the municipalities of Pénjamo and Valley of Santiago are the ones with the highest values.
With respect to production and yield por hectare, there were average annual growth rates, with negative values -2.57% for production, while yield had 1.389% average annual growth rate. The price of the chickpea showed an annual average growth rate with positive values of 7.744%, while the value of the production had an annual average growth rate of 4.974%.
Literatura citada
Acosta, G. J. A.; Salinas P. R. A.; Ortega, M. P. F.; Padilla, V. I.; Fierros, L. G. A. y Valenzuela, H. V. 2013. Programa de investigación de garbanzo en el INIFAP. In: Maldonado, N. L. A.; Ortega, M. P. F. y Grageda, G. J. (Eds.). Simposio Nacional de Garbanzo. Hermosillo, Sonora. Memoria técnica Núm. 33. CIRNO-INIFAP. 141 p. [ Links ]
Ayala, A.V.; Schwentesius, R.; Almaguer, G. y Gómez A. 2008. Competitividad del frijol mexicano frente al de Estados Unidos en un contexto de liberalización comercial. Región y Sociedad. 20(42):37-72. [ Links ]
Carrera, C. B. 2008. La ovinocultura en México: ¿alternativa para los productores rurales? Avances Cuadernos de trabajo núm. 207. 17 p. [ Links ]
De los Santos, R. M.; Romero, R. T.; Bobadilla, S. y Ernesto, E. Dinámica de la producción de maíz y frijol en México de 1980 a 20141. Agron. Mesoam. 28(2):439-453. [ Links ]
Dussel, P. E. 2004. Efectos de la apertura comercial en el empleo y el mercado laboral de México y sus diferencias con Argentina y Brasil (1990-2003). Unidad de análisis e investigación sobre el empleo. OIT (Oficina Internacional del Trabajo). Ginebra. Documentos de estrategias de empleo 2004/10. 76 p. [ Links ]
FAO. 2009. La agricultura mundial en la perspectiva del año 2050. Foro de expertos de alto nivel-Como alimentar al mundo 2050. Roma. http://www.fao.org/fileadmin/templates/wsfs/ docs/Issues-papers/Issues-papers-SP/La-agricultura-mundial.pdf. [ Links ]
FAO. 2012. Diagnóstico del sector rural y pesquero: identificación de la problemática del sector agropecuario y pesquero de México. México: FAO-SAGARPA. [ Links ]
FAOSTAT. 2017. Base de datos sobre alimentación y agricultura. Estadísticas de cultivos 2017. Organización de las Naciones Unidas para la Alimentación y la Agricultura. http://www.fao.org/faostat/es/#data/QC. [ Links ]
FIRA. 2015. Fideicomisos Instituidos en Relación a la Agricultura. Panorama Agroalimentario Frijol. https://www.gob.mx/cms/uploads/attachment/file/61950/panorama-agroalimentario -frijol-2015.pdf. [ Links ]
García, C. L. 2015. Proyecto de exportación de garbanzo http://www.web.facpya.uanl.mx/ Vinculategica/Revistas/663-681%20Proyecto%20de%20exportacion%20de%20garbanzo%20A%20turquia,%20estudio%20de%20mercado.pdf. [ Links ]
García, J. A.; Rodríguez, G.; Sáenz, A. y Rebollar, S. 2006. Políticas para mejorar la competitividad de la producción de maíz y frijol en México. Rev. Fitotec. Mex. 29(núm. Esp. 2):115-121. https://www.inforural.com.mx/el-precio-del-garbanzo-gira-en-la-oferta-y-la-demanda/. [ Links ]
Manjarrez, S. P.; Gómez, G. L.; Salinas, P. R. A. y Armenta, S. J. L. 2004. Blanco Sinaloa-92: caso exitoso del mejoramiento genético de garbanzo en Sinaloa. SAGARPA-INIFAP-CIRNOC.E. Valle de Culiacán. Folleto para Productores Núm. 52. 21 p. [ Links ]
Márquez, B. S.; Schwentesius, R.; Ayala, A. y Kalil, A. 2006. La globalización y su efecto en la producción agrícola de las zonas áridas y semiáridas de México. Rev. Chapingo Ser. Zonas Áridas. 2:107-116. [ Links ]
Montenegro, F.; Fernández D. C., Hernández P. J. 2011. Descripción de seis nuevas líneas de garbanzo (Cicer arietinum L) en fincas de productores. Cultivos Tropicales. 32(4):44-48. [ Links ]
Ortega, R. C. y Ochoa, R. 2003. El frijol mexicano y el nuevo siglo. Claridades Agropec. núm. 124. 6-15 pp. [ Links ]
Palau, B. E. E. 2014. Una reflexión sobre la exportación de garbanzo en el siglo XX1. Maldonado, N. L. A.; Ortega, M. P. F. y Grageda, G. J. (Eds.). In: Simposio Nacional de Garbanzo. Hermosillo, Sonora. Memoria técnica núm. 33. CIRNO-INIFAP. 141 p. [ Links ]
Palmer, K. M. and Young. P. W. 2000. Higher diversity of R. leguminosarum bv. Viciae populations in arable soils than in grass solis. Applied and Environmental Microb. 66(6):2445-2450. [ Links ]
Ríos, J. Á. 2017. Selección y almacenamiento de semilla de frijol. http://www.zacatecas.inifap.gob.mx/publicaciones/almacenamientoFrijol.pdf. [ Links ]
Rodríguez, L. G.; García, S. J.; Rebollar, R. S. y Cruz, C. A. 2010. Preferencias del consumo de frijol (Phaseolus vulgaris L.) en México: factores y características que influyen en la decisión de compra diferenciada por tipo y variedad. Paradigma Económico. 2(1):121-145. [ Links ]
SAGARPA-SIACON. 2006. Secretaría de Agricultura, Ganadería, Desarrollo Rural, Pesca y Alimentación-Servicio de Información Agroalimentaria y Pesquera. Situación actual y perspectivas del frijol en México 2000-2005. http://www.campomexicano.gob.mx/portal-siap/Integracion/EstadisticaDerivada/ComercioExterior/Estudios/Perspectivas/. [ Links ]
SAGARPA-SIAP. 2017. Servicio de Información Agroalimentaria y Pesquera. Secretaría de Agricultura Ganadería, Desarrollo Rural, Pesca y Alimentación. Anuario estadístico de la producción agrícola, año agrícola 2017. https://nube.siap.gob.mx/cierreagricola/. [ Links ]
SAGARPA-SIAP. 2019. Servicio de Información Agroalimentaria y Pesquera. Secretaría de Agricultura Ganadería, Desarrollo Rural, Pesca y Alimentación. Anuario estadístico de la producción agrícola, año agrícola 2015. https://nube.siap.gob.mx/cierreagricola/. [ Links ]
Soltero, D. L.; Pérez, D. J. F. y Valencia, B. A. J. 2010. Evaluación de herbicidas para el control de malezas en garbanzo (Cicer arietinum L.) de riego en la región Ciénaga de Chapala, México Revista Ciencias Técnicas Agropecuarias. 19(2):85-88. [ Links ]
Trapero, C. A. and Jiménez, D. R. M. 1985a. Fungal wilt and root trot diseases of chickpea in southern Spain. Phytopathology. 75(10):1146-1151. [ Links ]
Trapero, C. A. and Jiménez, D. R. M. 1985b. Etiología, importancia y distribución de la seca del garbanzo en el valle de Guadalquivir. Boletin de Sanidad Vegetal Plagas. 11(1):69-145. [ Links ]
USDA-FAS. 2013. GAIN report number BM1054. Burma grain and feed annual. Global Agricultural Information Network. https://www.fas.usda.gov/data/burma-grain-and-feed-annual-2. [ Links ]
Received: March 01, 2019; Accepted: June 01, 2019
 Este es un artículo publicado en acceso abierto bajo una licencia Creative Commons
