


Servicios Personalizados
Revista
Articulo
 texto en
  Inglés (pdf)
 Artículo en XML
 Referencias del artículo
 Enviar artículo por email
Indicadores
-
 Citado por SciELO
 -
 Accesos
Links relacionados
-
 Similares en
SciELO
Similares en
SciELO
Compartir

 Permalink
Revista mexicana de ciencias agrícolas
versión impresa ISSN 2007-0934
Rev. Mex. Cienc. Agríc vol.10 no.4 Texcoco may./jun. 2019 Epub 22-Mayo-2020
https://doi.org/10.29312/remexca.v10i4.1764
Articles
Physical-chemical characterization of soils cultivated with corn in Villaflores, Chiapas
1Campo Experimental Centro de Chiapas-INIFAP. Carretera Ocozocoautla-Cintalapa km 3, Ocozocoautla, Chiapas. AP. 1. CP. 29140. Tel. 01(800) 0882222.
2Centro Internacional de Mejoramiento de Maíz y Trigo (CIMMYT). Carretera México-Veracruz km 45, El Batán, Texcoco, México. CP. 56237. Tel. 01(55) 58042004 y 01(800) 4627247.
With the objective of designing a strategy to reverse the low productivity and profitability presented by the cultivation of corn in the municipality of Villaflores, the chemical and physical characteristics of the soils were studied in 236 mechanized plots distributed in 13 common and seven types of soils. The determinations were interpreted based on the Official Mexican Standard NOM-021-SEMARNAT-2000. The results indicate a generalized acidity in the soils, with an average pH of 5.2 (±0.9), 52% of the sites with pH less than 5; 208 cases showed interchangeable acidity in 64.4% of them, the value was higher than 0.5 meq 100 g-1, considered a critical limit for the plants. On average, organic matter (OM) was 1.7% (±1.3) and in no case did the content exceed 2.5%. The cation exchange capacity (CIC) was 11.4 (±16.8) meq 100 g-1, and influenced by pH (R2= 0.65), OM (R2= 0.32) and clay content (R2= 0.68). In 94% of sites with low OM, CIC is significantly dependent on clay content. Regarding the saturation percentage of the CIC, 59% of the cases are deficient in Ca, 18% in Mg and 58% in K. 40% of the sites are below the critical limit of 15 ppm of P. 90 and 46% of the cases presented deficiencies of Boron and Zinc. Under these conditions, the need for a strategy to increase the quality of the soil and the practices of agriculture can be sustainable.
Keywords: land; management; unsustainable
Con el objetivo de diseñar una estrategia para revertir la baja productividad y rentabilidad que presenta el cultivo de maíz en el municipio de Villaflores, se estudiaron las características químicas y físicas de los suelos en 236 parcelas mecanizables distribuidas en 13 ejidos y siete tipos de suelos. Las determinaciones se interpretaron tomando como base la Norma Oficial Mexicana NOM-021-SEMARNAT-2000. Los resultados indican una acidez generalizada en los suelos, con pH promedio de 5.2 (±0.9), 52% de los sitios con pH menores a 5; 208 casos presentaron acidez intercambiable en 64.4% de ellos, el valor fue mayor a 0.5 meq 100 g-1, considerado límite crítico para las plantas. En promedio la materia orgánica (MO) fue de 1.7% (±1.3) y en ningún caso el contenido superó a 2.5%. La capacidad de intercambio catiónica (CIC) fue 11.4 (±16.8) meq 100 g-1, e influenciada por el pH (R2= 0.65), MO (R2= 0.32) y contenido de arcilla (R2 =0.68). En 94% de los sitios con baja MO, la CIC depende significativamente del contenido de arcilla. En cuanto al porcentaje de saturación de la CIC, 59% de los casos son deficientes en Ca, 18% en Mg y 58% en K 40% de los sitios están por debajo del límite crítico de 15 ppm de P. El 90 y 46% de los casos presentó deficiencias de Boro y Zinc. Bajo estas condiciones se hace patente la necesidad de una estrategia que permita aumentar la calidad del suelo y las prácticas de agricultura puedan ser sostenibles.
Palabras claves: gestión; insostenible; tierra
Introduction
Chiapas is the Mexican state that devotes most of its territory to the cultivation of corn, making this grain the most important food product in the state. In 2016, this crop contributed 48% (684 463 ha) of the planted area and 26.5% of the production value ($4 710 295.00). The estimated average state yield was 1.9 t ha-1 (SIAP, 2018). Historically, the ‘Frailesca’ has been one of the most important maize producing regions in Chiapas, where about 61 203 ha of corn are cultivated and 181 542 t are produced, of which the municipality of Villaflores contributes 38% and 31% respectively.
Although the average yield of 2.4 t ha-1 is above the state average, they are largely supported by the high and increasing amounts of chemical fertilizers (especially nitrogen fertilizers) applied by producers, which are equivalent to 50% of the costs of production of one hectare. Despite the use of large quantities of agrochemicals, lower soil productivity has resulted in lower crop yield. As a result of high production costs, growing corn is no longer profitable for many small producers (Pulleman et al., 2008). Despite the evidence on the loss of soil fertility and its consequences, the magnitude and coverage that the problem could have in the whole area cultivated with corn is unknown.
In this context, INIFAP, in partnership with The Nature Conservancy and CIMMYT; through the MasAgro Program, joined efforts and resources to carry out in the municipality of Villaflores a physical-chemical characterization of the flat soils cultivated with corn, with the objective of obtaining elements to design an integral strategy that reverses the current unsustainable management of the land.
Materials and methods
The study was carried out in the year 2017 in the municipality of Villaflores and included 236 plots cultivated with maize in mechanizable flat lands (slope less than 15%), distributed in 13 common and seven types of soils, according to their importance in sown surface (Figure 1).

Figure 1 Spatial distribution of the 236 soil samples analyzed. Of the 236 samples analyzed, only 216 had information on soil types and were distributed as follows: 117 (54%) in Luvisol type soil, 36 (17%) in Cambisol, 23 (11%) in Vertisol, 16 (7.4%) in Acrisol, 13 (6%) in Planosol, 10 (5%) in Feozem and 1 (0.5%) in Fluvisol.
The study is considered representative because it included the localities and types of soils where the largest maize surface is cultivated in flat lands of the municipality of Villaflores. Due to the availability of resources, only samples composed of soils at a depth of 0 to 20 cm were taken, which were determined in the laboratory pH, P, K, Ca, Mg, Na, Fe, Cu, Zn, Mn, B , sand, silt, clay, Al, H and organic matter. Some determinations were not made in all the samples, a situation that was considered in the statistical analyzes performed. The interpretation of the properties of the soils was carried out in accordance with the provisions of the Official Mexican Standard NOM-021-SEMARNAT-2000 (DOF, 2002; IPNI, 1990).
Results and discussion
In the Table 1 presents a summary of the basic statistics of each of the variables analyzed. It is observed that the pH and the percentage of sand are the characteristics that presented less variability among the studied soils, with only 17 and 35% of variation coefficient (CV) respectively; on the other hand, K, Na, Ca, CIC, Mg, Al, H and saturation of Al showed a high variability among the studied sites with coefficients of variation above 100%.
Table 1 Basic statistics of soil characteristics.
| Determinations | Cases | Average | Minimum | Maximum | Stan Dev | CV (%) |
| pH | 196 | 5.2 | 3.6 | 8.1 | 0.9 | 17 |
| Organic material (%) | 236 | 1.7 | 0 | 9 | 1.3 | 79 |
| P Bray (ppm) | 129 | 26.1 | 0.8 | 94.3 | 22.8 | 87 |
| K (meq/100 g) | 236 | 0.4 | 0 | 3.6 | 0.4 | 110 |
| Ca (meq/100 g) | 236 | 8.5 | 0 | 83.1 | 15.5 | 182 |
| Mg (meq/100 g) | 236 | 1.6 | 0 | 13 | 1.9 | 121 |
| Na (meq/100 g) | 236 | 0.1 | 0 | 0.7 | 0.1 | 191 |
| Fe (ppm) | 109 | 66.5 | 7.1 | 153.2 | 32 | 48 |
| Cu (ppm) | 129 | 1 | 0 | 10.5 | 1.4 | 137 |
| Zn (ppm) | 129 | 1 | 0 | 5.1 | 0.9 | 91 |
| Mn (ppm) | 129 | 43.1 | 1 | 109.5 | 24.6 | 57 |
| B (ppm) | 80 | 0.4 | 0.1 | 1.2 | 0.2 | 55 |
| Sand (%) | 236 | 57 | 0.7 | 86 | 20 | 35 |
| Slime (%) | 236 | 22 | 1.7 | 76 | 14.4 | 66 |
| Clay (%) | 236 | 21 | 4.4 | 78.2 | 16.7 | 79 |
| Acidity exchange (meq/100g) | 236 | 0.8 | 0 | 4.2 | 0.8 | 91 |
| Al exchange (meq/100 g) | 147 | 0.5 | 0 | 2.6 | 0.5 | 105 |
| H Exchange (meq/100 g) | 147 | 0.3 | 0 | 1.2 | 0.3 | 114 |
| CIC (meq/100 g) | 236 | 11.4 | 0.1 | 85.9 | 16.8 | 147 |
| (%) Al saturation | 147 | 7.9 | 0 | 64.9 | 13.2 | 117 |
Soil acidity
The average pH value was 5.2 (±0.9) indicating the presence of a generalized acidity in the soils. In 64% (n= 125) of the cases, the pH was below 5.3, considered as suitable for the presence of Al+3 in the soil solution (Espinosa and Molina, 1999). The Vertisol soil stood out for presenting the highest average pH value with 6.2 (±1.5) and also the highest variability with a CV of 24.1% (Table 2).
Table 2 Statistics on pH (water 1:2) according to soil type.
| Concept | Tipo de suelo (N= 175) | |||||
| Luvisol | Vertisol | Cambisol | Acrisol | Planosol | Feozem | |
| Cases | 100 | 18 | 27 | 12 | 11 | 7 |
| Mean | 5.34 | 6.22 | 4.87 | 5.46 | 4.97 | 4.89 |
| Standard deviation | 0.74 | 1.5 | 0.4 | 0.78 | 0.5 | 0.27 |
| Maximum | 7.9 | 8.1 | 5.8 | 7.19 | 5.9 | 5.2 |
| Minimum | 3.63 | 4.2 | 4.3 | 4.2 | 4.1 | 4.5 |
| CV (%) | 13.84 | 24.11 | 8.13 | 14.24 | 10.02 | 5.47 |
According to the Official Mexican Standard NOM-021-SEMARNAT-2000, 47.4% of the sites are classified as strongly acidic and 44.4% as moderately acidic, that is, of the total of the analyzed samples, 92% (n= 180) present problems of acidity, and of these, 52% are strongly acidic with values less than 5. With the exception of Vertisol, in the other types of soils more than 90% of the analyzed sites were located in the strongly acid and moderately acidic categories. Acid soils are characterized by toxicity by Al+3, manganese toxicity and deficiency of Ca+2 or Mg+2 (Tasistro, 2012), particularly, the presence of aluminum (Al+3) in the soil solution occurs when the pH is less than 5.3 (Espinosa and Molina, 1999).
In 88% (n= 208) of the analyzed samples the presence of interchangeable acidity (AInt) was found, defined by Espinosa and Molina (1999) as the H and Al+3 that is retained in the soil colloids by electrostatic forces. The average was 0.96 meq 100 g-1 (±0.75) with a CV of 78% indicating high variability among the analyzed sites. The possible damages caused by the acidity to the plants were analyzed from the criteria of the AInt content in the soil and the (%) saturation of the CIC by the Al+3 (Table 3).
Table 3 Influence of acidity on crops.
| Criterion | Characteristic | Rank | Cases | (%) inside the range | |
| Total cases | Inside the range | ||||
| Interchangeable acidity (meq 100 g-1) | Problem for plants | >0.5 | 236 | 134 | 57 |
| Saturation Al+3 (%) | Desirable for most plants | ≤25 | 147 | 124 | 84 |
| Problem for plants | >5% | 147 | 81 | 55 | |
| Problem for corn cultivation | >25% | 147 | 23 | 16 | |
In 57% of the sites, the AInt is above 0.5 meq 100 g-1, considered the limit for the plants not to be affected (Espinosa and Molina, 1999). For the case of the (%) saturation of Al+3 in the CIC, three interpretation criteria are analyzed: the first one indicates that 84% of the sites present values below 25% considered desirable for most of the plants (Espinosa and Molina, 1999); the second, indicates that 55% of the sites present values above 5% considered problematic for the plants (Sánchez, 2014) and the third, indicates that only 16 of the sites present values above 25% considered problematic for the corn cultivation (Bertsch, 1998).
Organic material
In the 236 sites the average content of organic matter (OM) was 1.7% (±1.3) with a coefficient of variation of 79% indicating variability in the studied soils. Based on the fact that most of the studied area is adjacent to the Sierra Madre de Chiapas, originated by volcanic igneous rocks, the soils were considered of volcanic origin (DOF, 2016), 93% of the 215 analyzed sites were located in the category of very low OM content with values lower than 4%, in Cambisol, Acrisol, Planosol and Feozem soils 100% of the sites were located in this class.
Figure 1 shows that in any soil type the OM content was higher than 2.5% and with the exception of Vertisol and Fluvisol, in all soil types the average content was below 2%. In 59.3 of the sites the OM content was ≤1.5% considered a critical limit even for non-volcanic soils.

According to López et al. (2018), the very low OM content in soils is a factor closely related to the way in which the corn-livestock system practiced by 71% of producers has been worked for years. The practices of cultivation (burning, tillage and grazing of waste) and the non-incorporation of other source of OM, has generated an insufficient recycling of organic waste, which has brought as a consequence, a progressive deterioration of the soil that demonstrates an unsustainable management of the land, in virtue that OM is related to all aspects of soil, such as stability of the structure, ability to retain water, aeration, content and availability of nutrients, pH, cation exchange capacity (Benzing, 2001; Carter, 2002).
The cation exchange capacity (CIC)
The average value of the CIC in the 236 analyzed sites was 11.4 (±16.8) meq 100 g-1, with a high variability expressed by the CV of 147%. In all types of soils (with the exception of Vertisol), of the total analyzed sites more than 85% were placed in the low and very low content categories with values below 15 meq 100 g-1. In Vertisol only 48% of the cases were placed in these categories and the rest in the very high content class with values higher than 40 meq 100 g-1.
The fact that more than 85% of the analyzed samples show low CIC, indicates that the soils have limited capacity to retain cations (nutrients) due to their sandy texture and low content of organic matter; under these conditions, in addition to the limited capacity to store readily available K, Mg and Ca, these cations are unprotected against the leaching process (Benzing, 2001; Arcila and Farfán, 2010).
Figure 2 shows that 65% of the behavior of the CIC is explained by the acidity level of the soil; as the pH increases, new negative charges are generated in the exchange complex and is reported by Anzorena (1995); Benzing (2001), as variable CIC, which is more common in the CIC coming from the OM, than from the clays. Foth and Ellis (1996) point out that, in mineral soils with low organic matter content, the influence of pH on the CIC is minimal.

On the other hand, the OM explains 32% (R2= 0.3816) of the behavior of the CIC while (%) of clay 68% (R2= 0.684). Figure 3 shows the joint influence of these two variables on the CIC, the larger points represent greater value of the CIC and vice versa. It is observed that most of the soils are located in the lower left quadrant, in which the values of OM and (%) of clay are lower and, therefore, also have the lowest CIC values.
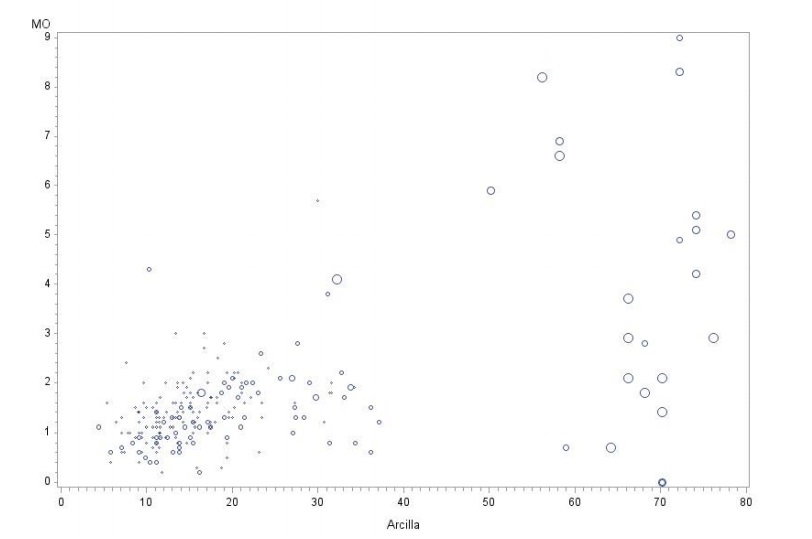
In the lower right quadrant, there are soils with high CIC value due to the higher clay content since their OM content is low. In the upper right quadrant, soils with high CIC are observed due to their higher OM and clay content. It highlights the fact that in the left upper quadrant practically no site was located due to the low OM content that most soils have. Based on the data shown in Table 4, the plots studied were grouped into 4 main subgroups.
Table 4 CIC statistics (meq 100 g-1) according to clay content and MO.
| OM | Data | Clay content (%) | Total | |||
| 0-15 | 15-25 | 25-35 | >35 | |||
| Very low (<4%) | Cases | 109 | 77 | 21 | 15 | 222 |
| Mean | 4.87 | 6.81 | 11.6 | 48.9 | ||
| Standard deviation | 2.82 | 6.22 | 7.23 | 26.1 | ||
| Low (4.1-6%) | Cases | 1 | 2 | 6 | 9 | |
| Mean | 10.8 | 34.7 | 48.8 | |||
| Standard deviation | 10 | |||||
| Mean (6.1-10.9%) | Cases | 5 | 5 | |||
| Mean | 56 | |||||
| Standard deviation | 26 | |||||
| Total | 110 | 77 | 23 | 26 | 236 | |
Subgroup 1: represents 46.2% (n= 109) of the analyzed sites. They contain very low contents of OM (<4%) and clay (<15%), in which the CIC average is 4.87 meq 100 g-1. They are the poorest soils cultivated with corn.
Subgroup 2: represents 33% (n= 77) of the analyzed sites. They contain very low OM contents (<4%) and clay between 15-25%, in which the CIC average is 6.81 meq 100 g-1. It is the second group of soils cultivated with corn.
Subgroup 3: represents 8.9% of the sites analyzed. They contain very low contents of OM (<4%) and clay between (25-35%), in which the CIC average is 11.63 meq 100 g-1.
Subgroup 4: represents 6.3% of the analyzed sites. They contain very low OM contents (<4%) and clay greater than 35%, in which the CIC average is 48.9 meq 100 g-1.
These four subgroups together represent 94% (222 of 236) of the analyzed sites that are characterized by having very low OM levels, in which the CIC depends significantly on the clay content they have. Increasing clay levels also increases the capacity of soils to store nutrients, for example, soils with more than 35% clay have on average a CIC 10 times higher compared to those with less than 15% clay.
Figure 4 shows that Vertisols contain the highest values of clay with an average of 43.8% (± 26.7%), therefore 60% of the cases that have the highest values of CIC (>40 meq 100 g-1) belong to this type of soil where only 14% of the corn area is located. According to Roy and Barde (1962), Vertisols have a high CIC due to the predominance of type 2:1 clay, for example, a soil with 50-60% clay has a CIC of 50-66 meq per 100 g of soil. According to these authors, the montmorillonite clay content gives an approximate estimate of CIC because 1 g of clay imparts on 0.5 to 0.7 meq of CIC to the soil and the contribution of organic matter to the CIC is quite low in the tropical zone (Roy and Barde, 1962).

On the other hand, the soils of the Luvisol and Cambisol groups that are the most representative of the maize areas, 34.5% contain on average 21.5% clay (±16.4%). In the rest of the soil units, the average content is below 20%.
The content of phosphorus (P)
The average content of the 129 sites analyzed was 26.1 ppm (±22.8), with a CV of 87.1%, that indicates high variability among the studied soils, so it is recommended in subsequent studies to map the areas according to their content. Figure 5 shows the values of P and its location with respect to the critical level of 15 ppm considered critical by NOM-021-SEMARNAT-2000 and IPNI (2017).

Only 40% of the cases could be expected response to the application of phosphate fertilizer because they have contents below the critical limit, 60% remaining presented medium and high levels of P.
The high variability in the phosphorus content found in the soils is due to the fact that of the total of the producers that fertilize the corn crop, only 43% apply phosphate fertilizers in doses ranging between 6 and 69 kg ha-1.
The basic cations (K, Ca, Mg, Na)
The content of these cations showed high variability in the soils analyzed with CV of 182, 110, 112 and 191% for Ca, K, Mg and Na, respectively (Table 1). Because only 17% (n= 40) of the analyzed sites found Na presence and that in 97 of the cases the (%) saturation of the CIC was less than 5% (considered optimal for the plants), this cation was excluded from the subsequent analyzes. According to the NOM-021-SEMARNAT-2000 criteria, 68, 58 and 58% of the analyzed sites were located in the low and very low content classes for Ca, Mg and K respectively.
a) The % saturation of Ca in the CIC
Table 5 shows a classification by type of soil according to the criteria indicated by the IPNI (1990) for 216 analyzed sites, in general 57.41% of the cases were deficient when presenting levels below 65% of saturation considered as optimal level.
Table 5 Classification according to (%) of Ca saturation in the CIC by soil type.
| Soil class | Total cases | Optimal 65-75% of Ca | Deficient <65% of Ca | High> >75% of Ca | |||||
| Cases | (%) | Cases | (%) | Cases | (%) | ||||
| Vertisol | 23 | 5 | 21.74 | 6 | 26.09 | 12 | 52.17 | ||
| Luvisol | 117 | 33 | 28.21 | 63 | 53.85 | 21 | 17.95 | ||
| Cambisol | 36 | 3 | 8.33 | 28 | 77.78 | 5 | 13.89 | ||
| Planosol | 13 | 2 | 15.38 | 9 | 69.23 | 2 | 15.38 | ||
| Feozem | 10 | 3 | 30 | 6 | 60 | 1 | 10 | ||
| Acrisol | 16 | 3 | 18.75 | 11 | 68.75 | 2 | 12.50 | ||
| Fluvisol | 1 | 0 | 0 | 1 | 100 | 0 | 0 | ||
| Total | 216 | 49 | 124 | 43 | |||||
| (%) | 100 | 22.69 | 57.41 | 19.91 | |||||
The Vertisol presented the lowest cases of deficiency in the (%) of saturation of Ca with only 26%, while in the rest they were above 54%, highlighting the Cambisol with 78%. In deficient soils it is necessary to apply amendments (cal) to raise the saturation (%) to its optimum level of 65% (Sánchez, 2014).
b) The % Mg saturation in the CIC
Of the 216 sites analyzed, 53% were located in the range of 10-20% of saturation considered optimal, 30% in high levels with values greater than 30% and only 17% were placed in the category of deficient with values lower than 10% (Table 6); Vertisol and Luvisol soils stand out in this last category. In all these deficient soils it is necessary to apply Mg amendments to raise the saturation (%) to its optimum level of 10%.
Table 6 Classification according to (%) of Mg saturation in the CIC by soil type.
| Types of soils | Total cases | Optimal 0-20% Mg | Deficient <10% Mg | High >20% Mg | |||||
| Casos | (%) | Casos | (%) | Casos | (%) | ||||
| Vertisol | 23 | 8 | 34.78 | 6 | 26.09 | 9 | 39.13 | ||
| Luvisol | 117 | 70 | 59.83 | 24 | 20.51 | 23 | 19.66 | ||
| Cambisol | 36 | 16 | 44.44 | 4 | 11.11 | 16 | 44.44 | ||
| Planosol | 13 | 7 | 53.85 | 1 | 7.69 | 5 | 38.46 | ||
| Feozem | 10 | 5 | 50 | 0 | 0 | 5 | 50 | ||
| Acrisol | 16 | 7 | 43.75 | 2 | 12.5 | 7 | 43.75 | ||
| Fluvisol | 1 | 1 | 100 | 0 | 0 | 0 | 0 | ||
| Total | 216 | 114 | 37 | 65 | |||||
| (%) | 100 | 52.78 | 17.13 | 30.09 | |||||
c) The (%) saturation of K in the CIC
In the case of this cation, 58% of the sites analyzed were in the deficient category with values below 5% saturation. Several studies have shown that K is an important element to increase grain yield and reduce corn stem lodging, its deficiency influences the magnitude of the photosynthetic rate and premature senescence of plants (Smith and White, 1988), as well as in the progressive deterioration of the three basal knots of the corn stem, and the consequent lodging of the plant (Liebhardth and Murdock, 1965; Kayode, 1986).
Although all soil types showed saturation deficiencies of the CIC by K, the highest frequency of sites was observed in Vertisol, Feozem, Planosol and Cambisol soils (Figure 6).

d) Cationic relations
Cationic relations are another criterion of support in the interpretation of soil analyzes, particularly among the bases (Chávez, 2012). Taking as a reference the general critical values suggested by Bertsch (1998), in 70, 34 and 29% of the cases optimal values were found in the Ca/Mg (2-6), Ca/K (10-15) and Ca+M /K (20-30) respectively. In the case of the relationships involving K, the lowest percentage of cases with optimal values is due to the fact that this cation presents low contents in 57% of the plots studied.
The micronutrients (B, Cu, Fe, Mn and Zn)
100 and 94.6% of the cases presented adequate levels of Iron and Copper respectively. Regarding Zinc, 46% were placed in the categories of deficient and marginal (Table 7).
Table 7 Classification of Cu, Zn and Fe content.
| Class | Cu | Zn | Fe | ||||||||
| Content (ppm) | Cases | (%) | Content (ppm) | Cases | (%) | Content (ppm) | Cases | (%) | |||
| Deficient | <0.2 | 7 | 5.43 | <0.5 | 34 | 26.36 | < 2.5 | 0 | 0 | ||
| Marginal | 0.5-1 | 25 | 19.38 | 2.5-4.5 | 0 | 0 | |||||
| Adequate | >0.2 | 122 | 94.57 | >1 | 70 | 54.26 | >4.5 | 109 | 100 | ||
| Total | 129 | 100 | 129 | 100 | 109 | 100 | |||||
The most poor micronutrient in soils cultivated with corn was Boron, since 90% of the cases analyzed (n= 80), were located within the categories of very low and low content (Table 8).
Table 8 Classification of the content of B.
| Class | Content (ppm) | Cases | (%) |
| Very low | <0.39 | 39 | 48.75 |
| Low | 0.39-0.79 | 33 | 41.25 |
| Medium | 0.8-1.29 | 8 | 10 |
| High | 1.30-2.1 | 0 | 0 |
| Total | 80 | 100 |
The deficiency of B in the soils may be due to coarse texture, poor organic matter, its formation on igneous rocks and leaching by rain, especially in acid and coarse-textured soils (Violic, 2001).
Analysis by soil type
Figure 6 clearly shows that the plots located in soils of the Vertisol class have the best fertility conditions, since they have higher values of pH, OM, clay and CIC; however, in this type of soil only 14% of the maize area is sown. Due to its capacity to store nutrients (CIC) and clay content, it is followed by Luvisol type soils, in which an estimated 34.5% of the area cultivated with corn is located.

In the rest of the types of soils (Cambisol, Acrisol, Planosol and Feozem) that represent 51.1% of the area cultivated with corn, the situation is critical in terms of its productive capacity, due to the low levels of CIC, OM and clay.
Conclusions
The soils cultivated with corn show a low fertility evidenced by its generalized acidity and low OM content. In 94% of the sites due to their low OM content, the nutrient storage capacity (CIC) depends significantly on the clay content. In 79% of plots that have less than 25% clay and higher OM content, CIC is also influenced by soil pH.
The plots located in soils of the Vertisol class show the best fertility conditions, since they present higher values of pH, CIC, OM and clay; however, in this soil unit only 14% of the maize area is sown.
In 59, 18 and 58% of the cases Ca, Mg and K treatments are required, respectively, to raise their percentage of participation in the CIC to optimum levels. In 40% of the sites are below the critical limit of 15 ppm of P, which would respond to the application of phosphate fertilizers.
The most deficient micronutrients were Boron and Zinc in 90% and 46% of the cases analyzed, attributed to the low content of OM, their formation on igneous rocks and leaching by rain, especially in acid and coarse-textured soils.
Although the results are presented by type of soil, it is recommended that the data from this study serve as inputs to perform a zoning of critical elements and initiate studies to reverse the problem.
Acknowledgments
The authors are grateful for the generous support of the International Maize and Wheat Improvement Center through the MasAgro Program, to carry out this study and publish its results.
REFERENCES
Anzorena M. N. 1995. El suelo en la agricultura y el medio ambiente. Fertilidad del suelo: acidez y complejo de cambio. Rev. Sustrai. 36(1):40-44. [ Links ]
Arcila P. J. y Farfán, V. F. 2010. Consideraciones sobre la nutrición mineral y orgánica en la producción de la finca. En sistema de producción de café en Colombia. 9:202-232. [ Links ]
Benzing, A. 2001. Agricultura orgánica. Fundamentos para la región Andina. Neckar-Verlag, Villingen-Schwenningen, Alemania. 682 p. [ Links ]
Bertsch, F. 1998. Potasio, calcio y magnesio en el sistema suelo-café. Curso regional sobre nutrición mineral del café. San José Costa Rica. Programa Cooperativo para la Producción y Modernización de la Cafeticultura (PROMECAFE). 83-88 pp. [ Links ]
Carter, M. R. 2002. Soil quality for sustainable land. Agron. J. 94:1:38-47. [ Links ]
Chávez, S. M. 2012. Relaciones catiónicas y su importancia para la agricultura. Rev. Ventana Lechera. 18:11-20. [ Links ]
DOF. 2002. Norma Oficial Mexicana NOM-021-SEMARNAT-2000. Especificaciones de fertilidad, salinidad y clasificación de suelos. Estudios, muestreo y análisis. Diario Oficial de la Federación. http://dof.gob.mx/nota-detalle.php?codigo=717582&. [ Links ]
DOF. 2016. Resultado de los estudios técnicos de aguas nacionales subterráneas del acuífero Frailesca, clave 0706, en el estado de Chiapas, región hidrológico-administrativa Frontera sur. Diario Oficial de la Federación. http://www.dof.gob.mx/nota-detalle.php? codigo=5434780&. [ Links ]
Espinosa, J. y Molina, E. 1999. La acidez y encalado de suelos. International Plant Nutrition Institute. Quito, Ecuador. 42 p. [ Links ]
Foth, D. N. and Ellis, B. G. 1996. Soil fertility. Second (Ed.). CRC Press LLC. 282 p. [ Links ]
IPNI. 1990. Manual de fertilidad de suelo: porcentaje de saturación de bases intercambiables. The postash and phosphate institute. 12 p. [ Links ]
Kayode, G. D. 1986. Further studies on the response of maize to K fertil- izer in the tropics. J. Agric. Sci., Camb. 107:141-147. [ Links ]
López, B. W.; Reynoso, S. R.; López, M. J.; Camas, G. R. y Tasistro, A. 2018. Diagnóstico de la compactación en suelos cultivados con maíz en la región Frailesca, Chiapas. Rev. Mex. Cienc. Agríc. 9(1):65-79. [ Links ]
Pulleman, M.; Hellin, J.; Flores, V. D. y López, B. W. 2008. Calidad del suelo y rentabilidad de la finca: una situación en la que todos ganan. Leisa Magazine. 24(2):6-8. [ Links ]
Roy, B. B. and Barde, N. K. 1962. Some characteristics of the black soils of India. Soil Sci. 93:142-147. [ Links ]
Sánchez, G. P. 2014. Nutrición de zarzamora. Colegio de Postgraduados en Ciencias Agrícolas. Montecillos, Estado de México. 37 p. [ Links ]
SIAP. 2018. Servicio de Información Agroalimentaria y Pesquera. Producción agrícola. https://www.gob.mx/siap/. [ Links ]
Smith, D. R. and White, D. G. 1988. Diseases of corn. In: Sprague, G. F. and Dudley, J. W. (Eds.). Corn and corn improvement. ASA-CSSA-SSSA. Agronomy Monograph No. 18 Third Edition. Madison, Wi. USA. 687-766 pp. [ Links ]
Tasitro, A. 2012. La acidez de los suelos. Instituto Internacional de Nutrición Vegetal (IPNI). Notas de conferencia. 108 p. [ Links ]
Van, N.; López, B. W.; Zamarripa, M. A.; Cadena, I. P.; Villar, S. B. y De la Piedra, C. R. 1992. Uso y conservación de los recursos naturales en la Frailesca, Chiapas, México. Documento de trabajo. Colaboración INIFAP-CIMMYT en el manejo de los recursos naturales. Centro Internacional de Maíz y Trigo (CIMMYT). El Batán, Texcoco Estado de México. 47 p. [ Links ]
Violic, A. D. 2001. Manejo integrado del cultivo. En el maíz en los trópicos: mejoramiento y producción. FAO. Roma. http://www.fao.org/docrep/003/X7650S/x7650s00.htm#toc. [ Links ]
Received: April 01, 2019; Accepted: June 01, 2019
 Este es un artículo publicado en acceso abierto bajo una licencia
Creative Commons
Este es un artículo publicado en acceso abierto bajo una licencia
Creative Commons
