


Servicios Personalizados
Revista
Articulo
 texto en
  Inglés (pdf)
 Artículo en XML
 Referencias del artículo
 Enviar artículo por email
Indicadores
-
 Citado por SciELO
 -
 Accesos
Links relacionados
-
 Similares en
SciELO
Similares en
SciELO
Compartir

 Permalink
Revista mexicana de ciencias agrícolas
versión impresa ISSN 2007-0934
Rev. Mex. Cienc. Agríc vol.10 no.1 Texcoco ene./feb. 2019
https://doi.org/10.29312/remexca.v10i1.465
Articles
Intensity of color and bioactive compounds in collections of guajillo chili from Northern Mexico
1Universidad Autónoma Chapingo. Carretera México-Texcoco km 38.5, Chapingo, Estado de México, México. CP. 56230. Tel. 01(595) 9521500, ext. 6313. (teremd13@gmail.com; esau@correo.chapingo.mx; svalle77g@gmail.com).
2Universidad Autónoma de Chihuahua. Av. Pascual Orozco s/n, Santo Niño, Campus 1. Chihuahua, Chihuahua, México. CP. 31350. Tel. 01(614) 2382000, ext. 3100.
In this research, color, content of bioactive compounds and antioxidant capacity were analyzed in collections of guajillo chili native from Durango and Zacatecas, Mexico. The experimental design was completely randomized with four repetitions. The study was carried out at the Autonomous University Chapingo, Texcoco, State of Mexico. The variables evaluated were color, vitamin C (VC), total anthocyanins (AT), total phenols (FT), as well as antioxidant capacity (CA). No significant variation was found for brightness and color chromaticity; however, the °hue was lower in collection 25 (33.77°). With respect to the content of bioactive compounds, collections 19 and 25 stand out for their high content of VC (200.02 and 196.19 mg ascorbic acid100 g-1 ps, respectively). The 96.6% of the collections (29/30) showed similar values of AT and FT, whose values were between 1 and 1.97 mg cyanidin-3-glucoside 100 g-1 as well as from 72.00 to 129.54 mg gallic acid 100 g-1 ps, respectively. Additionally, the CA in 26/30 of the collections showed values between 4 991 and 10 607 mol eq Trolox g-1; however, they were greater than collections 8, 20, 21 and 28 (3 068, 3 063, 2 559 and 2 054 μmol eq Trolox g-1, respectively). On the other hand, the greater variability between collections was due to the concentration of VC, AT and FT, in addition to showing a positive linear correlation with CA, which represents an opportunity for genetic selection and breeding.
Keywords: Capsicum annuum L.; fruit quality; multivariate methods; native genotypes
En esta investigación se analizó el color, contenido de compuestos bioactivos y la capacidad antioxidante en colectas de chile guajillo nativas de Durango y Zacatecas, México. El diseño experimental fue completamente al azar con cuatro repeticiones. El estudio se llevó a cabo en la Universidad Autónoma Chapingo, Texcoco, Estado de México. Las variables evaluadas fueron el color, vitamina C (VC), antocianinas totales (AT), fenoles totales (FT), así como la capacidad antioxidante (CA). No se encontró variación significativa para brillantez y cromaticidad de color; sin embargo, el °hue fue menor en la colecta 25 (33.77°). Con respecto al contenido de compuestos bioactivos, se destacan las colectas 19 y 25 por su alto contenido de VC (200.02 y 196.19 mg ácido ascórbico100 g-1 ps, respectivamente). El 96.6% de las colectas (29/30) mostraron valores similares de AT y FT, cuyos valores estuvieron entre 1 y 1.97 mg cianidina-3-glucosido 100 g-1 así como de 72.00 a 129.54 mg acido gálico 100 g-1 ps, respectivamente. Adicionalmente, la CA en 26/30 de las colectas mostraron valores entre 4 991 y 10 607 mol eq Trolox g-1; sin embargo, fueron mayores a las colectas 8, 20, 21 y 28 (3 068, 3 063, 2 559 y 2 054 mol eq Trolox g-1, respectivamente). Por otro lado, la mayor variabilidad entre colectas fue producto de la concentración de VC, AT y FT, además de mostrar una correlación lineal positiva con la CA, lo que representa una oportunidad para la selección y mejoramiento genético.
Palabras clave: Capsicum annuum L.; calidad de fruto; genotipos nativos; métodos multivariados
Introduction
Chili or chile (Capsicum spp.), as well as corn (Zea mays L.), pumpkin (Cucurbita spp.), beans (Phaseolus vulgaris L.), cocoa (Theobroma cacao L.), avocado (Persea americana Mill. ) and tomato (Solanum lycopersicum L.), its consumption has a millenary tradition that dates back to pre-hispanic times and is a fundamental part in the generation of an enormous gastronomic diversity (Vera-Guzmán et al., 2011; 2012; Chávez-Servia et al., 2016) and among the domesticated species, C. annuum has the greatest morphological variation (Moreno-Pérez et al., 2011).
There is a great diversity of types of chili types within C. annuum, and its use, in most cases, is as a fresh product; however, it is also common to find it dehydrated and the guajillo chili (mirasol) is one of them, which is used as the main ingredient for the preparation of marinades, moles and sauces in different regions of Mexico (Cruz-Crespo et al., 2015; Toledo-Aguilar et al., 2016), as well as in the extraction of natural dyes (Moreno-Pérez et al., 2006). According to Aguilar y Esparza (2010), 83.7% of the total production of this type of chili is found in Chihuahua, Durango, San Luis Potosí and Zacatecas, however, there is no precise information.
Currently, there is an increase in the suffering of neurodegenerative diseases, cardiovascular and some types of cancer, as a result of the intake of foods with high caloric content and low nutritional value (Tangkanakul et al., 2009; Hernández-Ortega et al., 2012), which is why the production and consumption of foods that have one or several characteristics related to their constitution or function in the prevention of some disease is sought (Hernández-Ortega et al., 2012).
In this sense, the intake of guajillo chili (Capsicum annuum L.), has allowed to incorporate into the daily diet various bioactive compounds such as anthocyanins, ascorbic acid, phenolic compounds, carotenoids (α and β-carotene), capsaicinoids (capsaicin, nordihydrocapsaicin and dihydrocapsaicin) and vitamin E (α-tocopherol) (Hervert-Hernández et al., 2010; Hernández-Ortega et al., 2012; Toledo-Aguilar et al., 2016; Ramírez et al., 2018), which implies ability to inhibit, delay or significantly reduce the activity of reactive oxygen species (superoxide radical anion, hydrogen peroxide and hydroxyl ion, among others) (Rodríguez et al., 2017), which are one of the main causes that are attributed to the development of diseases (Kantar et al., 2016).
The existence of diverse studies, where the synthesis and concentration of bioactive compounds in the fruit of chili is approached from diverse perspectives (Hernández-Ortega et al., 2012; Toledo-Aguilar et al., 2016), suggest the importance of this culture from the nutritional point of view and health care (Figueroa et al., 2015), however, in Mexico there is a huge genetic and phenotypic variability of this species (Moreno-Pérez et al., 2011), which makes fundamental the initial physical-chemical evaluation of specific materials of chili present in a native way in diverse regions of our country, with the purpose of detecting those that are susceptible of being used as a base for genetic improvement and the obtaining of improved varieties (Vera-Guzmán et al., 2011; Ramírez et al., 2018), where not only agronomic aspects are included, but also parameters of functional quality are considered. The objective of this research was to analyze the color, content of some bioactive compounds and antioxidant capacity in collections of guajillo chili native from Durango and Zacatecas, Mexico
Materials and methods
Plant material and location of the experiment
In the course of the months from September to October 2014, a tour of some localities of Durango and Zacatecas was made, and samples of guajillo chili (mirasol) fruits were collected with uniform epidermis color, absence of burns and mechanical damage. Likewise, its geographical location was registered by means of a global positioning system (GPS) (Table 1). 30 guajillo chili materials were collected (natural drying at 32 °C), which according to the collection number (1-17, 19-26, 28-30) were native genotypes and where 18 and 27 were the commercial varieties ‘Castilla’ and ‘Minero’, respectively. Physicochemical quality analyzes were carried out in the laboratories of fruit physiology and multiple uses, located in the Department of Plant Breeding of the Autonomous University Chapingo, State of Mexico, Mexico (19° 29’ 43” North latitude and 98° 53’ 12” West longitude, at an altitude of 2 240 m with an average temperature of 15.9 °C.
Table 1 Origin of the collected samples of guajillo chili fruits (Capsicum annuum L.), analyzed in this study.
| Collection number | Location | North Latitude | West longitude | Altitude (m) |
| 1 | La Joya, Poanas, Durango | 23° 50' 20.9'' | 104° 00' 36.4'' | 1 838 |
| 2 | El tobe, Nombre de Dios, Durango | 23° 48' 00.2'' | 104° 02' 35.1'' | 1 804 |
| 3 | Vicente Guerrero, Durango | 23° 48' 00.2'' | 104° 02' 35.5'' | 1 795 |
| 4 | La Joya, Poanas, Durango | 23° 53' 0.45'' | 103° 54' 47.6'' | 1 820 |
| 5 | La Joya, Poanas, Durango | 23° 53' 0.15'' | 103° 59' 24.6'' | 1 880 |
| 6 | Vicente Guerrero, Durango | 23° 47' 58.6'' | 103° 58' 31.2'' | 1 871 |
| 7 | Nombre de Dios, Durango | 23° 47' 19.5'' | 104° 00' 00.8'' | 1 840 |
| 8 | Vicente Guerrero, Durango | 23° 43' 31.3'' | 104° 00' 32.1'' | 1 8 00 |
| 9 | Nombre de Dios, Durango | 23° 43' 27.7'' | 104° 00' 24.7'' | 1 802 |
| 10 | Nombre de Dios, Durango | 23° 47' 35.2'' | 104° 06' 0.50'' | 1 807 |
| 11 | Nombre de Dios, Durango | 23° 47' 32.1'' | 104° 06' 11.2'' | 1 812 |
| 12 | Vicente Guerrero, Durango | 23° 39' 09.0'' | 104° 01' 12.3'' | 1 918 |
| 13 | Vicente Guerrero, Durango | 23° 39' 03.3'' | 104° 00' 59.4'' | 1 921 |
| 14 | Vicente Guerrero, Durango | 23° 39' 24.5'' | 104° 01' 15.8'' | 1 916 |
| 15 | El Pardillo, Fresnillo, Zacatecas | 23° 47' 19.5'' | 104° 00' 00.8'' | 1 983 |
| 16 | El Pardillo Segundo, Fresnillo, Zacatecas | 23° 08' 43.4'' | 102° 40' 58.9'' | 1 983 |
| 17 | El Pardillo Segundo, Fresnillo, Zacatecas | 23° 08' 38.6'' | 102° 40' 21.6'' | 1 981 |
| 18 | Bañon, Fresnillo, Zacatecas | 23° 12' 38.6'' | 102° 25' 13.2'' | 1 928 |
| 19 | Bañon, Fresnillo, Zacatecas | 23° 12' 38.6'' | 102° 25' 13.0'' | 1 928 |
| 20 | Bañon, Fresnillo, Zacatecas | 23° 12' 38.8'' | 102° 25' 13.4'' | 1 932 |
| 21 | Santiaguito, Fresnillo, Zacatecas | 23° 06' 20.4'' | 102° 28' 37.0'' | 2 028 |
| 22 | Potrero de Ojuelos, Fresnillo, Zacatecas | 23° 06' 20.4'' | 102° 38' 37.4'' | 2 039 |
| 23 | El Pardillo Segundo, Fresnillo, Zacatecas | 23° 08' 37.3'' | 102° 40' 42.0'' | 1 996 |
| 24 | Las Auras, Calera, Zacatecas | 23° 04' 29.6'' | 102° 38' 35.4'' | 2 005 |
| 25 | Las Auras, Calera, Zacatecas | 23° 05' 02.9'' | 102° 38' 28.8'' | 2 014 |
| 26 | Las Auras, Calera, Zacatecas | 23° 02' 01.4'' | 102° 38' 55.4'' | 2 029 |
| 27 | Calera, Zacatecas | 23° 02' 01.4'' | 102° 38' 55.4'' | 2 131 |
| 28 | Calera, Zacatecas | 23° 56' 27.6'' | 102° 44' 26.3'' | 2 145 |
| 29 | Rio Frio, Zacatecas | 23° 56' 27.9'' | 102° 44' 26.4'' | 2 155 |
| 30 | Rio Frío, Zacatecas | 23° 56' 27.9'' | 102° 44' 26.4'' | 2 155 |
Experimental design
A completely randomized experimental design with 4 replications was used, where for the evaluation of fruit color and vitamin C (ascorbic acid), the experimental unit consisted of a set of 15 fruits. On the other hand, with 20 fruits per experimental unit the content of total anthocyanins, total phenols, as well as the antioxidant capacity were determined.
Parameters evaluated
Colour. It was determined on the epidermis of the fruit, by means of a Color Tec-PCM® portable colorimeter (Cole Palmer, Illinois, USA), in which the Cielab color coordinates (CIE 1976 (L*a*b)). were obtained. Subsequently the chromaticity values = (a2+b2)1/2 and tonality or °hue= arctan-1 (b/a) were calculated.
Vitamin C (ascorbic acid). It was estimated according to the method proposed by Jagota and Dani (1982), for this, 4 g of tissue were taken and homogenized with 5 mL of 20% trichloroacetic acid, the mixture was left to rest for 5 min in cold (ice) and centrifuged at 15 000 rpm for 20 min at 4 °C. An aliquot of 0.2 mL of the supernatant was taken and 1.8 mL of distilled water and 0.2 mL of 10% Folin-Ciocalteu were added. The mixture was stirred vigorously and allowed to stand for 10 min to subsequently perform the absorbance reading at 760 nm, using a Genesys™ 10S UV-Vis spectrophotometer (Thermo Fisher Scientific, Florida, USA). The calculation of the concentration of this compound was made based on a standard curve of ascorbic acid and the results were expressed mg ascorbic acid 100 g-1 dry weight (ps).
Total anthocyanins. Its evaluation was carried out according to the method proposed by Craker (1971), which consisted of taking 0.5 g of tissue and grinding in mortar with 1% methanol-HCl and then filtering on Whatman® paper with GF6 grade and recording the reading of absorbance at 525 nm with the Genesys ™ 10S UV-Vis refractometer (Thermo Fisher Scientific, Florida, USA). The results were calculated with the expression.
Where: A= is the absorbance at 525 nm, PM corresponds to the molecular weight of the cyanidin-3-glucoside (449.2); FD= is the dilution factor; ε= is the molar absorptivity for cyanidin-3 glycoside (26 900); L= is the optical path of the cuvette (10 mm).
Total phenols. The quantification of these compounds was carried out with the method proposed by Litwack (1967), with some modifications: 1 g of tissue was taken and homogenized with 25 mL of distilled water, from which a 2 mL aliquot was taken that 0.4 mL of extractant solution composed of methanol, chloroform and water (2:1:1) was added and centrifuged for 15 min at 11 400 rpm. To the supernatant was added 10 mL of Na2CO3 (10%), to be maintained at 38 °C for 15 min. Subsequently, 1 mL of this solution was taken and the Folin-Ciocalteu reagent (1 mL) was added, allowing it to stand for 15 min in conditions of complete darkness and the absorbance reading was taken at 660 nm using the UV-Vis spectrophotometer. Genesys™ 10S (Thermo Fisher Scientific, Florida, USA). The concentration data were obtained by reference to a standard curve of gallic acid. The results were expressed in mg gallic acid 100 g-1 ps.
Antioxidant capacity. The determination of this variable was carried out with the N, N-dimethyl-p-phenyl-N-diamine dihydrochloride (DMPD) method modified by Fogliano et al. (1999). The method consisted of preparing a solution of DMPD (209 mg of this compound dissolved in 10 mL of distilled water), from which 1 mL was taken and 100 mL of a 0.1 M acetate buffer solution (pH 5.25) was added. To this solution was added 0.2 mL of 0.05 M ferric chloride, with a final concentration of 0.1 mM. The absorbance reading was recorded at a wavelength of 505 nm (UV-Vis Genesys™ 10S (Thermo Fisher Scientific, Florida, USA)), which corresponds to the uninhibited signal (Ao). Likewise, a standard antioxidant curve of Trolox was constructed for which it was necessary to dilute various concentrations of this compound (obtained from a solution of Trolox in methanol at a concentration of 1 mg mL), to which 0.2 mL of extract was added. The mixture was stirred for 10 min and the absorbance reading at 505 nm (Af) was recorded. The results were expressed as a percentage of the solution of the uninhibited radical cation and for its calculation the expression was used.
Where: Ao= is the absorbance of the non-inhibited radical cation; Af= corresponds to the absorbance value recorded 10 min after adding the standard solution of Trolox or the sample of the juice extract.
Statistical analysis of the data. The data obtained were analyzed by variance of simple classification (Anova) and multiple comparison of means with the Tukey test (p≤ 0.05). In addition, with the idea of grouping the different collections with similar characteristics, a multivariate analysis was carried out with which a grouping was made based on the statistical square distances (standardized data) and a dendrogram was constructed with the minimum variance method Ward (Dallas, 2000) and in all cases the statistical analysis package SAS® version 9.0. (SAS Institute, 2002) was used.
Results and discussion
Colour
One of the parameters of quality with greater practical utility in fruits and vegetables, constitutes the color, which undergoes relatively few alterations in dehydrated (dry) fruits during storage (Pérez-López et al., 2010) and the changes that have occurred are consequence of the variation in the concentration of some natural pigments (anthocyanins and carotenoids) or in the worst case, caused by reactions of enzymatic obscuration (Moreno-Pérez et al., 2006; Agostini-Costa et al., 2017).
In this work, no significant variation was found (p≤ 0.05) in relation to the luminosity and chromaticity of the color, whose values fluctuated from 12.47 to 21.58 and between 24.96 to 41.96, respectively (Table 2). With respect to these results, several authors have indicated that the characteristic color of the chili fruit is highly correlated with the synthesis and accumulation of carotenoids (β-carotene, xanthophylls, β-cryptoxanthin, zeaxanthin, violaxanthin and capsanthin) (Hernández-Ortega et al., 2012; Figueroa et al., 2015; Agostini-Costa et al., 2017), where their concentration is strongly influenced by the intensity or absence of various crop management practices (irrigation, use of plastic covers in the soil, sources of fertilization, among others) (López-Pérez et al., 2007; Chávez-Servia et al., 2016), without counting whether the type of drying is natural or artificial (Rochin-Wong et al., 2013).
Table 2 Mean values related to the components of color and content of vitamin C, evaluated in collections of guajillo chili (Capsicum annuum L.) native of Durango and Zacatecas, Mexico.
| Collection number | Colour | VC (mg ascorbic acid 100 g-1 ps) | ||
| Brilliance (L) | Chromaticity (color purity) | Tonality (°hue) | ||
| 1 | 16.35 a* | 29.13 a | 39.42 ab | 169.93 a-c |
| 2 | 16.85 a | 33.1 a | 88.96 ab | 123.3 bc |
| 3 | 15.52 a | 33.42 a | 53.58 ab | 146.31 a-c |
| 4 | 16.86 a | 30.88 a | 45.84 ab | 115.62 c |
| 5 | 19.18a | 40.98 a | 64.13 ab | 127.13 bc |
| 6 | 15.37 a | 24.96 a | 120.46 ab | 150.15 a-c |
| 7 | 16.15a | 34.18 a | 71.78 ab | 157.82 a-c |
| 8 | 16.42 a | 41.65 a | 98.59 ab | 138.64 a-c |
| 9 | 17.87 a | 30.65 a | 81.58 ab | 161.66 a-c |
| 10 | 18.8 a | 30.51 a | 55.74 ab | 123.3 bc |
| 11 | 17.68 a | 26.35 a | 62.16 ab | 138.64 a-c |
| 12 | 16.81 a | 32.09 a | 105.91 ab | 150.15 a-c |
| 13 | 18.78 a | 25.38 a | 129.04 ab | 150.15 a-c |
| 14 | 16.46 a | 31.66 a | 58.94 ab | 157.82 a-c |
| 15 | 14.44 a | 26.9 a | 60.73 ab | 146.31 a-c |
| 16 | 17.01 a | 32 a | 127.88 ab | 177.01 a-c |
| 17 | 18.51 a | 35.81 a | 67.45 ab | 169.33 a-c |
| 18 | 17.01 a | 42.82 a | 49.52 ab | 123.3 bc |
| 19 | 17.88 a | 38.05 a | 173.05 a | 200.02 a |
| 20 | 16.36 a | 35.97 a | 54.01 ab | 184.68 ab |
| 21 | 14.06 a | 26.6 a | 75.97 ab | 173.17 a-c |
| 22 | 12.47 a | 40.71 a | 67.08 ab | 169.33 a-c |
| 23 | 15.59 a | 41.87 a | 52.08 ab | 127.13 bc |
| 24 | 21.58 a | 25.34 a | 74.6 ab | 169.33 a-c |
| 25 | 15.99 a | 29.6 a | 33.77 b | 196.19 a |
| 26 | 15.4 a | 34.76 a | 79.32 ab | 150.15 a-c |
| 27 | 17.26 a | 35.34 a | 90.45 ab | 157.82 a-c |
| 28 | 15.05 a | 31.4 a | 98.58 ab | 138.64 a-c |
| 29 | 18.24 a | 36.79 a | 68.77 ab | 119.46 c |
| 30 | 14.36 a | 35.56 a | 103.14 ab | 115.62 c |
| DMSH | 8.94 | 32.54 | 135.21 | 64.77 |
VC= vitamin C; *= values with the same letter inside columns, are equal according to the Tukey test (p≤ 0.05); DMSH= honest significant minimum difference.
On the other hand, the °hue was statistically similar for 96.6% of the collections (29/30), in which the commercial varieties ‘Castilla’ and ‘Minero’ were included, with values that fluctuated between 39.42 and 173.05°, in which highlights the 19 native collection of Bañon, Fresnillo, Zacatecas with the maximum value for this variable, which showed fruits with intense red color and statistically exceeded collection 25 (Las Auras, Calera, Zacatecas) with 33.77°, being the latter, which presented the fruits with less hue (Table 2).
Among the quality parameters considered of paramount importance for the various types of dehydrated (dried) whole chilis (guajillo or mirasol, ancho, mulato, de arbol, puya and pasilla) is associated with color, for this the Official Mexican Standard 107 (NMX-FF-107/1-SCFI-2006) (Anónimo, 2006) states that values between 47.33 and 56.96° indicate the presence of fruits with an intense red or dark uniform epidermis, that is, without presenting discoloration problems, burns and scrapes, which can largely be caused by abiotic factors (excessive solar radiation, nutritional deficiencies and inadequate harvest index) and biotic (attack by pests and diseases) (Moreno-Pérez et al., 2011).
In this study, with the exception of collections 1 and 4 (La Joya, Poanas, Durango) and 25 (Las Auras, Calera, Zacatecas), the rest of the collections, including commercial varieties, satisfactorily comply with this quality index. important for producers and marketers of this product, since their values fluctuated between 49.52 and 173.05°. On the other hand, Hérnandez-Ortega et al. (2012); Rochin-Wong et al. (2013), point out that during the storage period there is a variation in the content of carotenoid pigments present in the shell, due to an oxidation process, which is increased by the action of external factors of a physical nature, such as temperature, humidity and luminosity levels or also of a chemical nature, with the presence of metal ions, enzyme peroxidase and free oxygen (oxidants) (Pérez-López et al., 2007; Chavez-Servia et al., 2016).
Vitamin C (ascorbic acid)
Among the nutritional components of the guajillo chili, it is linked to its content of vitamin C (ascorbic acid), which presents variations along the growth and development of the fruit, however, in physiological maturity (maximum accumulation of biomass) it is reported that it has between 150 and 180 mg ascorbic acid 100 g-1 (Kantar et al., 2016; Agostini-Costa et al., 2017). The collections analyzed showed significant variation with respect to the content of ascorbic acid, in which collections 19 (Bañon, Fresnillo, Zacatecas) and 25 (Las Auras, Calera, Zacatecas) were unleashed with values of 200.02 and 196.19 mg ascorbic acid 100 g-1, which exceeded that observed in the fruits of collections 2, 4, 5, 10, 17, 23, 29 and 30 whose values ranged between 115.62 and 127.62 mg ascorbic acid 100 g-1 (Table 2).
In contrast, Figueroa et al. (2015) indicate for different varieties of bell chili (Capsicum annuum L.) values that fluctuate between 274.3 and 355.5 mg ascorbic acid 100 g-1. On the other hand, Cruz-Crespo et al. (2015) indicate a maximum value of 41.19 mg 100 g-1, for the variety ‘Tampiqueño’ of serrano chili (Capsicum annuum L.) cultivated with different concentration of nutrients and proportions of substrate (volcanic rock and vermicompost) Additionally, Cruz et al. (2007) in Manzano chili (Capsicum pubescens L.) mention a content between 455 and 238 mg ascorbic acid 100 g-1, the variation between the findings of this work and that of other authors, may be associated with a variety of factors, among them, the degree of maturity at harvest, because fruits where the green color prevails, generally contain a higher concentration of ascorbic acid in relation to those of color yellow and red (Hervert-Hérnandez et al., 2010), climatic conditions (radiation, temperature and relative humidity) prevailing in pre-harvest, cultural practices of agronomic management (Agostini-Costa et al., 2017), conditions of post-harvest management has during the storage period (the water content decreases between 5 and 12%, which leads to the loss and degradation of between 10 and 50% of ascorbic acid) (Kantar et al., 2016) and if in the analytical methodology used was used in fresh or dehydrated tissue (Rochin-Wong et al., 2013).
Total anthocyanins
The guajillo chili fruit has a considerable content of polyphenolic compounds (secondary metabolites), which may include several functional groups, such as flavonoids (Arnnok et al., 2012) and among the most important subgroups of this functional group are find anthocyanins (Kantar et al., 2016), which is attributed to the presence of the typical red color in fruits and vegetables, including chili (Hervert-Hernández et al., 2010; Arnnok et al., 2012). In this study, as shown in Table 3, 96.6% of the collections (29/30) showed statistically similar values with respect to the concentration of anthocyanins in the fruits, whose values were between 1.0 and 1.97 mg cyanidin-3-glucoside 100 g-1; however, collection 22 (Potrero de Ojuelos, Fresnillo, Zacatecas) was the one with the lowest concentration of this pigment with 0.87 mg cyanidin-3-glucoside 100 g-1.
Table 3 Content of anthocyanins, total phenols and antioxidant capacity evaluated in collections of guajillo chili (Capsicum annuum L.)native of Durango and Zacatecas, Mexico.
| Collection number | AT (mg cyanidin-3-glucoside 100 g-1 ps) | FT (mg gallic acid 100 g-1 ps) | CA (μmol eq Trolox g-1) |
| 1 | 1.89 a* | 92.53 ab | 6 047 a-d |
| 2 | 1.59 ab | 73.59 ab | 5 834 a-d |
| 3 | 1.82 ab | 40.09 b | 9 095 ab |
| 4 | 1.05 ab | 91.75 ab | 8 882 a-c |
| 5 | 1.28 ab | 81.5 ab | 5 488 a-d |
| 6 | 1.46 ab | 90.26 ab | 5 011 a-d |
| 7 | 1.74 ab | 91.64 ab | 5 61 a-d |
| 8 | 1.67 ab | 116.88 a | 3 068 b-d |
| 9 | 1.97 a | 86.92 ab | 4 991 a-d |
| 10 | 1 ab | 88.13 ab | 8 255 a-d |
| 11 | 1.74 ab | 94.55 ab | 7 863 a-d |
| 12 | 1.67 ab | 91.64 ab | 9 759 a |
| 13 | 1.73 ab | 111.81 a | 8 692 a-c |
| 14 | 1.80 ab | 89.69 ab | 10 607 a |
| 15 | 1.40 ab | 86.64 ab | 9 531 ab |
| 16 | 1.35 ab | 78.34 ab | 9 902 a |
| 17 | 1.91 a | 85.83 ab | 5 075 a-d |
| 18 | 1.18 ab | 93.02 ab | 8 927 a-c |
| 19 | 1.47 ab | 82.85 ab | 7 437 a-d |
| 20 | 1.35 ab | 106.07a | 3 063 b-d |
| 21 | 1.9 a | 129.54 a | 2 559 cd |
| 22 | 0.87 b | 82.88 ab | 7 201 a-d |
| 23 | 1.62 ab | 84.69 ab | 8 693 a-c |
| 24 | 1.43 ab | 117.1 a | 5 364 a-d |
| 25 | 1.46 ab | 106.82 a | 9 161 ab |
| 26 | 1.79 ab | 125.11 a | 7 749 a-d |
| 27 | 1.81 ab | 107.13 a | 7 596 a-d |
| 28 | 1.25 ab | 89.37 ab | 2 054 d |
| 29 | 1.58 ab | 72 ab | 6 671 a-d |
| 30 | 1.17 ab | 83.41 ab | 7 558 a-d |
| DMSH | 1.004 | 63.18 | 6 484.1 |
AT= total anthocyanins; FT= total phenols; CA= antioxidant capacity; *= values with the same letter within columns, are equal according to the Tukey test (p≤ 0.05); DMSH= honest significant minimum difference.
In contrast, Moreno et al. (2006), when evaluating mature fruits of 162 collections (plants) of guajillo chili, native of Jalisco, Zacatecas and Durango, they report a lower average value (0.22 mg 100 g-1) which was detected in a plant from the municipality of villa union in Durango, however, also reported values of 1.97 mg 100 g-1 in fruits of a collection of Luis de Moya, Zacatecas, similar to that found in collections 1, 21, 17 and 9 with values of 1.89, 1.90, 1.91 and 1.97 mg 100 g-1, respectively. Variability attributed according to Moreno et al. (2006) with the genotype and the prevailing edaphoclimatic conditions of the localities during the growth and development of the collected materials (Rochin-Wong et al., 2013), as well as with the management during the dehydration process (Hernández-Ortega et al., 2012).
On the other hand, Arnnok et al. (2012) evaluated the content of anthocyanins in the pericarp of chili (Capsicum annuum L.) and indicate values in fresh weight of 0.79 to 2.78 mg kg-1 and 6.62-19.9 mg kg-1 in dry weight, where said variation according to authors were attributed with the duration in the storage period and the intense activity of the nonenzymatic system (reduced glutathione, vitamin E (α-tocopherol), vitamin A (trans-retinol/β-carotene) and ascorbic acid (vitamin C) which is activated against browning and oxidation caused by the activity of the polyphenoloxidase enzyme and catechol oxidase (Rodríguez et al., 2017).
Total phenols
It was found that 96.6% of the materials analyzed were statistically similar in their content of total phenols (72.00 and 129.54 mg gallic acid 100 g-1); however, if they exceeded collection 3 (Vicente Guerrero, Durango) who showed the lowest value for this variable (40.09 mg gallic acid 100 g-1) (Table 3). With respect to these results, Menichini et al. (2009) in a study where they evaluated the effect of the state of maturity on the phytochemical content in Capsicum chinense Jacq. ‘Habanero’, reported values of total phenols well above those found in this work, with 782 (immature-green) and 759 (mature-red) mg 100 g-1, respectively. However, Figueroa et al. (2015) indicate lower values for six commercial varieties and three fruit colorations (mg gallic acid 100 g-1): ‘Magno’ (orange) (8.51), ‘Moonset’ (yellow) (9.72), ‘California’ ( yellow) (7.16), ‘Triple 4’ (red) (6.55), ‘Triple Star’ (red) (10.98) and ‘Viper’ (red) (9.98), and without finding differences by effect of varieties and coloration, behavior which was associated with the maturation period (change from green to red, yellow and orange) (Shahidi and Naczk, 2004), therefore, it is suggested that the consumption of chili should be done during physiological maturity, when they have not yet completed your maturity process. Additionally, authors such as Arnnok et al. (2012) indicate that exposure to high temperatures (55-65 °C) and in which the ventilation levels in the drying tunnels are not adequate, has a negative impact on the degradation of secondary metabolites, among these, the phenolic compounds.
Antioxidant capacity
As shown in Table 3, 26/30 of the collections (including commercial varieties) showed statistically similar CA values between 4 991 and 10 607 μmol eq Trolox g-1, however, they were higher than those shown by the collections 8, 20, 21 and 28 with 3 068, 3 063, 2 559 and 2 054 μmol eq Trolox g-1, respectively. Results that exceed the indicated by Hervert-Hernández et al. (2010) who when evaluating antioxidant capacity in guajillo chili with the FRAP (ferric reducing/antioxidant power) and ABTS (2, 2’azinobis (3-ethylbenzthiazolin-6-sulfonic acid) methods indicate no statistical variation with values of 63.9 ±0.9 and 26.6 ±1 μmol eq Trolox 100 g-1, likewise, the same authors also reported in de arbol chili and chipotle (Capsicum annuum L.) values antioxidant capacity 82.3 ±1.3 and 80.6 ±1.2 μmol eq Trolox 100 g-1, respectively, which also do not exceed what is found in this research.
Likewise, Figueroa et al. (2015) for six commercial varieties, three fruit colorations and with the same method of chemical analysis, indicate values between 729 and 1281 μmol eq Trolox 100 g-1, where the yellow varieties were the most outstanding. There is sufficient evidence to suggest a high correlation between the content of ascorbic acid, flavonoids and total phenols with respect to the behavior of the antioxidant capacity (Menichini et al., 2009; Kantar et al., 2016), in such a way that the level of antioxidant capacity is presented in a differentiated way, considering the method of analysis (Arnnok et al., 2012), state of maturity and agronomic management (Pérez-López et al., 2007). In this work, collections 12, 14 and 16, presented values of antioxidant capacity that surpass those reported in species such as tamarind (Tamarindus indica L.) and potato (Solanum tuberosum L.) (Tangkanakul et al., 2009).
Principal component analysis
The principal component analysis (CP) indicated that 65.5% of the total variation was explained with three CPs (Table 4). Of this, 26.2% corresponds to CP1 and according to the Pearson correlation coefficients (R2) (Table 5), this component was related to the content of VC and AT, 16.2% corresponded to CP2 that was related to the purity color (Chroma), brightness (L) and CA; hue (°hue) and FT with 14% of the variation constituted CP3. These results are similar to those obtained by Moreno-Pérez et al. (2011) in a study of morphological diversity of 162 collections of native guajillo chili, from the states of Jalisco, Zacatecas and Durango, Mexico, indicate that with two CP explained 75.5% of the total variation, and that CP1 was formed by the brightness, chromaticity and °hue and the CP2 by the content of AT. Likewise, Ramirez et al. (2018) when evaluating the morphological diversity in 11 populations of chili piquin (Capsicum annuum L.) native to the Sierra Gorda (Guanajuato and Querétaro, Mexico) conclude that 56.6% of the total variation was explained with three CPs, whose integration was given by the characteristics of weight, width and length of the fruit, as well as by the density of leaves, diameter of seed, shape of the fruit and color of the anthers.
Table 4 Characteristic value and variance of the main components (CP).
| CP | Characteristic value | Proportion of variance | Accumulated variance |
| CP1 | 2.095 | 0.262 | 26.2 |
| CP2 | 1.301 | 0.162 | 42.4 |
| CP3 | 1.124 | 0.14 | 65.5 |
Table 5 Characteristic vectors and determination coefficients (R2) of the main components (CP).
| Variable | CP1 | CP2 | CP3 | R2 | ||
| CP1 | CP2 | CP3 | ||||
| Brilliance | -0.19 | -0.448 | 0.196 | -0.276 | -0.511** | 0.208 |
| Chromaticity | -0.287 | 0.579 | 0.138 | -0.415** | 0.661** | 0.146 |
| Hue (°hue) | 0.161 | -0.068 | 0.809 | 0.234 | -0.077 | 0.858** |
| Vitamin C | 0.473 | -0.18 | 0.283 | 0.685** | -0.206 | 0.3 |
| Total anthocyanins | 0.473 | 0.347 | 0.127 | 0.684** | 0.396 | 0.135 |
| Total phenols | 0.46 | -0.146 | -0.409 | 0.666** | -0.167 | -0.434** |
| yCA | -0.384 | -0.404 | 0.083 | -0.557** | -0.461** | 0.088 |
yCA= antioxidant capacity; **= highly significant (p≤ 0.01).
Conglomerate analysis
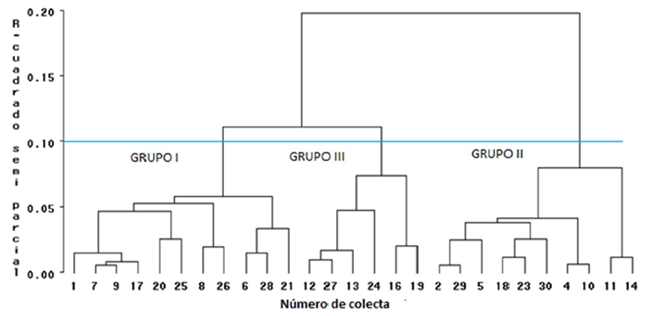
The cluster analysis is presented in Figure 1, which is corroborated with the cubic criterion of clustering and the pseudo-statistics T2 of Hotelling (first value <20% of total collections) and the formation of four groups is observed , where group I was formed by collections 1, 6, 7, 8, 9, 17, 20, 21, 25, 26 and 28, group II was integrated by 2, 29, 5, 18, 23, 30 , 4, 10, 11 and 14 and collections 12, 27, 13, 24, 16 and 19 corresponded to group III, with groups II and III where the commercial varieties ‘Castilla’ and ‘Minero’ were included, respectively. On the other hand, it is important to point out that group I was integrated by a similar number of collections with respect to the collection sites Durango (6) and Zacatecas (5), where it is important to mention that among the climatic conditions in common that they have among their collecting sites, are the average annual temperature and precipitation with values between 16.9 °C and 500 mm, respectively (INAFED, 2010), conditions can be linked to the development of color purity (chromaticity), product of synthesis and accumulation of VC, AT and FT (Moreno-Pérez et al., 2006), as observed the values of the characteristic vectors of this main component.
Canonical discriminant analysis
In order to verify that the number of groups considered in the analysis of principal components is adequate a canonical discriminant analysis was carried out, where the three groups were categorized as categorical variables. It was found that with two canonical discriminant functions (VC) it was possible to describe 100% of the variability of the groups (Table 6), with an individual variation of 62.5% and 37.4%.
Table 6 Values of the canonical discriminant functions evaluated in collections of guajillo chili (Capsicum annuum L.) native to Durango and Zacatecas, Mexico.
yVC= characteristic value; PV= variance proportion; PVA= proportion of cumulative variance.
When performing the linear correlations between the generated discriminant functions, it was determined that the canonical discriminant variable 1 (VC1) correlated positively with the content of VC and °hue and negative with the CA and chromaticity, with values of -0.293 and -0.064, respectively. On the other hand, with values of 0.733 and 0.579, CA and L showed a high positive linear correlation in VC2, while the content of VC, AT and FT was negative (Table 7). These results indicate that 62.5% of the total variation is explained by the increase in VC, AT and FT (Dallas, 2000); however, if the presence of these compounds decreases, the CA of fruits increases (Arnnok et al., 2012).
Table 7 Total canonical structure of discriminant variables defined with three groups of collections of chili guajillo (Capsicum annuum L.)
| Variable | yVC1 | VC2 |
| Brilliance | 0.204 | 0.579 |
| Chromaticity | -0.293 | 0.022 |
| Hue (°hue) | 0.64 | 0.258 |
| Vitamin C | 0.754 | -0.4 |
| Total anthocyanins totales | 0.397 | -0.529 |
| Total phenols | 0.415 | -0.386 |
| Antioxidant capacity | -0.064 | 0.733 |
y= Canonical variable.
Conclusions
Among the color components analyzed, tonality was the one that showed the greatest variability among the fruit samples. It was found that the 19 and 25 native collections of Zacatecas showed the highest values of VC with 200.02 and 196.19 mg ascorbic acid 100 g-1 ps. The 96.6% of the collections (29/30) showed similar values of AT and FT, whose values were between 1 and 1.97 mg cyanidin-3-glucoside 100 g-1 and 72 and 129.54 mg gallic acid 100 g-1 ps, respectively. A total of 26/30 of the collections showed similar values of CA between 4 991 and 1 0607 μmol eq Trolox g-1; however, they exceeded that observed in collections 8 of Vicente Guerrero, Durango and 20, 21 and 28 of Zacatecas. On the other hand, based on three main components 65.5% of the total variation between the collections could be explained, where the content of VC, AT and the color components (bright and chromaticity) were the ones that contributed most to the explanation of said variation.
Literatura citada
Agostini-Costa, T. S; Silva, G. I.; Martins, P. L. A.; Becke, S. F. J. and Costa, R. C. S. 2017. Carotenoid and total vitamin C content of peppers from selected Brazilian cultivars. J. Food Comp. Analysis. 57:73-79. [ Links ]
Aguilar, H. y Esparza, F. G. 2010. Situación y perspectivas de la producción de chile seco en Zacatecas. Rev. Geografía Agríc. 45(2):19-38. [ Links ]
Anónimo.. NMX-FF-107/1-SCFI-2006 2006. Productos alimenticios, chiles secos enteros. http://cide.uach.mx/pdf/normas%20mexicanas%20nmx/productos%20alimenticios%20no%20industrializados%20para%20uso%20humano/productos%20alimenticios.%20chiles%20secos%20enteros.pdf. [ Links ]
Arnnok, P.; Ruangviriyachai, C.; Mahachai, R.; Techawongstien, S. and Chanthai, S. 2012. Determination of total phenolics and anthocyanin contents in the pericarp of hot chilli pepper (Capsicum annuum L.). Inter. Food Res. J. 19(1):235-243. [ Links ]
Chávez-Servia, J. L.; Vera-Guzmán, A. M.; Carrillo-Rodríguez, J. C. y Heredia-García, E. 2016. Variación en contenido de minerales en frutos de variedades autóctonas de chile (Capsicum annuum L.), cultivadas en invernadero. Vitae. 23(1):48-57. [ Links ]
Craker, L. E. 1971. Postharvest color promotion in cranberry with ethylene. HortScience. 6:137-139. [ Links ]
Cruz, P. A. B.; González, H. V.; Soto, H. R. M.; Gutiérrez, E. M A.; Gardea, B. A. A. y Pérez, G. M. 2007. Capsaicinoides, vitamina c y heterosis durante el desarrollo del fruto de chile manzano. Agrociencia. 41(41):627-635. [ Links ]
Cruz-Crespo, E.; Sumaya-Martínez, M. T.; Can-Chulim, A.; Pineda-Pineda, J.; Bugarín-Montoya, and Aguilar-Benítez, G. 2015. Quality, bioactive compounds, and antioxidant activity of serrano chili peppers cultivated in volcanic rock-vermicompost and nutrient solutions. Ciencia e Investigación Agraria. 42(3):375-384. [ Links ]
Dallas, J. E. 2000. Métodos multivariados aplicados al análisis de datos. ITP Internacional Thompson Editores, SA de CV. México, DF. 547 p. [ Links ]
Figueroa, C. I. E.; Martínez, D. M. T.; Rodríguez, P. J. E.; Cruz, A. O.; Colinas, L. B. M. T.; Valle, G. S. y Ramírez, R. S. P. 2015. Capacidad antioxidante en variedades de pimiento morrón (Capsicum annum L.). Interciencia. 40(10):696-703. [ Links ]
Fogliano, V.; Verde, V.; Randazzo, G. and Ritieni, A. 1999. Method for measuring antioxidant activity and its application to monitoring the antioxidant capacity of wines. J. Agric. Food Chem. 47(3):1035-1040. [ Links ]
Hernández-Ortega, M.; Ortiz-Moreno, A.; Hernández-Navarro, M. D.; Chamorro-Cevallos, G.; Dorantes-Álvarez, L. and Necoechea-Mondragon, H. 2012. Antioxidant, antinociceptive, and anti-inflammatory effects of carotenoids extracted from dried pepper (Capsicum annuum L.). J. Bio. Biotechnol. 524019:10. [ Links ]
Hervert-Hernández, D.; Sayago-Ayerdi, S. G. and Goñi, I. 2010. Bioactive compounds of four hot pepper varieties (Capsicum annuum L.), antioxidant capacity, and intestinal bioaccessibility. J. Agric. Food Chem. 58(6):3399-3406. [ Links ]
INAFED (Instituto Nacional para el Federalismo y el Desarrollo Municipal). 2010. Enciclopedia de los municipios y delegaciones de México: estado de Durango y Zacatecas. Ciudad de México, México. https://www.gob.mx/inafed. [ Links ]
Jagota, S. K. and Dani, H. M. 1982. A new colorimetric technique for the estimation of vitamin C using Folin phenol reagent. Analytical Biochem. 127(1):178-182. [ Links ]
Kantar, B. M.; Anderson, E. J.; Lucht, A. S.; Mercer, K.; Bernau, V.; Case, A. K.; Le, C. N.; Frederiksen, K. M.; DeKeyser, C. H.; Wong, Z. Z.; Hastings, C. J. and Baumler, J. D. 2016. Vitamin variation in Capsicum spp. Provides opportunities to improve nutritional value of human diets. PLoS ONE. 11(8):e0161464. [ Links ]
Litwack, G. 1967. Bioquímica experimental. Ediciones Omega, SA. Barcelona, Espana. 378 p. [ Links ]
Menichini , F.; Tundis, R.; Bonesi, M.; Loizzo, R. M.; Conforti, F.; Statti, G.; De Cindio, B.; Houghton, J. P. and Menichini, F. 2009. The influence of fruit ripening on the phytochemical content and biological activity of Capsicum chinense Jacq. cv Habanero. Food Chem. 114(2):553-560. [ Links ]
Moreno-Pérez, E. C.; Avendaño-Arrazate, H.; Mora-Aguilar, R.; Cadena-Iñiguez, J.; Aguilar- Rincón, V. H. y Aguirre-Medina, J. F. 2011. Diversidad morfológica en colectas de chile guajillo (Capsicum annuum L.) del centro-norte de México. Rev. Chapingo Ser. Hortic. 12(1):23-30. [ Links ]
Moreno-Pérez, E. C.; Martínez-Damián, Ma. T.; Reyes-López, D.; Pérez-Mercado, C. A.; Peña- Lomelí, A. y Espinosa-Robles, P. 2006. Intensidad de color y contenido de antocianinas en chile guajillo (Capsicum annuum L.). Rev. Chapingo Ser. Hortic. 17(1):135vrd00ihgyh-140. [ Links ]
Pérez-López, A. J.; López-Nicolas, J. M.; Núñez-Delicado, E.; Amor, M. F. and Carbonell- Barrachina, A. A. 2007. Effects of agricultural practices on color, carotenoids composition, and minerals contents of sweet peppers, cv. Almuden. J. Agric. Food Chem. 55(20):8158-8164. [ Links ]
Ramírez, N. U. I.; Cervantes, O. F.; Montes, H. S.; Raya, P. J. C.; Cibrián, J. A. y Andrio, E. E. 2018. Diversidad morfológica del chile piquín (Capsicum annuum L. var. glabriusculum) de Querétaro y Guanajuato, México. Rev. Mex. Cienc. Agríc. 9(6):1159-1170. [ Links ]
Rochín-Wong, C. S.; Gamez-Meza, N. G.; Montoya-Ballesteros, L. C. y Medina-Juárez, L. A. 2013. Efecto de los procesos de secado y encurtido sobre la capacidad antioxidante de los fitoquímicos del chiltepín (Capsicum annuum L. var. glabriusculum). Rev. Mex. Ingeniería Química. 12(2):227-239. [ Links ]
Rodríguez, R. M. J.; Soliva, F. R. and Martín, B. O. 2017. Methods for determining the antioxidant capacity of food constituents. In: fruit and vegetable phytochemicals: chemistry and human health. Yahia, E. M. (Ed.). Hoboken, New Jersey. USA. John Wiley & Sons, Ltd. 803-816 pp. [ Links ]
SAS Institute. 2002. SAS/STAT User’s guide, Software version 9.0. Cary, NC. USA. 4424 p. [ Links ]
Tangkanakul, P.; Auttaviboonkul, P.; Niyomwit, B.; Lowvitoon, N.; Charoenthamawat, P. and Trakoontivakorn, G. 2009. Antioxidant capacity, total phenolic content and nutritional composition of Asian foods after thermal processing. Inter. Food Res. J. 16:571-580. [ Links ]
Toledo-Aguilar, R.; López-Sánchez, H.; Santacruz-Varela, A.; Valadez-Moctezuma, E.; López, P. A.; Aguilar-Rincón, H.; González-Hernández, V. A. and Vaquera-Huerta, H. 2016. Characterization of genetic diversity of native ‘Ancho’ chili populations of Mexico using microsatellite markers. Chilean J. Agric. Res. 76(1):18-26. [ Links ]
Vera-Guzmán, A. M.; Chávez-Servia, J. L.; Carrillo-Rodríguez, J. C. and López, G. M. 2011. Phytochemical evaluation of wild and cultivated pepper (Capsicum annuum L. and C. pubescens Ruiz & Pav.) from Oaxaca, Mexico. Chilean J. Agric. Res. 71(4):578-585. [ Links ]
Received: November 01, 2018; Accepted: January 01, 2019
 Este es un artículo publicado en acceso abierto bajo una licencia Creative Commons
