


Serviços Personalizados
Journal
Artigo
 texto em
  Inglês (pdf)
 Artigo em XML
 Referências do artigo
 Enviar este artigo por email
Indicadores
-
 Citado por SciELO
 -
 Acessos
Links relacionados
-
 Similares em
SciELO
Similares em
SciELO
Compartilhar

 Permalink
Revista mexicana de ciencias agrícolas
versão impressa ISSN 2007-0934
Rev. Mex. Cienc. Agríc vol.9 no.6 Texcoco Ago./Set. 2018
https://doi.org/10.29312/remexca.v9i6.1584
Articles
Credit as a strategy for rural development: credit union Mixta Plan Puebla
1Postgraduate College-Postgraduate in Rural Development. Campus Montecillo. Mexico-Texcoco Highway, km 36.5, Montecillo, Texcoco, State of Mexico. CP. 56230. (gc-juana@hotmail.com, xalmeraya@colpos.mx, glenin@colpos.mx).
The financing through the credit allows to increase the productive activities of the farmers and the opportunities of access to the market, their income and in this way to improve the quality of life of the families. The objective of this paper was to analyze the distribution of credits made by the Credit Union ‘Mixta Plan Puebla’ (UCMPP) from 1993 to 2005, with the purpose of knowing if these have been destined to the less developed municipalities where its area of greatest dispersion and if the loans granted were tracked. To achieve this purpose, a field investigation was carried out that consisted of the application of 86 surveys to the partners, as well as the preparation of a historical database of the municipalities. Within the results, it is observed that 61% of the credits are distributed in urban communities, while 39% in rural communities, of which 56% are of medium marginalization and 59% of low migration.
Keywords: index of human development; marginalization; migration; rurality
El financiamiento a través del crédito permite aumentar las actividades productivas de los agricultores y las oportunidades de acceso al mercado, sus ingresos y de esta manera mejorar la calidad de vida de las familias. El objetivo de este trabajo fue analizar la distribución de créditos que ha realizado la Unión de Crédito ‘Mixta Plan Puebla’ (UCMPP) del periodo de 1993 hasta 2005, con la finalidad de conocer si éstos han sido destinados a los municipios menos desarrollados donde fue su área de mayor dispersión y si se dio seguimiento a los créditos otorgados. Para alcanzar dicho propósito se llevó una investigación de campo que consistió en la aplicación de 86 encuestas a los socios, así como la elaboración de una base de datos históricos de los municipios. Dentro de los resultados se observa que 61% de los créditos están distribuidos en comunidades urbanas, mientras que 39% en comunidades rurales, de los cuales 56% son de mediana marginación y 59% de baja migración.
Palabras clave: índice de desarrollo humano; marginación; migración; ruralidad
Introduction
The agricultural sector faces a series of risks that mean that it is not sufficiently attended to in its credit needs, for which reason it lacks financial services; however, there are institutions that support rural productive development, for example, financial intermediaries. Muños et al. (2002) states that they are the fundamental mechanism of operations of financial markets, it can be said that basically financial markets are markets where companies, individuals and institutions (savers), place their surplus liquidity with financial intermediaries in exchange of the payment of an interest.
Mexico has several financial institutions regulated by the government, which provide credit and savings services, mainly to people who have a formal job and a certain level of income. However, not all people comply with this profile and access to these institutions is restricted, that is why some resort to means that provide credit facilities, named as informal financial system such as: runs with family and friends, lenders, pawnshops, independent boxes, among others. However, as Remigio (2013) points out, these are not recommended, have low profitability and security, carry a risk and charge very high interest rates, which can cause the debt to increase and become more complicated to liquidate, even impossible face it in addition, the fact that these processes are not subject to formal regulation makes users of this medium more vulnerable.
On the other hand, there are several regulated financial intermediaries, depending on the type of service they provide, for example: banks, savings banks, exchange houses, insurers, credit unions, among others. Being the credit institutions or bank, the best known. Banks offer their services to the public and are an essential part of the payment system. There are two types of banks, the first are the banks that are private banks and the second are the development banks, which are owned by the government. These intermediaries are regulated by the law of credit institutions; in turn, each of the development banks is regulated by its own organic law (BANXICO, 2017).
Considering the scarcity of financial services in rural areas, the UCMPP was very relevant, since it offered access to credit and with them the possibility of undertaking productive projects that would contribute to improving the living conditions of families. The objective of this research was to analyze the distribution of credits that this institution has made, it is centered in 34 municipalities of the state of Puebla, the observation period is from 1993 in which began operations as a financial intermediary until 2005, in order to know if these were destined to the less developed municipalities, with high rates of marginalization, migration and rural areas, where it was their most dispersed area. These municipalities constituted the initial area of influence of the ‘Puebla Plan’, being the main reason why this study area was chosen.
Materials and methods
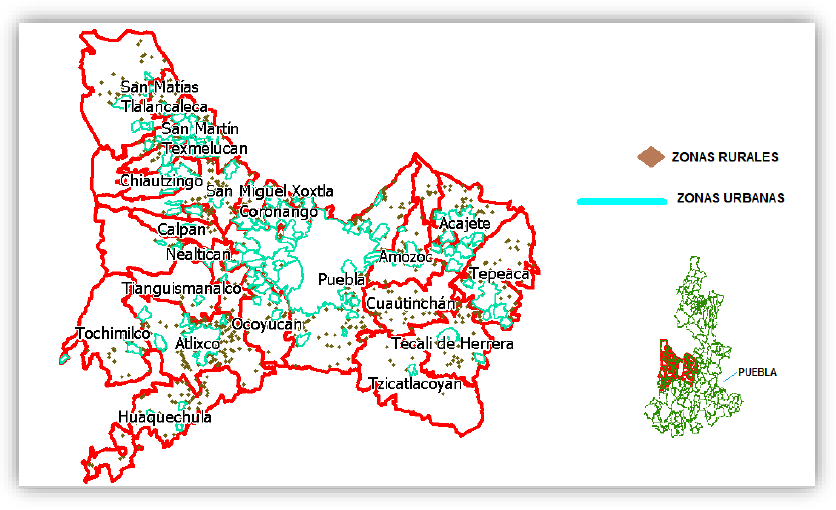
The study area is located in the Central West region of the state of Puebla, is made up of 34 municipalities, in which there are 109 urban locations and 882 rural locations. In Figure 1, the location of said municipalities is observed.
The research was developed in two stages, the first consisted in making a historical database with bibliographic information of the municipalities with data on the human development index, marginalization index, rurality index and the absolute index of migratory intensity.
In a second stage, the fieldwork was carried out, which consisted in the application of a survey through stratified sampling, this being a probabilistic sampling technique where the entire population is divided into different strata. Therefore, a classification of the municipalities was made, selecting those where there was greater influence on the part of the Mixed Credit Union Plan Puebla; resulting in 9 municipalities in which 80% of the capital is concentrated, 78% of the loans, 48% of the communities and 77% of the members. Subsequently, it was stratified according to the amount of the partners, to determine the size of the sample; that is, the number of surveys that were conducted, with a total of 874 partners, the following statistical formula was applied according to Rendón (2015).
Where: Z= 95% confidence coefficient = 1.96; N= universe or total population = 874;
Obtaining a total of 86 surveys that represent the target population of the study area. Finally, the final subjects of the different strata were randomly selected proportionally. The information obtained in the surveys was processed in IBM SPSS Statistics 22.0.
Results and discussion
According to the agricultural census 2007, it is observed in Table 1 that there is a total of 4 067 633 production units at the national level, where the state of Puebla concentrates 23.11% of these and the study area (34 municipalities) has 22.4 % at the state level.
Table 1 Situation of financing for agricultural and forestry activities.
| Concept | Mexican Republic | Puebla | |||||
|---|---|---|---|---|---|---|---|
| Total | Regarding the country (%) | Regarding the section (%) | Total | Regarding the country (%) | Regarding the state (%) | Regarding the section (%) | |
| Production units | 4 067 633 | 940 192 | 23.11 | ||||
| Contract only credit | 146 437 | 3.6 | 5 510 | 0.59 | |||
| Contract only insurance | 13 257 | 0.33 | 912 | 0.1 | |||
| Contract credit and insurance | 12 891 | 0.32 | 154 | 0.02 | |||
| No contract credit and insurance | 3 895 048 | 95.76 | 324 638 | 34.53 | |||
| Funding source | |||||||
| Commercial Bank | 14 318 | 8.99 | 919 | 16.68 | |||
| SOFOL | 1 861 | 1.17 | 71 | 1.29 | |||
| Financiera Rural | 28 006 | 17.58 | 456 | 8.28 | |||
| Credit union | 14 078 | 8.84 | 356 | 6.46 | |||
| Another source | 103 492 | 64.96 | 3 914 | 71.03 | |||
| FIRA | 37 869 | 23.77 | 617 | 11.2 | |||
| Does not know | 58 991 | 37.02 | 2 211 | 40.13 | |||
| Supply credit | |||||||
| Production units | 104 992 | 71.7 | 2 322 | 42.14 | |||
| Until 10 000 | 42 415 | 40.4 | 1 548 | 66.67 | |||
| 10 000 a 50 000 | 35 026 | 33.36 | 626 | 26.96 | |||
| 50 000 a 100 000 | 15 107 | 14.39 | 72 | 3.1 | |||
| More of 100 000 | 12 444 | 11.85 | 76 | 3.27 | |||
| Refactionary credit | |||||||
| Production units | 13 102 | 8.22 | 416 | 7.55 | |||
| Until 10 000 | 5 891 | 44.96 | 230 | 55.29 | |||
| 10 000 a 50 000 | 3 810 | 29.08 | 109 | 26.2 | |||
| 50 000 a 100 000 | 1 120 | 8.55 | 19 | 4.57 | |||
| More of 100 000 | 2 281 | 17.41 | 58 | 13.94 | |||
| Other type of credit | |||||||
| Production units | 34 400 | 21.59 | 1 658 | 30.09 | |||
| Until 10 000 | 22 478 | 65.34 | 1 240 | 74.79 | |||
| 10 000 a 50 000 | 8 442 | 24.54 | 329 | 26.53 | |||
| 50 000 a 100 000 | 1 785 | 5.19 | 53 | 16.11 | |||
| More of 100 000 | 1 695 | 4.93 | 36 | 67.92 | |||
| They allocate part of the income to savings institutions | |||||||
| Production units | 119 048 | 2.93 | 5 953 | 0.63 | |||
| Commercial Bank | 45 244 | 38 | 1 928 | 32.39 | |||
| Public banking BANSEFI | 4 275 | 3.59 | 171 | 2.87 | |||
| Credit union | 1 680 | 1.41 | 63 | 1.06 | |||
| Savings bank | 24 458 | 20.54 | 926 | 15.56 | |||
| Another institution | 44 279 | 37.19 | 2 865 | 48.13 | |||
| Grouped for supports | |||||||
| Production units | 100 210 | 2.46 | 171 316 | 18.22 | |||
| Grouped for financing | 5 663 | 5.65 | 5 607 | 3.27 | |||
Source: elaborated with data from the agro-livestock census 2007.
It should be noted that 95.79% nationwide did not take credit or insurance to finance their agricultural activities, at the state level it represents 34.5% and in the study area 35.6%. Among the institutions that contracted credit, it was observed that neither the commercial banks, nor the government institutions, nor the credit unions are the main source of financing; this reflects that the sector lacks financial services. Buchenau and Del Ángel (2007), point out that the structure of the supply of financial services to the agricultural and rural sector is characterized by low penetration levels of commercial banks, a high multiplicity of organizations and financing mechanisms and a strong presence of programs of the State that affect the financing mechanisms.
In the broadest sense, they continue to have low or no banking levels, little access to financial services, and an uncertain future. The main source of financing for the 3 areas is not specified and they have the following percentage: 65% for the national, 71% for the national and 73% for the municipalities. Since the main sources of financing within the formal banking system are not specified, it is deduced that the informal financing (usurers, tandas) is the one that provides this service.
The most requested credits are the supply, both national, state and study area: 2.6%, 0.25% and 0.22% respectively. Only 13 102 production units, at a national level, contracted refactional credit, 416 at the state level and 90 at the municipality level. Only 2.9% of the units allocate part of their income to savings and 2.5% are grouped to request funding support at the national level. Almeraya (2011), points out that, if the most requested loan were the refactionary, the producers would be more focused on the growth of their projects or activities, because this type of credit refers to the acquisition of machinery, real estate or repair of facilities. Within the sample, it was found that 43% were accorded credits, followed by 31.4% of refactionary credit.
Distribution of credits by the UCMPP
Selecting the members without balance and with balance, it was found that 61% of the credits are distributed in urban communities, while 39% in rural communities. The distribution of credits was more oriented to urban communities, leaving a large number of rural communities without access to credit. There are still obstacles that prevent families and producers in rural areas from gaining access to financial services. In this sense, Rajdeep (2008) points out that there is a belief that granting loans to peasants presupposes a risk because they are not desirable subjects to be granted loans, because they do not have the necessary skills to make the best use of them. the funds loaned.
Human development index (IDH). In 44% of the municipalities in the sample, the IDH increased from 2000 to 2010, measuring the index of life expectancy, education and income; the level of human development is the set of opportunities for people to achieve or carry out actions they consider valuable (PNUD, 2016); therefore, the increase can be due to one of these three factors. So there was a positive change in human development, because they have a long and healthy life, acquired knowledge and enjoy a decent standard of living.
Degree of marginalization (GM). According to CONAPO (2011), marginalization is a multidimensional and structural phenomenon, originated in the last instance by the economic production model expressed in the unequal distribution of progress, in the productive structure and in the exclusion of diverse social groups, both in the process as of the benefits of development. They are grouped into five grades: very low, low, medium, high and very high. The 24% of the municipalities in the sample had a positive change (high marginalization on average) from 1990 to 2010, the rest remained stable, in 2010 there are 56% of municipalities in middle marginalization, 15% high, 21% in low and 9% in very low. It was observed that 56% of the population is improving in terms of goods and services that are fundamental for social welfare.
Degree of rurality (GR). The 56% of the municipalities in the sample had a change from urban to rural semi-urban from 2000 to 2010 the rest did not change significantly. On the other hand, according to the OCDE (2010) the 56% of the municipalities in rural semi-urban, 29% in intermediate urban, 12% in dispersed rural and 3% in urban metropolitan. The classification depends on the population fraction: dispersed rural (less than 2 500 inhabitants), semi-urban rural (between 2 500 and 15 000), intermediate urban (between 15 000 and 100 000) and urban or urban metropolitan (more than 100 000) (OCDE, 2007).
Degree of migratory intensity (GIM). The 53% of the municipalities changed from 2000 to 2010; finding that 24% of the municipalities went from very low-low, 9% high-medium, 9% low-medium, 6% medium-high, 3% medium-low and 3% high-low, which reflects a decrease in this index. In 2010, it was 59% low, 32% medium, 6% high and 3% very high. Therefore, by decreasing the migration indicates that there are sources of employment in the municipalities, which improves the income of families and consequently the quality of life. As mentioned by Sobrino (2010), among the causes of economic migration are the search for opportunities and better incomes, with the aim of transforming individual or family economic conditions and increasing the standard of living. Likewise, García (2007) indicates that migration rather than an individual strategy is a familiar alternative to diversify sources of income, face risks, gather resources of different kinds and try to replicate the success stories of other migrants.
On the other hand, carrying out an analysis of the 4 indices described above (IDH, GM, GR, GIM) has 44% of the municipalities where the human development index increased, the degree of marginalization is between 29% on average and 6% in high, in the same way, there are semi-urban rural areas with 26%, scattered rural areas with 9%; the degree of migratory intensity 26% medium and 15% low. As noted, communities do not necessarily have to be urban in order for their IDH to be high; likewise, 56% of the municipalities had an IDH decrease, in which the degree of marginalization in the last year was 26% average and 15% low; 29% in rural semi-urban, 21% in intermediate urban and 44% in low migration (Table 2). Therefore, according to these indexes, the most benefited municipalities with credits were the semi-urban rural areas, with a medium marginalization and low migration.
Table 2 Comparison of the different indices.
| Index | 2010 | |
|---|---|---|
| IDH increase | IDH decreased | |
| (44%) | (56%) | |
| Degree of marginalization | ||
| High | 9% | 6% |
| Medium | 29% | 27% |
| Low | 6% | 15% |
| Very low | 0% | 9% |
| Degree of rurality | ||
| Urban metropolitan | 0% | 3% |
| Intermediate urban | 9% | 21% |
| Rural semi-urban | 27% | 29% |
| Dispersed rural | 9% | 3% |
| Degree of migratory intensity | ||
| High | 0% | 6% |
| Medium | 27% | 6% |
| Low | 15% | 44% |
| Very high | 3% | 0% |
Source: elaborated in 2017.
On the other hand, according to the survey carried out, the following information is obtained:
General data of the interviewees
The average age is 64 years. The 40.7% of the interviewees are in the range of 55 to 65 years. The foregoing indicates that the members of the UCMPP are people with tendencies towards aging; it is therefore advisable to carry out a renewal of the partners, through promotion to more productive age groups, as mentioned by ENA (2014), 40.5% of the rural population is 60 years of age or older, so they at risks personal physical and social that temporarily or permanently truncate their capacity or productive possibility. On the other hand, 89.5% are men; therefore, productive activities and resource management continue to be an activity that men perform. However, the role of women in the UCMPP is very important, in the board of directors of 1996-1999 its president was a peasant woman.
The 70.9% have completed the basic (primary) school level therefore, the degree of education is minimal. CONAPO (2011), points out that education is a factor in accessing better paid jobs, it is also related to the capacity of workers and this is related to the production of goods and services with higher added value and increased productivity, innovations and economic competitiveness. On the other hand, 29.1% speak indigenous language, being Nahuatl the spoken dialect, which shows that there is a percentage of the population considered indigenous who obtained some credit from the UCMPP. According to the FAO (2011), indigenous communities continue to be among the most vulnerable population, suffering high levels of poverty and discrimination and having less access to education, health, land tenure and credit; which is observed in the study area.
Productive activity
The results of the analysis show that 24 years ago, 98.8% of the respondents worked, dedicating themselves mainly with 57% to agriculture, 24.4% workers on their own (people who have their own business), 16.3% in livestock activities, services, employees and workers, the remaining 2.4% is concentrated in other activities. The most outstanding changes are observed in that currently 76.7% work, which indicates that there is a decrease in the labor force. Of the people who work, 58% are engaged in agricultural activity, 23.2% are workers on their own, 14.4% livestock activities, services, employees and workers. So, the main activity is still agriculture, hence its importance as a source of employment.
Credit situation
The 97.7% of the respondents are members of the UCMPP, of which 53.5% have between one and five shares; however, 30.2% do not remember the number of shares. The above, suggests that there is lack of attention and monitoring of partners.
The length of stay indicates that 77.9% were founding members covering the period from 1990 to 1993. The 68.6% mention that they learned about the UCMPP from a friend or acquaintance, 31.4%, through their staff.
The 97.7% of the partners interviewed obtained credit from these 84.9% requested between one to three credits. Of which 88.4% were individually and only 8.1% as a group.
The way in which they received the loan 82.6% indicated that it was in cash, 10.5% in implements and 3.5% in inputs and 3.5% in others. The main destination of the loan was the acquisition or purchase of raw material with 32.6%, followed by the purchase of a vehicle or tractor for work, 31.4% (Table 3).
Table 3 Granting of credit by the UCMPP.
| Received the credit (%) | Destination of credit (%) | Benefit with credit (%) |
|||||||
|---|---|---|---|---|---|---|---|---|---|
| Cash | Implements | Inputs | Other | Acquire or buy raw material | Purchase of vehicle or tractor for work | Acquire or buy merchandise | Other | Yes | No |
| 82.6 | 10.5 | 3.5 | 3.5 | 32.6 | 31.4 | 19.8 | 16.2 | 89.5 | 10.5 |
Source: elaborated in 2017.
On the other hand, 89.5% obtained some benefit with the credit, as, for example: increased sales, improved the quality of their products, increased profits, facilitated the use of machinery, cost reduction, started a business, obtained economic resources.
In terms of credit sufficiency, 88.4% mentioned that the credit granted was sufficient, 11.6% mentioned that it was not enough, since it needed more economic resources, but it was the amount that was granted.
In the problems in obtaining the loan, 91.9% said they had no problem. Likewise, 79.1% made the payment of the credit on time; however, 20.9% did not pay within the agreed term, although the borrowers indicated that they were not in the past due portfolio. It is indicating lack of ignorance of the partners on their credit standing, hence the importance of monitoring partners by the UCMPP.
On the other hand, 40.7% of the interviewees indicate that, if the UCMPP had not granted the loan, they would not have resorted to another source of financing because they had not met the requirements requested in most cases. This shows the importance of the UCMPP as a financing option for these producers, since to obtain a credit it is necessary to prove that there is income and demonstrate that there is an acceptable probability that such income will be sustained over time (Raphael, 2012).
Members with credit without balance and with balance
During the period analyzed (1993-2005) it was found that the UCMPP dispersed a total of 4 753 credits, with an amount of $129 973 628.00 pesos in 124 communities, benefiting 1 142 members, as well, in the sample (9 municipalities) a total of 3 709 credits were obtained, with an amount of $103 353 168.00 pesos in 60 communities, granted to 874 members (Table 4).
Table 4 Data of the members with credit without balance of the UCMPP.
| Municipality | Capital | Credits | Community | Partners |
|---|---|---|---|---|
| Acajete | 5 693 547 | 252 | 9 | 80 |
| Chiautzingo | 9 104 035 | 368 | 5 | 68 |
| Huejotzingo | 13 386 989 | 396 | 5 | 82 |
| Puebla | 31 747 473 | 940 | 8 | 250 |
| San Martin Texmelucan | 8 759 151 | 309 | 9 | 63 |
| San Salvador the Verde | 9 092 183 | 279 | 5 | 55 |
| Tecali of Herrera | 2 457 691 | 105 | 4 | 35 |
| Tepatlaxco of Hidalgo | 3 451 513 | 153 | 1 | 54 |
| Tlahuapan | 19 660 586 | 907 | 14 | 187 |
| Total sample | 103 353 168 | 3 709 | 60 | 874 |
| Percentage of the sample with respect to the total | 80% | 78% | 48% | 77% |
| Total | 129 973 628 | 4753 | 124 | 1142 |
Source: elaborated in 2017.
On the other hand, as shown in Table 5, with respect to the members with outstanding balance to be paid, that is to say in the past due portfolio, there were 321, with a total of 532 credits, with a total capital amount of $16 564 899.00 pesos, with an interest of $7 587 301.00 pesos. The amount of the overdue portfolio represents 13% of the total dispersed in the analysis period this situation reflects the little follow-up that the UCMPP gave to the credits granted. Díaz (2011) mentions that the process of supervision and follow-up is intentional in order to anticipate incidents in the portfolio, making visits, calls and information requirements to the borrower, to supervise the use of credit -management of business- continuity and solidity in their activities, as well as their roots.
Table 5 Expired portfolio of UCMPP members.
| Municipality | Capital | Interest | Mora | Credit | Community | Partner |
|---|---|---|---|---|---|---|
| Acajete | 671 328 | 218 348 | 493 340 | 31 | 5 | 19 |
| Chiautzingo | 324 951 | 102 614 | 28 986 | 7 | 4 | 7 |
| Huejotzingo | 1 179 965 | 481 162 | 443 757 | 31 | 5 | 19 |
| Puebla | 4 755 297 | 2 073 698 | 3 483 515 | 140 | 5 | 85 |
| San Martin Texmelucan | 717 338 | 100 154 | 1 276 938 | 26 | 6 | 17 |
| San Salvador the Verde | 2 364 164 | 1 731 250 | 1 313 241 | 38 | 5 | 25 |
| Tecali of Herrera | 72 106 | 22 295 | 6 545 | 4 | 2 | 4 |
| Tepatlaxco of Hidalgo | 464 847 | 105 771 | 68 263 | 15 | 1 | 11 |
| Tlahuapan | 4 228 251 | 2 169 688 | 1 885 642 | 143 | 11 | 80 |
| Total sample | 14 77 247 | 7 004 980 | 9 000 227 | 435 | 44 | 267 |
| Percentage of the sample with respect to the total | 89% | 92% | 87% | 81% | 62% | 83% |
| Total | 16 564 899 | 7 587 301 | 10 387 882 | 532 | 71 | 321 |
Source: elaborated in 2017.
Conclusions
The objective of this research was to analyze the distribution of credits made by the Credit Union ‘Mixta Plan Puebla’ from the period 1993 to 2005. The hypothesis was that the credit was allocated to the municipalities of rural areas with high marginalization, high migration and areas dispersed rural. However, the results allowed to reject the hypothesis, since the opposite effect was found. The impact in rural areas of the ‘Mixta Plan Puebla’ credit union was low, due to the fact that 61% of its loans were granted to urban communities with medium marginalization, with rurality level: ‘semi-urban-urban’ and low migration.
Therefore, the granting of loans by UCMPP should be extended to rural communities with a high degree of marginalization and poor accessibility, as Deugd et al. (2006), there is a strong demand for financial services, especially in the rural sector; as well as the lack of financial intermediaries to cover said demand; the commercial banking system has a limited interest in the sector; and it only operates in it when there are subsidies from the State. However, this must be accompanied by technical assistance, technological support, training in administrative services for organization and marketing, including financial education for producers in the rural sector.
It is necessary to follow the credits of the partners that are part of the Credit Union ‘Mixta Plan Puebla’, as well as to implement financial education courses as indicated by Amezcua et al. (2014), if you do not have an adequate financial culture, you will have problems in the scarce or no use of financial products and services; in bad habits at the moment of acquiring them, in the ignorance of their rights and obligations, as well as in the lack of financial planning, which negatively impacts on their well-being and quality of life, at the same time that it does not help financial institutions to reach the levels of competitiveness required and that the economic development of the country be promoted.
Literatura citada
Almeraya, Q. S. X. 2011. Propuesta para la distribución de créditos en el medio rural mexicano Universidad Politécnica de Madrid, . [ Links ]
Amezcua, G. E. L.; Arroyo, G. M. G y Espinosa, M. F. 2014. Contexto de la educación financiera en México. Ciencia Administrativa. 1:21-30. [ Links ]
BANXICO. 2017. Banco de México. El crédito en México. http://www.banxico.org.mx. [ Links ]
Buchenau, J. y Del Angel, G. A. 2007. Servicios financieros rurales en México. Informe de consultoría. Políticas y gasto público federal para el sector rural. Banco Interamericano de Desarrollo. http://cide-osu.cide.edu/sample%20website/pagina%20web/3.documentos/buchenau%20y%20del%20angel%20-%20mexico%20finanzas%20rurales%20-%20iadb.pdf. [ Links ]
CONEVAL. 2014. Consejo Nacional de Evaluación de la Política de Desarrollo Social. Medición de la pobreza. http://www.coneval.org.mx. [ Links ]
CONAPO. 2011. Consejo Nacional de Población. Concepto y dimensiones de la marginación. http://www.conapo.gob.mx/work/models/conapo/resource/1755/1/images/01capitulo.pdf. [ Links ]
Deugd, M.; Villalobos, I. y Vuskovic, P. 2006. Políticas públicas y servicios financieros rurales en México. Centro de estudios para el desarrollo rural. http://unpan1.un.org/intradoc/groups/public/documents/icap/unpan027964.pdf. [ Links ]
Díaz, M. 2011. Mejores prácticas de crédito. Deloitte. https://www2.deloitte.com/content/dam/Deloitte/mx/Documents/risk/Gobierno-Corporativo/presentacion-mejores-practicas-credito.pdf. [ Links ]
ENA. 2014. Encuesta Nacional Agropecuaria 2014. México, DF. INEGI. [ Links ]
FAO. 2011. Organización de las Naciones Unidas para la Agricultura y la Alimentación. Política de la FAO sobre pueblos indígenas y tribales. http://www.fao.org/docrep/013/i1857s/i1857s.pdf. [ Links ]
FND. 2016. Financiera Nacional de Desarrollo Agropecuario Rural, Forestal y Pesquero. Acciones y programas. http://www.gob.mx/fnd. [ Links ]
García, R. 2007. Migración internacional, remesas y desarrollo en México al inicio del siglo XXI. In: Leite, P.; Zamora, S. y Acevedo, L. (Eds.). Migración internacional y desarrollo en América Latina y el Caribe. Consejo Nacional de Población (CONAPO). México, DF. 275-316 pp. [ Links ]
INEGI. 2007. Instituto Nacional de Estadística y Geografía. Censo Agrícola, Ganadero y Forestal. http://www.inegi.org.mx. [ Links ]
Muños, R. M.; Santoyo, C. H. y Altamirano, C. R. 2002. Mercados e instituciones financieras rurales: una nueva arquitectura financiera rural para México. Universidad Autónoma de Chapingo (UACH). Estado de México. [ Links ]
OCDE. 2007. Organización para la Cooperación y el Desarrollo Económicos. Estudios de política rural México. http://www.oecd.org/centrodemexico/medios/39076610.pdf. [ Links ]
PNUD. 2016. Programa de las Naciones Unidas para el Desarrollo. Informe sobre Desarrollo Humano. Communications Development Incorporated. Washington DC. Estados Unidos. http://hdr.undp.org/sites/default/files/hdr2016-sp-overview-web.pdf. [ Links ]
Rajdeep, S. y Craig, P. A. 2008. La revolución de las microfinanzas: una visión general. Boletín del CEMLA. 64-83 pp. [ Links ]
Raphael, M. R. 2012. Reporte sobre la discriminación en México 2012: crédito. Consejo Nacional para prevenir la discriminación. México, DF. [ Links ]
Remigio, M. J. 2013. Finanzas populares en México. Universidad Nacional Autónoma de México. México. [ Links ]
Sobrino, J. 2010. Migración interna en México durante el siglo XX. CONAPO. México, DF. [ Links ]
Received: June 2018; Accepted: September 2018
 Este es un artículo publicado en acceso abierto bajo una licencia Creative Commons
