


Services on Demand
Journal
Article
 text in
  English (pdf)
 Article in xml format
 Article references
 Send this article by e-mail
Indicators
-
 Cited by SciELO
 -
 Access statistics
Related links
-
 Similars in
SciELO
Similars in
SciELO
Share

 Permalink
Revista mexicana de ciencias agrícolas
Print version ISSN 2007-0934
Rev. Mex. Cienc. Agríc vol.9 n.5 Texcoco Jun./Aug. 2018
https://doi.org/10.29312/remexca.v9i5.1510
Investigation note
Chemical control of linear rust at different stages of wheat development in Terrenate, Tlaxcala
1Autonomous University Chapingo. Highway Mexico-Texcoco km 38.5, Chapingo, Mexico. CP. 56230. Tel. 01(595) 9521674. (hldc@gmail.com; lsantos@correo.chapingo.mx; vargas-mateo@hotmail.com).
2Valley of Mexico Experimental Field-INIFAP. Highway Los Reyes-Texcoco km 13.5, Coatlinchán, Texcoco, State of Mexico. CP. 56250. Tel. 01(595) 9212715. (hortelano.rene@inifap.gob.mx; yr.valdez@hotmail.com; martinez.eliel@inifap.gob.mx).
In Mexico, the main production area for temporary wheat is located in the High Valleys of Central Mexico, where the linear rust (Puccinia striiformis f. sp. tritici Eriks) has become the main problem in recent years, being much more aggressive than leaf rust (Puccinia triticina Eriks). In order to know the most appropriate stage for the application of fungicides for the control of the disease, four commercial formulations and different protection strategies were used, seeking to expand the knowledge in the control of the linear rust in susceptible varieties and thus improve the production of bread wheat under temporary conditions. The present investigation was carried out during the spring-summer cycle, 2015 using the Nana F2007 variety in the municipality of Terrenate, Tlaxcala, Mexico. The best protection strategy was 2, which corresponds to the application of systemic fungicides 45 days after sowing (dds) and in anthesis (70 dds), which was associated with the highest yield. The fungicides that showed the best control over linear rust were the mixture of Axozistrobina+Propiconazole (QUILT®) and Tebuconazole (Folicur 250EW), with which the highest yield values and statistically similar effects were obtained. The results indicate that it is necessary to apply fungicides to control the disease, otherwise the yield losses could be 53% between strategies and up to 84% without application of fungicide.
Keywords: Puccinia striiformis f. sp. tritici; chemical control; protection strategy; yield losses
En México la principal zona productora de trigo de temporal está ubicada en los Valles Altos del Centro de México, donde la roya lineal (Puccinia striiformis f. sp. tritici Eriks) se ha convertido en el principal problema en los últimos años, siendo mucho más agresiva que la roya de la hoja (Puccinia triticina Eriks). Con el propósito de conocer la etapa más apropiada para la aplicación de fungicidas para el control de la enfermedad, se utilizaron cuatro formulaciones comerciales y diferentes estrategias de protección, buscando ampliar el conocimiento en el control de la roya lineal en variedades susceptibles y así mejorar la producción del trigo harinero en condiciones de temporal. La presente investigación se llevó a cabo durante el ciclo primavera-verano, 2015 utilizando la variedad Nana F2007 en el municipio de Terrenate, Tlaxcala, México. La mejor estrategia de protección fue la 2, que corresponde a la aplicación de fungicidas sistémicos a los 45 días después de la siembra (dds) y en antesis (70 dds), que se asoció con el mayor rendimiento. Los fungicidas que presentaron el mejor control sobre la roya lineal fueron la mezcla de Axozistrobina+Propiconazole (QUILT®) y Tebuconazole (Folicur 250EW), con los que se obtuvieron los valores más altos de rendimiento y efectos estadísticamente semejantes. Los resultados indican que es necesario realizar la aplicación de fungicidas para el control de la enfermedad, de lo contrario las pérdidas en rendimientos podrían ser de 53% entre estrategias y hasta 84% sin aplicación de fungicida.
Palabras clave: Puccinia striiformis f. sp. tritici; control químico; estrategia de protección; pérdidas en rendimiento
Wheat (Triticum aestivum L.) is the second cereal with the highest production in the world, after rice and above corn and barley (FAOSTAT, 2013). In Mexico, during 2014, production reached 3.7 million tons in an approximate area of 713 thousand hectares, which represents a value of 12 450 million pesos (SIAP, 2014). The main wheat region is located in the northwest, where 53% of the national total is produced, while The Bajio contributes 28%. In both regions, wheat is irrigated in the autumn-winter cycle (A-W) november-may, the remaining 19% occurs in rainfed areas, mainly in the Mexican Highlands (SIAP, 2014).
The main producing area of temporary wheat is located in the High Valleys of Central Mexico, which includes the states of Puebla, Hidalgo, Tlaxcala and State of Mexico, where production is affected by droughts, frosts and diseases caused by rust linear (Puccinia striiformis f. sp. tritici E.), leaf rust (P. triticina E.) and the foliar disease complex caused by Septoria sp., Cochleobolus sativum and Phyrenophora tritici-repentis (Villaseñor et al., 2012). Huerta and Singh (2000) indicated that leaf rust is the disease that has caused the greatest damage in wheat production in Mexico; however, yellow rust may become as important as leaf rust, as the spread of the disease has increased in recent years.
The objectives were to quantify the losses caused by linear rust in the Nana F2007 variety, establish the most efficient fungicide application strategy for the control of linear rust and compare the control of Azoxistrobina (PRIORI®), Tebuconazole (Folicur 250EW), Propiconazole (TILT® 25 EC) and Azoxistrobina+Propiconazole (QUILT®) for the control of linear rust at different stages of development.
Four protection strategies and four fungicides with one and two applications were evaluated depending on the time of development of the plant that was desired to be kept free of the pathogen (Table 1). The polymether polymethylsiloxane copolymer (Break Thru®) adjuvant was used in all treatments at a dose of 0.25 L ha-1.
Table 1 Strategies and treatments evaluated in the variety NANA F2007, Terrenate, Tlaxcala. SS 2015.
| Large plot (strategies) | Small plot (fungicides) | Tradename | Dose (L ha-1) |
|---|---|---|---|
| (1) One application (45 days after planting) | Azoxystrobin | PRIORI® | 0.4 |
| Tebuconazole | Folicur® 250 EW | 0.5 | |
| Propiconazole | TILT® 25 EC | 0.5 | |
| Azoxystrobin + Propiconazole | QUILT® | 0.8 | |
| (2) Two applications (45 days after sowing and in anthesis) | Azoxystrobin | PRIORI® | 0.4 |
| Tebuconazole | Folicur® 250 EW | 0.5 | |
| Propiconazole | TILT® 25 EC | 0.5 | |
| Azoxystrobin + Propiconazole | QUILT® | 0.8 | |
| (3) One application (in embuche) | Azoxystrobin | PRIORI® | 0.4 |
| Tebuconazole | Folicur® 250 EW | 0.5 | |
| Propiconazole | TILT® 25 EC | 0.5 | |
| Azoxystrobin + Propiconazole | QUILT® | 0.8 | |
| (4) Two applications (in embuche and 20 days later) | Azoxystrobin | PRIORI® | 0.4 |
| Tebuconazole | Folicur® 250 EW | 0.5 | |
| Propiconazole | TILT® 25 EC | 0.5 | |
| Azoxystrobin + Propiconazole | QUILT® | 0.8 |
For this experiment the variety Nana F2007, which is susceptible to yellow rust (Villaseñor et al., 2016) was used at a planting density of 110 kg ha-1, was fertilized just before planting and the weeds were controlled in a timely manner. A treatment design was used in plots divided into complete blocks at random with 3 replications, where the large plot was the protection strategy and the small plot was the fungicides. The experimental plot was 4 rows spaced at 30 cm by 3 meters in length.
Data were recorded from days to flowering (DF), days to maturity (DM), plant height in cm (AP) and grain yield (REND) in kilograms per hectare. In total, six readings of linear rust on the leaf and a linear rust reading on the spike were made. The area under the disease progression curve (ABCPE) was calculated with the data from the linear rust readings. The 50 stems were sampled and different formulas were used (Solís et al., 2007) to determine the weight of a thousand grains (PMG) in grams, biological yield (RB50T) in grams, grain filling rate (TLLG), harvest (IC), biomass (BIOM) in grams, spikes per square meter (EPM2), grains per square meter (GPM2) and grains per spike (GPE). The harvest was done mechanically using an experimental combination (WINTERSTEIGER). The data was analyzed with that of the Statistical Analyzes System Ver. 9.2 program (SAS, 2010).
In the Table 2 presents the analysis of variance of the 14 variables evaluated, where it is observed that the coefficients of variation were low, which will allow to generate precise conclusions. A highly significant difference was detected for protection strategy for DM, REND, PMG, RE50T, RB50T, TLLG, GPM2, GPE and ABCPE and significant difference in the variables DF, AP, IC, BIOM and EPM2. For the case of the fungicide formulations, a highly significant difference was detected for the variables REND, PMG, TLLG and GPM2 and significant difference for the DM, BIOM, EPM2 and ABCPE variables (Table 2).
Table 2 Analysis of general variance shows the mean squares and their significance.
| Source | gl | DF | DM | AP | REND | PMG | RB50T | RE50T |
|---|---|---|---|---|---|---|---|---|
| ESTR | 3 | 2.38* | 99.69** | 336.9* | 6 728 352.8** | 325.1** | 6 058.72** | 3 669** |
| BLOQ | 2 | 0.64* | 1.39ns | 6.39ns | 46 191.92ns | 4.2ns | 474.02* | 37.77ns |
| ERROR A | 6 | 0.36 | 0.59 | 46.86 | 25 369.3 | 2.15 | 210.9 | 55.1 |
| FUNG | 3 | 0.05ns | 4.75* | 12.4ns | 961 462.97** | 34.31** | 75.38ns | 108.22ns |
| ESTR*FUNG | 9 | 0.11ns | 0.95ns | 31.31* | 49 901.67ns | 3.23ns | 135.62ns | 110.7ns |
| Error B | 24 | 0.15 | 0.65 | 10.27 | 53 359.64 | 2.13 | 114.79 | 60.02 |
| Total | 47 | |||||||
| Average | 64.58 | 128.79 | 86.89 | 1 848.24 | 36.65 | 153.91 | 65.33 | |
| CV | 0.61 | 0.62 | 3.68 | 12.49 | 3.98 | 6.96 | 11.85 | |
| Source | TLLG | IC | BIOM | EPM2 | GPM2 | GPE | ABCPE | |
| ESTR | 1 294.72** | 0.03* | 16 991 014.83* | 4 078.87* | 37 214 638.6** | 778.6** | 1 329 136.01** | |
| BLOQ | 7.44ns | 0.001ns | 1 131 891.61ns | 244.8ns | 815 741.8 ns | 29.47ns | 147 929.81* | |
| ERROR A | 6.05 | 0.003 | 1 176 703.71 | 747.39 | 139 178.3 | 19.23 | 125 167.13 | |
| FUNG | 205.04** | 0.002ns | 3 924 868.85* | 3 641.53* | 3 279 616.8** | 5.33ns | 208 819.35* | |
| ESTR*FUNG | 9.38ns | 0.003ns | 785 314.2ns | 505.85ns | 239 739.2ns | 44.13ns | 83 702.01* | |
| Error B | 12.94 | 0.002 | 768 154.18 | 701.68 | 429 645 | 26.11 | 29 021.14 | |
| Total | ||||||||
| Average | 28.5 | 0.42 | 4 411.35 | 141.37 | 5 016.36 | 35.47 | 1 887.15 |
gl= degrees of freedom; ESTR= strategy; BLOQ= repetition; FUNG= fungicides; ESTR*FUNG= interaction between the protection strategy and the products; CV= coefficient of variation; DF= days to flowering; DM= days to maturity; AP= plant height; REND= grain yield; PMG= weight of a thousand grains; RB50T= biological yield of 50 stems; RE50T= economic yield of 50 stems; ns= not significant; *= significant and; **= highly significant.
ESTR= strategy; BLOQ= repetition; FUNG= fungicides; ESTR*FUNG= interaction between the protection strategy and the products; CV= coefficient of variation TLLG= grain filling rate; IC= harvest index; BIOM= biomass; EPM2= spikes per square meter; GPM2= grains per square meter; GPE= grains per spike; ABCPE= area under the curve of disease progression; ns= not significant; *= significant and; **= highly significant.
For protection strategies, the highest return corresponded to strategy 2; that is, two applications were made, the first 45 days after sowing and the second one in anthesis reaching a yield of 2 966 kg ha-1 (Table 3), followed by strategies 4, 3 and 1, with yields of 1 566, 1 468 and 1 391 kg ha-1 (Figure 1), with a minimum yield difference of 1 400 kg ha-1 between strategy 2 and strategy 4. Strategy 2 also showed higher values in the Most of the evaluated agronomic variables indicate that it was the best strategy to minimize the damage caused by the linear rust.
Table 3 General behavior of the variables evaluated by protection period and by fungicide.
| Term | REND | DF | DM | AP | PMG | RB50T | RE50T |
|---|---|---|---|---|---|---|---|
| ESTR2 | 2 966.26 a | 64.08 c | 131.33 a | 90.58 a | 38.96 b | 187.16 a | 90.58 a |
| ESTR4 | 1 566.84 b | 65 a | 131.08 a | 81.25 b | 42.4 a | 144.41 b | 63.08 b |
| ESTR3 | 1 468.47 bc | 64.91 ab | 127.25 b | 83.58 b | 34.93 c | 137.75 b | 51.58 c |
| ESTR1 | 1 391.39 c | 64.33 bc | 125.5 c | 92.16 a | 30.33 d | 146.33 b | 56.08 bc |
| LSD | 159.11 | 0.6 | 0.76 | 6.83 | 1.46 | 14.5 | 7.41 |
| Quilt | 2 109.77 a | 64.58 a | 129.66 a | 88.33 a | 38 a | 153.25 a | 65.83 ab |
| Folicur | 2 026.89 a | 64.5 a | 128.83 b | 86 a | 38.2 a | 156.16 a | 69.16 a |
| Tilt | 1 775.08 b | 64.66 a | 128.33 b | 86.41 a | 35.56 b | 155.58 a | 64.33 ab |
| Priori | 1 481.23 c | 64.58 a | 128.33 b | 86.83 a | 34.86 b | 150.66 a | 62 b |
| LSD | 194.63 | 0.33 | 0.68 | 2.7 | 1.23 | 9.02 | 6.52 |
| Term | TLLG | IC | BIOM | EPM2 | GPM2 | GPE | ABCPE |
| ESTR2 | 44.07 a | 0.48 a | 6 182.2 a | 165.78 a | 7 599.5 a | 46.43 a | 1 431.1 b |
| ESTR4 | 23.7 b | 0.43 ab | 3 629.8 b | 125.32 b | 3 682.9 d | 29.52 c | 2 137.5 a |
| ESTR3 | 23.55 b | 0.37 cb | 3 993.2 b | 145.3 ab | 4 201.9 c | 29.32 c | 2 132.3 a |
| ESTR1 | 22.7 b | 0.38 c | 3 840.2 b | 129.1 b | 4 581.2 b | 36.63 b | 1 847.7 a |
| LSD | 2.45 | 0.061 | 1 083.6 | 27.31 | 372.67 | 4.38 | 353.42 |
| Quilt | 32.07 a | 0.42 a | 4 964.5 a | 160.46 a | 5 510.3 a | 34.5 a | 1 744.38 c |
| Folicur | 31.26 a | 0.44 a | 4 597.9 a | 145.68 a | 5 268.8 a | 36 a | 1 814.46 bc |
| Tilt | 27.68 b | 0.41 a | 4 469.8 a | 140.95 a | 4985 a | 35.8 a | 2 035.63 a |
| Priori | 23 c | 0.4 a | 3 613.2 b | 118.41 b | 4 301.4 b | 35.6 a | 1 954.17 ab |
| LSD | 3.03 | 0.04 | 738.48 | 22.31 | 552.29 | 4.3 | 143.54 |
DF= days to flowering; DM= days to maturity; AP= plant height; REND= grain yield; PMG= weight of a thousand grains; RB50T= biological yield of 50 stems; RE50T= economic yield of 50 stems.
TLLG= grain filling rate; IC= harvest index; BIOM= biomass; EPM2= spikes per square meter; GPM2= grains per square meter; GPE= grains per spike; ABCPE= area under the curve of disease progression.
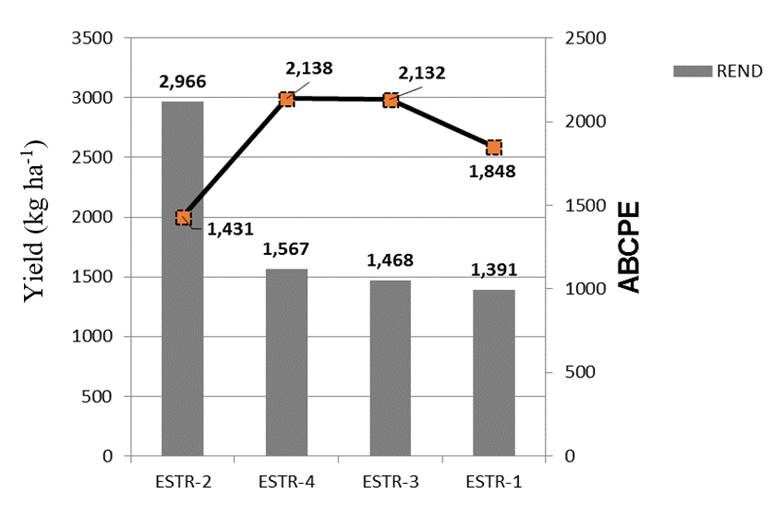
Figure 1 Performance behavior and the area under the curve of the progress of the disease with respect to the control strategies.
The variable ABCPE is the indicator in the present study to determine the efficiency in the control of the disease, in Table 3 we present the means by strategy for this variable where it is observed that strategy 2 obtained the lowest value, in the Figure 2, the protection strategy 2 is plotted, where it is observed that applying fungicide at 45 days + anthesis allowed to keep the plant practically protected throughout the cycle, which was associated with minimal losses in performance.
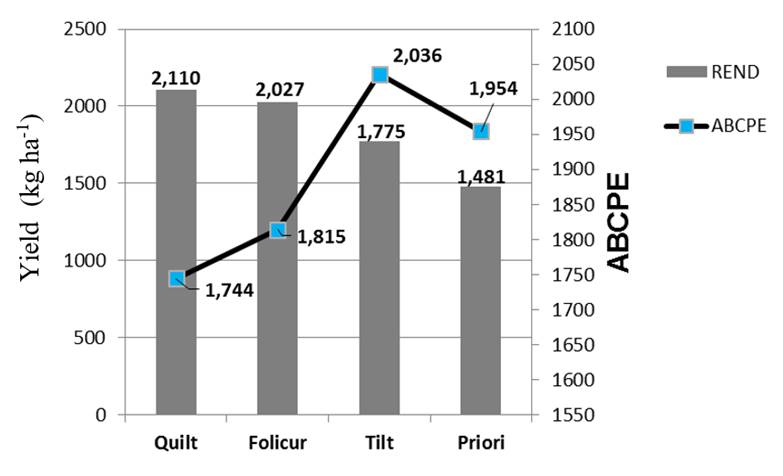
Figure 2 Performance behavior and area under the curve of disease progression with respect to fungicides.
Strategy 4, in which the applications were made in anthesis and 20 days later, showed 47% less performance compared to strategy 2. The difference between the two strategies was due to the fact that in 2 the plant was kept in stages important development, or failing the strategy allowed the disease caused minimal damage to the foliar area (Figure 3). On the other hand, strategy 1 sought with an application to protect during early stages of development; that is to say, that did not reach critical levels, applying to 45 days and strategy 3 considered with an application to protect in intermediate stages of growth, applying in embuche (65 days) and neglecting early stages of development of the plant, with these strategies the difference was 50% and 53% less performance compared with the best strategy.
Hortelano et al. (2014) report that the reduction in yield caused by the linear rust was only 7% (200 kg ha-1) in the Nana F2007 variety, while with the present investigation it was determined that in this variety it is necessary to make two applications of fungicides for the control of the linear rust and thus minimize the losses caused by the disease that can be up to 84% when the plant is not protected.
For fungicides (small plots) the highest yield corresponded to Axozystrobin+Propiconazole reaching a yield of 2 110 kg ha-1 (Table 3), followed very closely by Tebuconazole with a yield of 2 027 kg ha-1, which statistically not there was a difference between the products; in the second instance, Propiconazole and Azoxystrobin were located with a yield of 1 775 and 1 481 kg ha-1, respectively, registering a difference of up to 30% (Figure 2), due, among other reasons, to the fact that in these last two fungicides the progress of the disease (leaf damage) was greater. The loss in yield in Nana F2007 when it was not protected with fungicide was 84% (control).
The agronomic behavior of the variety, for protection strategies, showed differences in DF, DM and AP. Earling was recorded in less time in strategy 2; physiological maturity was recorded in strategy 1 at 125 days, the biological cycle was shortened by 2 days if compared with strategy 3 and with a difference of 6 days compared to strategies 2 and 4 (Table 3). Solís (1996) indicated that as the severity of the rust increases in the genotypes, the reduction of the cycle can be up to 15 days in susceptible varieties.
For the PMG, strategy 4 registered the highest weight due to the fact that the linear rust did not colonize the inflorescence of the wheat plant and cause a decrease in yield, similar to strategy 2, since both were protected in stages Criticisms such as embuche a antesis or antesis to fill grain (Tables 1 and 3).
According to Gaunt in 1995 (cited by Solís, 1996) the lesions caused by the rust reduce the photosynthetic area of the leaves, which intercept less solar radiation and produce less assimilated resulting in a lower biomass. The IC and BIOM both components had lower expression due to the effect caused by the presence of rust, which indicates that the other components also suffered a reduction with respect to the progress of the disease (Figures 1 and 2).
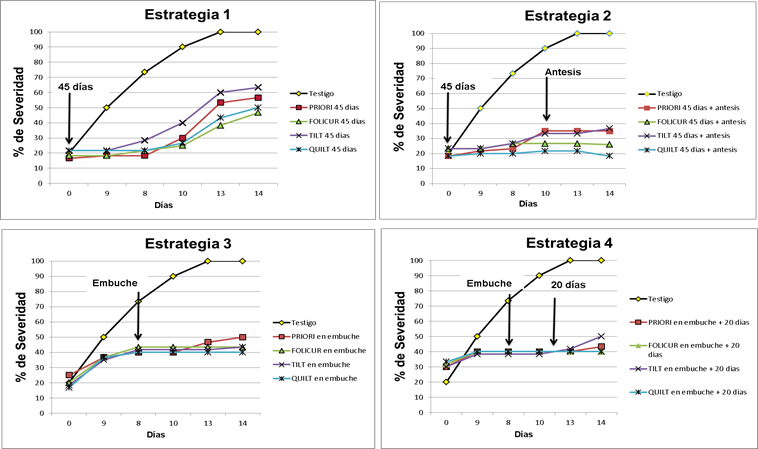
Figure 3 shows the behavior of the fungicides in the four protection strategies. In strategy 1 it is observed that from the third reading of rust the Propiconazole begins to lose its effect, in the fourth reading the protection of the fungicide was completely lost, the rust returned to infect the plant and the infection was fired reaching 60% severity. In strategy 2 the protection of Axozystrobin and Propiconazole was lost between 17-20 days after application, at 27 days the fourth reading was made and coincided with the second fungicide application which caused the plants to remain protected during practically the whole cycle. In strategy 3 it was applied after making the third reading, the percentage of severity at the time of application was 40% and at the end of the 50% cycle. In strategy 4 it was very similar to strategy 3, the behavior of the fungicides was the same throughout the crop cycle with the exception of Propiconazole, which in the last reading reached 50% severity.
Conclusions
The yield loss caused by the linear rust when it was not applied was 84%. The best control strategy was 2, which indicates that it is important not to allow the disease to establish itself and progress in early stages of growth, for which it will be necessary to make the first application around 40 days and the second between 20 a 25 days later, depending on how the infection of the disease starts again.
Do not protect the plant with two applications of fungicide between the stem and the head, can cause losses up to 50%, despite an application is made after 40 days or the embuche, or two applications from embuche to grain filling.
The most efficient fungicides for the control of yellow linear rust were the mixture of Azoxistrobina+Propiconazole (QUILT®) and Tebuconazole (Folicur 250EW). There is an important difference between the molecules used for pathogen control.
Literatura citada
FAOSTAT (Food and Agriculture Organization of the United Nations), 2013. FAO Statistical Database. Food and Agriculture Organization of the United Nations: http://faostat3.fao.org/home/E. [ Links ]
Hortelano, S. R.; Villaseñor, M. H. E.; Martínez, C. y Espitia, R. E. E. 2014. Control químico de roya amarilla en trigo harinero de temporal en los Valles Altos de México. Ciencia y Tecnol. Agrop. México. 2(2):38-44. [ Links ]
Huerta, E. J. y Sing, R. 2000. Las royas del trigo. In: el trigo de temporal en México. Villaseñor, M. H. E. y Espitia, R. E. SAGAR, INIFAP, CIR- CENTRO y CEVAMEX. México. 231-251 pp. [ Links ]
SAS Institute (Statistical Analysis System). 2010. SAS systems for information delivery for Windows. Release 9.2. Cary, North Caroline. USA. [ Links ]
SIAP (Servicio de información Agroalimentaria y Pesquera). 2014. Servicio de Información Agroalimentaria y Pesquera SAGARPA. México. Disponible en http://www.siap.sagarpa.gob.mx/. [ Links ]
Solís, M. E. 1996. Efecto de la roya de la hoja sobre cinco genotipos de trigo harinero Triticum aestivum L. en El Bajío, México. Agric. Téc. Méx. 22:51-62. [ Links ]
Solís, M. E., Huerta, E. J., Villaseñor, H. E. E. y Aguado, S. A. G. 2007. Roya lineal, fenología, rendimiento y sus componentes en trigo harinero (Triticum aestivum L.). Agrociencia. 41:563-573. [ Links ]
Villaseñor, M. H. E.; Hortelano, S. R.; Martínez, C. E.; Mariscal, A. A. L.; Leyva, M. S. G. y Huerta, E. J. 2012. Control químico de las enfermedades: una alternativa para la producción de trigo de temporal en Tlaxcala. Rev. Mex. Cienc. Agríc. 3(3):595-600. [ Links ]
Villaseñor, M. H. E.; Huerta, E. J.; Hortelano, S. R. R.; Martínez, C. E.; Espitia, R. E.; García, L. E.; Pérez, H. P.; Rodríguez, C. M. E.; Valdez, R. Y. R.; Díaz, C. H. L.; Rodríguez, G. M. F. y Zamudio, C. A. 2016. Nuevas variedades de trigo para incrementar la productividad y producción en México. III Reunión estatal de investigación científica y tecnológica Campo Experimental Valle de México. INIFAP-CIRCE-CEVAMEX. Coatlinchán, Estado de México. Memoria técnica núm. 3. [ Links ]
Received: May 2018; Accepted: June 2018
 Este es un artículo publicado en acceso abierto bajo una licencia Creative Commons
