


Servicios Personalizados
Revista
Articulo
 texto en
  Inglés (pdf)
 Artículo en XML
 Referencias del artículo
 Enviar artículo por email
Indicadores
-
 Citado por SciELO
 -
 Accesos
Links relacionados
-
 Similares en
SciELO
Similares en
SciELO
Compartir

 Permalink
Revista mexicana de ciencias agrícolas
versión impresa ISSN 2007-0934
Rev. Mex. Cienc. Agríc vol.9 no.4 Texcoco mar./jun. 2018
https://doi.org/10.29312/remexca.v9i4.1398
Articles
Analysis of the extension component SAGARPA-INIFAP (2016) in Northern Mexico
1La Campana Experimental Site-INIFAP. Highway Chihuahua-Ojinaga km 33.3, Chihuahua, Mexico. CP. 32190.
2CENID-Microbiology-INIFAP. Blvrd Reforma km 15.5, Zedec Sta Fé, Mexico City, Mexico. CP. 01219.
An analysis of the extension component SAGARPA-INIFAP (2016) is presented in the northern states of Mexico, in relation to value chains or agricultural and fishing/aquaculture species; as well as the target population, territorial distribution, institutional infrastructure of INIFAP, within the North Regional Extension Center (BC, BCS, Coah, Chih, Dgo, NL, Sin, Son, Tam and Zac). The INIFAP and the SAGARPA signed an agreement in May 2016, to support the extension strategy, through training, innovation, monitoring and technical support to extension agents and small producers in the methodological and technical training of innovations. Monthly from May to December, the meetings of the component GT in the states and the GEIT meetings were attended. Five regional meetings of the Northern CRE were organized to monitor and plan the strategy. It is necessary that the GT of the states improve their planning process according to their diagnostic characteristics, which focus the services on: the target population, chains or priority product systems of the region, as well as training needs in the most demanded priority innovations or bottleneck in the UER.
Keywords: productive chains; poverty; rural development; technological innovation
Se presenta un análisis del componente extensionismo SAGARPA-INIFAP (2016) en los estados del norte de México, en relación a cadenas de valor o especies agropecuarias y de pesca/acuacultura; así como población objetivo, distribución territorial, infraestructura institucional del INIFAP, dentro del centro regional de extensionismo Norte (BC, BCS, Coah, Chih, Dgo, NL, Sin, Son, Tam y Zac). El INIFAP y la SAGARPA firmaron un convenio en mayo de 2016, para apoyar la estrategia de extensionismo, a través de la capacitación, innovación, seguimiento y acompañamiento técnico a extensionistas y pequeños productores en la formación metodológica y técnica de las innovaciones. Mensualmente de mayo a diciembre se asistió a las reuniones del GT del componente en los estados y a las reuniones GEIT. Se organizaron 5 reuniones regionales del CRE Norte para seguimiento y planeación de la estrategia. Es necesario que los GT de los estados mejoren su proceso de planeación acorde con sus características diagnósticas, que enfoquen los servicios a: la población objetivo, cadenas o sistemas productos prioritarios de la región, así como las necesidades de capacitación en las innovaciones prioritarias más demandadas o cuello de botella en las UER.
Palabras clave: desarrollo rural; pobreza; cadenas productivas; innovación tecnológica
Introduction
The new approach to agricultural production is conceived from a multifunctional point of view. In this sense, the operative work of the extension worker passes from the production unit to the locality (region), where very diverse relations of exchange are maintained, in addition to the cultural ones. Then a profile is proposed for the extensionist in four dimensions: 1) anthroposocial; 2) institutional politician; 3) economic; and 4) environmental (Méndez, 2006). Therefore, the extension worker should facilitate the interaction between different actors that facilitate the good living of the producers (Rodríguez et al., 2009), creating conditions that favor the rural development of a region, more than productivity (Rendón-Medel et al., 2015). Then, according to Janvry and Sadoulet (2004), the region can be from: the municipality for the purpose of government and public goods, ad hoc associations for the municipalities, regions as larger administrative units and functional economic regions (resources natural, diversified employment or unit of social capital.) The elements of territorial rural development would be: giving added value to underutilized local resources, integrating rural and urban activities, constructing the institutional, productive, social dimensions (incorporation of the poor) and markets
In Mexico, the main problem of the agricultural and fishing sector is unsustainable development, with more than 70% of the population living in poverty, low productivity at self-consumption levels and little commercial exchange of surplus production, as well as the degradation of natural resources that it uses (SAGARPA- FAO, 2014). The main causes are the low adoption and implementation of technologies in agricultural and fishing production, low investment in infrastructure and equipment for production, as well as the low level of education (Rendón et al., 2015).
In northern Mexico, there are three of the five municipalities with the highest degree of marginalization; first and fifth in Chihuahua (Batopilas and Carichi, respectively) and second in Durango (Mezquital). However, at the state level, the degree of marginalization is low for Chihuahua and half for Durango. At the national level, the degree of municipal marginalization is higher where there is a greater indigenous population (CONAPO, 2015). The public policies developed in Mexico for the reduction of poverty of the last 30 years, have not obtained the expected results in: returns, organization and introduction to new markets, among others (Rendon-Medel et al., 2015). The incorporation of Mexico into the North American Free Trade Agreement (NAFTA) has not had the expected success in the agricultural sector (1992-2012), due to the asymmetries in productivity of natural resources, technology and infrastructure.
In relation to poverty and the total quarterly current income of Mexican households in 2015, it was $1 524 262.5 million and 13.1% corresponded to rural areas (INEGI, 2016). The distribution of income by deciles of households, indicates that the highest income (Nuevo Leon) received on average 19.8 times more income than households with lower average income decile (Chiapas). However, when considering the survey in localities of less than 2 500 inhabitants, this proportion increases to 21.5 times and in localities with more than 2 500 inhabitants, the proportion decreases to 19.05. This indicates that poverty in rural areas is more extreme than in cities and by income, strata I and II of rural economic units (UER), would be within the first decile (SAGARPA-FAO, 2014). Although, the urban poor population has grown at a faster pace than the rural population, this is due to the migration of these to the cities (Janvry and Sadoulet, 2004).
Because the institutions and extensionists must adapt to the needs of each of the production units (UER) in which they are involved (Rendón-Medel et al., 2015), this paper presents an analysis of the extension component SAGARPA - INIFAP (2016) in the northern states of Mexico, in relation to agricultural and fishing/aquaculture value chains; as well as the target population, territorial distribution, institutional infrastructure of INIFAP, within the regional extension center (CRE) North. To observe the fulfillment of the objective of generating conditions to “increase agrifood production”, proposed in the 2016 operating rules of SAGARPA in the extension component (DOF, 2015).
Materials and methods
The INIIFAP and SAGARPA, signed a collaboration agreement on May 11, 2016, with the objective of supporting it in the development of the extension component. Through the formation of four regional extension centers (CRE) within the institutional structure of INIFAP. The northern regional extension center (CRE Norte INIFAP-SAGARPA) was established at the Campana Experimental Site, in Aldama, Chih. It encompassed 10 states (Baja California [BC], Baja California Sur [BCS], Chihuahua [Chih], Coahuila [Coah], Durango [Dgo], Nuevo Leon [NL], Sinaloa [Sin], Sonora [Son], Tamaulipas [ Tam] and Zacatecas [Zac]) and the Laguna Region, the latter from the operating point of SAGARPA. The INIFAP, operated in the region of the Northern CRE with a total of 31 administrative infrastructures (15 experimental fields, 14 experimental sites and two business sites) for the training of producers, extension agents and students.
In the region 107 researchers participated, 66 in continuous accompaniment from May 2016 to February 2017 and 41 only as trainers to extension agents and producers. For the follow-up to the strategy of the Northern CRE INIFAP, five regional and two national meetings were held, as well as seven visits to states that presented problems in the development of the strategy.
In each of the states participated in the working groups (GT) of extension. These were constituted by planning sub-delegation of SAGARPA, Rural Development of the state government, technical SINACATRI-INCA Rural, extension coordinator in the state by INIFAP, representative of the rural innovation extension center (CEIR), among others.
Once the state GT were established, the state strategic plan for the component was elaborated based on the goals and productive indicators of each state, as well as the alignment with the governing documents issued by the Mexican Government (National Development Plan 2013-2018, Sectorial Program of Agricultural, Fishing and Food Development 2013-2018, Law of Sustainable Rural Development, among others). Each entity formed several groups of territorial innovation extension agents (GEIT), integrated by a GEIT coordinator, extension agents, producers, technical assistant of INIFAP for the accompaniment in the implementation of technological innovations, technical assistant of the rural innovation extension center (CEIR) University (accompanying the training processes of the extensionists). In general, GEIT meetings were held once a month from June to December 2016, and in some states until February 2017, according to the date of completion of the component in the state.
Results and discussion
The diagnosis of FAO (2014) in Mexico reports 5 325 223 UER. For the Northern CRE 166 884 UER of the E1 were estimated; 339 789 of stratum E2 and 101 303 of stratum E3. Both in the northern region and at the national level, the stratum with the highest number of UER is E2; however, there is a better ratio of UER E1 vs E3. That is, at the regional level 1.6 UER of E1 are presented for each UER of E3, while at the national level the ratio is 2.6 UER of E1 for each UER of E3. The states with the highest UER percentage of E1 are: Zac (20%), Chih (20%) and Sin (11.4%), which together represent 51.4%. In the Northern CRE, the states with the highest number of UER of strata E1, E2 and E3 are: Zac, Chih and Dgo; while the smallest number is in BC and BCS.
Distribution by UER status. The states with the highest percentages of self-consumption UER (E1) were: NL, Coah, BC and Chih, with values of 30.3, 27.9, 25 and 25%, respectively, with an average in the Northern CRE of 20.15% (Table 1). For E2, with a market share of less than 55 thousand pesos per year, were the states of Zac, Dgo and Coah, with values of 54, 45, and 42%, respectively, with an average of 33.9% in the Northern CRE. The states with the highest percentages in the subsistence strata (E1 and E2) were: NL, Zac and Dgo, with percentages of 70.3, 70 and 60.8%, respectively, where the regional average value (CRE North) was 54%.
Table 1 Percentage of rural economic units (UER) by state, number of extension agents (Ext’s) and EBU E1, E2 and E3, in the Northern CRE (FAO, 2013).
| State | Strata of UER (%) | Sum UER E1, E2, E3 |
Ext’s | Proportion UER/Ext’s |
|||||
| E1 | E2 | E3 | E4 | E5 | E6 | ||||
| Subsistence | Transition | Business | |||||||
| BC | 25 | 14.2 | 7 | 19.4 | 30.6 | 3.9 | 8 792 | 86 | 102.2 |
| BCS | 22 | 33.3 | 10.9 | 13 | 19.3 | 1.4 | 10 738 | 31 | 346.4 |
| Coah | 27.9 | 45.1 | 8.9 | 8.8 | 8.2 | 1 | 48 963 | 64 | 765 |
| Chih | 25 | 30.3 | 9.9 | 13.9 | 19.8 | 1.1 | 87 099 | 118 | 738.1 |
| Dgo | 18.6 | 42.2 | 12.5 | 14.5 | 11.8 | 0.4 | 75 050 | 135 | 555.9 |
| NL | 30.3 | 40 | 7.5 | 8.9 | 12.3 | 1 | 36 721 | 63 | 582.9 |
| Sin | 11.6 | 21.3 | 8.9 | 23.1 | 33.7 | 1.4 | 68 729 | 132 | 520.7 |
| Son | 14.2 | 28.5 | 11.7 | 18.2 | 24.9 | 2.5 | 41 149 | 145 | 283.8 |
| Tam | 11 | 29.8 | 16.7 | 20.4 | 21.4 | 0.7 | 62 417 | 131 | 476.5 |
| Zac | 15.9 | 54.1 | 10.4 | 10.6 | 8.8 | 0.2 | 168 318 | 179 | 940.3 |
| Mean CRE Nte | 20.15 | 33.9 | 10.44 | 15.1 | 19.1 | 1.36 | 607 976 | 1084 | 560.9 |
For the state of NL there is a clear contradiction between rural poverty and having the highest average national income per family during 2015 (INEGI, 2016). This shows that, despite being the state with the highest family income per quarter at the national level, the rural sector of the state presented the highest percentage of UER for self-consumption in the North region. Zac and Dgo obtained the last and penultimate place, respectively, in the lowest average income per family in the region and in the same order, they occupied the second and third place with high percentages of subsistence UER. BCS ranked third in the national highest income per trimester per family and presented 55.3% of subsistence UER, which indicates that poverty is found in rural and periurban areas.
The state of Zac presented the largest number of extension agents and BCS the lowest. However, the greatest potential attention per-capita of UER of E1, E2 and E3 by extension agent was obtained by BC with 102.2, followed by Son and BCS with values of 283.8 and 346.4, respectively. For both BC and BCS, the degree of municipal marginalization is very low to low (CONAPO, 2015), their average quarterly income per family is among the highest nationally (INEGI, 2016) and their attention by extensionists to the UER of very adequate subsistence. The states of Zac, Coah, Chih and NL, obtained the lowest proportion of potential attention to the UER, below the average, in that descending order (Table 1).
The state of Zac as a strategy to increase agricultural productivity and aquaculture, as well as fight poverty should increase the number of extension workers to double, for future exercises, focused on target population (DOF, 2015), in municipalities with very high and high degree of marginalization (CONAPO, 2015), in crops or priority chains. In the case of Chih., hire a greater number of extension agents who operate in the poorest municipalities of the country; Batopilas and Carichi (CONAPO, 2015) with attention to the Rarámuri population, who live in the area and speak the indigenous language. In addition to establishing a GEIT in the region, with a coordinator with extensive experience in territorial development (Méndez, 2006; Rodríguez et al., 2009). The state of NL, having more than 70% of its subsistence UER (FAO-SAGARPA, 2013), must hire more extension workers to serve these vulnerable strata (E1 and E2).
The agricultural production chains that involved the greatest number of extension agents were: basic grains (beans and corn), citrus and barley, with values of 10.6, 6.2 and 4.1%, respectively (Table 1). In the case of livestock chains, the largest number of extension workers obtained beef cattle, followed by goats and dairy cattle, with percentages of 15.5, 6.6 and 4.7%, respectively. Within aquaculture and fisheries, the chains or product system with the highest percentage of attention by extension agents were: tilapia, shrimp and marine scale, with percentages of 2.1, 1.7 and 1.6, respectively.
In the Northern CRE, the average quarterly income per household was 7 thousand pesos higher than the national average, which is equivalent to 20% higher income (Table 2). The states that presented percentages higher than 50% of their subsistence UER, should have more precise goals by the GT of the states, to establish a reduction of poverty in the UER in the short and medium term (2 to 5 years) as part of federal, state public policies and involve the municipal authorities of rural development. Regarding federal public policies, it is necessary to improve the operation of the component in the states, since poverty in rural areas has remained unchanged since the 1980s, and with a clear tendency to increase inequality despite public spending in the social sector (Janvry and Saudolet, 1984; CONAPO, 2015; SAGARPA, 2016).
Table 2 Average quarterly income per household and budget allocated to the national, regional, and state extension component of the Northern CRE. (INEGI, 2016; SAGARPA, 2016).
| State | Income (thousands of pesos) | higher income/lower income | Budget allocated to the extension component (millions of pesos) | Percentage nationally | ||
| Federal | State | Total | ||||
| BC | 54 616 | 1.22 | 56 | 14 | 70 | 2.5 |
| BCS | 61 361 | 1.01 | 31.2 | 7.8 | 39 | 1.4 |
| Coah | 53 301 | 1.25 | 54.6 | 13.7 | 68.3 | 2.4 |
| Chih | 56 015 | 1.19 | 108.4 | 0* | 108.4 | 3.9 |
| Dgo | 41 709 | 1.6 | 86.5 | 21.6 | 108.1 | 3.9 |
| NL | 66 836 | 1 | 0 | 14.9 | 14.9 | 0.5 |
| Sin | 58 056 | 1.15 | 140.4 | 35.1 | 175.5 | 6.3 |
| Son | 58 017 | 1.15 | 112.4 | 28.1 | 140.5 | 5 |
| Tam | 44 147 | 1.51 | 57.6 | 14.4 | 72 | 2.6 |
| Zac | 35 749 | 1.87 | 126 | 31.5 | 157.5 | 5.6 |
| Average CRE Nte | 52 981 | 1.26 | 773.1 | 181.1 | 954.2 | 34.1 |
| Average Nac | 45 887 | 1.46 | 2 144.8 | 653.1 | 2797.8 | |
*= No concurrent contribution 2015 and 2016 (personal communication in the GT).
Regarding the budget for the extension component of the state (Table 2), the states with the largest budget in the Northern CRE were; Sin, Zac and Son. According to the UER number of strata E1, E2 and E3, the largest budgets should be for: Zac, Chih and Dgo. In the case of the states of Coah, Chih and Tams had assigned and agreed a total of 136.5 (109.2 federal and 27.3 state), 135.5 (108.4 federal and 27.1 state) and 144 (115.2 federal and 28.8 state) millions of pesos, respectively. However, these states contributed less than agreed.
In the case of NL, the approved federal contribution was 59.7 million, which were not established (Table 3). These states must comply with the regulations of SAGARPA, so that all the programmed and approved budget is fully exercised. This type of actions has a negative impact on low-income producers, since they do not have an extension service that promotes increasing the productivity of their UER. It is striking that in fiscal year 2016 of the Extension component of the Northern CRE, 34.1% of the national resource was used and the average UER in the region was 14 and 12.6% of E1 and E2, respectively (FAO-SAGARPA, 2014).
Table 3 Area of land with agricultural and livestock activity in the Northern CRE.
| State | Irrigation surface* |
Temporary surface* |
Total sown* | Value production* |
Livestock surface** |
| (Thousands of ha) | (Thousands of pesos) |
(Millions of ha) |
|||
| BC | 190.1 | 27.7 | 217.81 | 15 278 698 | 5.58 |
| BCS | 43 | 0 | 42.96 | 4 238 968 | 7.18 |
| Coah | 151.4 | 114.94 | 266.31 | 6 244 412 | 14.21 |
| Chih | 550.2 | 550.94 | 1101.12 | 33 045 927 | 15.62 |
| Dgo | 167.2 | 564.51 | 731.75 | 7 850 102 | 5.97 |
| NL | 90.9 | 261.27 | 352.14 | 3 782 813 | 5.63 |
| Son | 597 | 37.57 | 634.59 | 30 101 358 | 16.17 |
| Sin | 900.9 | 368.75 | 1269.62 | 39 825 748 | 1.2 |
| Tam | 453.7 | 945.42 | 1399.12 | 15 406 773 | 5.03 |
| Zac | 153.7 | 1069.8 | 1223.49 | 13 469 250 | 5.8 |
| Total | 3298 | 3940.9 | 7238.91 | 153 144 169 | 82.39 |
*= SIAP (2015) Statistical yearbook of agricultural production; **= SAGARPA-FAO (2014).
During 2015, there was a surface planted in the Northern CRE of seven million 239 thousand hectares (ha) (SIAP, 2016) of various annual and perennial crops, under seasonal and irrigated conditions. The irrigated area was carried out in 3 298 010 ha and the rainy one in 3 940 900 ha. On the surface of irrigated land Sinaloa stands out with more than 900 thousand hectares, followed by Son y Chih with more than half a million hectares. each. As for the agricultural area of rainforest, Zac stands out with more than one million hectares, followed by Dgo and Chih with a little more than half a million hectares, each (Table 3).
The national value of agricultural production in 2015 was 153 billion pesos. The harvested area and the value of production (SIAP, 2015) of the main crops in the 10 states covered by the Northern CRE were: alfalfa, forage oats, green chili, beans, corn, tomatoes and wheat.
In terms of livestock activity in the region (Table 4), there is a very significant participation in milk production; a production of 4 411.7 million liters is estimated for 2016 (SIAP, 2016), mainly milk from cattle, with a population of 985 203 milk producing bovine heads (SIAP, 2016). However, this product ranked second in imports in 2016 with a deficit of 56.2 million dollars (INEGI, 2017). The states of Coah, Dgo and Chih occupy the 2nd, 3rd and 4th national place in milk production.
Table 4 Milk, meat, egg and honey production in the 10 states of the Northern CRE. Source: Agrifood and Fisheries Information Service (SIAP-SAGARPA, 2016).
| Product system | Milk (thousands of liters) | |||||
| Species | Bovine | Caprine | Total | |||
| Total | 4 320 351 | 91 419 | 4 411 770 | |||
| Product system | Carne canal (t) | |||||
| Species | Bovine | Porcine | Ovine | Caprine | Bird | Total |
| Total | 601 241 | 315 441 | 12 154 | 15 665 | 619 972 | 1 564 473 |
| Product system | Egg (t) | Honey (t) | ||||
| Species | Poultry | Apiarian | ||||
| Total | 423 671 | 5 340 | ||||
In the production of goat milk, Coah and Dgo stand out with more than 91 thousand liters. As for bovine meat, there is a production of 601 241 t in the region, with a cattle herd of 9 485 218 heads. Sin, BC, Dgo and Chih are the most outstanding entities in the production of channels. The export of live cattle is one of the most outstanding livestock activities in the region, exporting 622 661 heads during 2016, which can be considered a low export year for this type of product compared to the historical average. Particularly noteworthy in this activity are the states of Son and Chih (SIAP, 2015).
With respect to pork production in the Northern CRE, this was 315 441 tons during 2016 (SIAP, 2016), with a notable contribution in Son, second national producer. In the production of meat from small ruminants Zac excels in sheep, while Coah in goats; both states have more than 600 thousand heads. The production of poultry meat in the region was 619 972 t, 2016, where the state of Durango has the highest volumes, occupying the 5th place in the national production and Sinaloa the 9th place. With regard to the production of eggs for consumption, there was a production of 423 671 t; Sonora, occupies the 3rd national position. However, this product registered a considerable value in the imports of 2016, being of the order of 14 million dollars (INEGI, 2017). The production of honey in the region during 2016 was 5 340 tons (SIAP, 2016), it can be said that the production in the Northern CRE states is modest, in comparison with the production of Yucatan, Campeche and Chiapas; however, the state of Zac stands out with a production of 1 929 tons, occupying the 9th national place.
The CRE Norte presents an outstanding fishing activity. The states of Son, Sin, BC and BCS, are located in the first four places of production in the country and represented 73.5% of the volume of national fishing production (Figure 1a). In 2013, they contributed 52.37% of the value of the national fishing production (CONAPESCA, 2013). In BC, BCS and Son., The most outstanding species for the volume of production are: sardine, tuna, shrimp, squid and crab. In the capture and industrialization of sardines the state of Sin stands out. In addition, there is mention of catfish, carp, bass, mojarra and trout, but not tilapia. In 2016 there was a deficit in the trade balance of fish, crustaceans and molluscs for 25.4 million dollars (INEGI, 2017). It is important to pay more attention to the implementation of technologies in this sector, in order to achieve an increase in production.
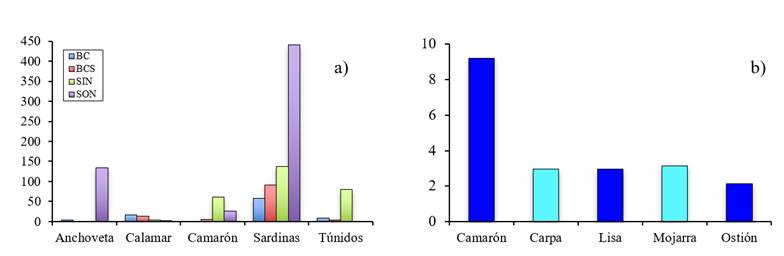
Figure 1 a) Production (t) of the main fishing species in the Gulf of California and the Pacific Ocean; b) Production (t) of the main fishing species (marine blue) and aquaculture (sky blue) in the Gulf of Mexico (Tamaulipas) in the Northern CRE.
In Figure 1b, the main fishing and aquaculture species for the state of Tam are observed. They stand out for their production: shrimp, mullet and oyster with 9 192; 2 961 and 2 134 t, respectively. In the case of aquaculture, the species of mojarra 3 151 t and carp with 2 950 t stand out.
The agricultural chains with the highest frequencies by GEIT in the region of the Northern CRE were: citrus, sorghum and beans with frequencies of 10, 10 and 9. In the case of the livestock chains most frequently in the region were: bovine meat, cattle milk and goats, with values of 29, 14 and 13, respectively. For the aquaculture and fishing sector the highest frequencies were: tilapia, scale and clam with values of 5, 5 and 4, respectively. In Table 5, the number of productive chains served by state is shown. The state of Zac was where the greatest diversity of crops served was presented; while in the states of Chih and Tam was where less product systems were served.
Table 5 Number of GEIT, extension agents, producers and value chains in the Northern CRE.
| State | GEIT | Installation GEIT | Exts | Coords GEIT* |
Value chains | Producers served |
||||
| Agri | Pec | AP | O** | Total | ||||||
| BC | 7 | May and June | 86 | 3 | 10 | 5 | 6 | 21 | 2490 | |
| BCS | 4 | June | 31 | 2 | 3 | 3 | 3 | 9 | 930 | |
| Coah | 6 | June | 64 | 3 | 12 | 5 | 1 | 18 | 1920 | |
| Chih | 5 | June | 118 | 5 | 3 | 5 | 1 | 9 | 3540 | |
| Dgo | 4 | July | 135 | 4 | 9 | 5 | 2 | 16 | 4050 | |
| NL | 4 | August | 63 | 2 | 8 | 3 | 3 | 14 | 1890 | |
| Sin | 6 | July | 132 | 3 | 7 | 2 | 2 | 11 | 3960 | |
| Son | 11 | July | 145 | 5 | 20 | 2 | 22 | 4350 | ||
| Tam | 6 | Aug, Sep | 131 | 4 | 6 | 3 | 4 | 13 | 3930 | |
| Zac | 8 | July | 179 | 6 | 20 | 6 | 2 | 3 | 31 | 5370 |
| Total | 61 | - | 1084 | 37 | - | - | - | - | - | 32430 |
*= They did not attend producers, they supported the extension agents and the GT of each state; **= Integral, soil conservation, agroforestry, nurseries, ceramics, etc.
Some services are presented generically as “integral”, “agricultural” or “family gardens”, which include several crops, without being specific. Non-timber forest crops such as nopal, aloe, candelilla and lechuguilla were treated. In the state of Zac, attention was paid to an activity not related to the agricultural sector (ceramics).
Within the unattended crops or chains, the Sonora state attracts attention where there were no services for aquaculture or fishing activities, despite the economic importance of this sector, especially in sardine fishing.
In the region operated 61 GEIT (2016), installed from May to September with 1084 extension workers and 37 coordinators, who attended an approximate of 32 430 producers or UER (Table 5). However, with an UER universe of 607 976, 20 266 Extensionists would be needed for 100% care. For this reason, it is important to have an intervention model, where producers and research and teaching institutions are also transfers of technological innovations, so that the models are replicated in all possible existing forms (Aguilar et al., 2002; López et al., 2008; Aguilar et al., 2010).
The GEIT installation date was late, which makes it impossible to implement many of the technological innovations for spring-summer crops. In addition to late analysis of the initial diagnoses and the revision to the work programs of the extension agents. In relation to the category of municipal marginalization in the State area of the Northern CRE; BC, Coah and NL are classified as very low marginalization, the states with low marginalization were: BCS, Son, Chih and Tam. With marginalization: Sin, Dgo and Zac, without the presence of states with high and very high marginalization in the region (CONAPO, 2015). At the municipal level, the states of Chih, Dgo and Zac have the highest number of municipalities with high and very high levels of marginalization according to CONAPO (2015) (Table 6), these being 15, 9 and 6, respectively. The states of Zac, Tam, Dgo and Sin have the highest number of average marginalization, with values of 21, 17, 9 and 9, respectively.
Table 6 Attention to extension services by degree of municipal marginalization by state (CONAPO, 2015). Number of municipalities with and without extension service.
| State | Municipality number | Degree of marginalization | |||||
| Low and very low | Medium | High and very high | |||||
| Without service | With service | Without service | With service | Without service | With service | ||
| BC | 5 | 1 | 4 | - | - | - | - |
| BCS | 5 | 1 | 4 | - | - | - | - |
| Chih | 67 | 12 | 34 | 2 | 4 | 13 | 2 |
| Coah | 38 | 6 | 30 | 0 | 2 | - | - |
| Dgo | 39 | 7 | 14 | 8 | 1 | 9 | 0 |
| NL | 51 | 24 | 19 | 0 | 4 | 2 | 2 |
| Sin | 18 | 0 | 9 | 0 | 6 | 1 | 2 |
| Son | 72 | 20 | 42 | 5 | 4 | 0 | 1 |
| Tam | 43 | 15 | 5 | 10 | 7 | 4 | 2 |
| Zac | 58 | 7 | 27 | 10 | 11 | 0 | 3 |
| Total | 396 | 93 | 188 | 35 | 39 | 29 | 12 |
The municipalities with the attention of extension agents, highlight the states of Zac, Tam and Sin, which serve a greater number of municipalities of high, very high and middle marginalization, with 14, 9 and 8 municipalities, respectively. The states of Chih and Tam should prioritize with extension services in the municipalities of very high to medium marginalization, so that they can meet the target population in the future.
In the Northern CRE region 71.2% of the municipalities are very low and low marginalized (52.5% receive at least one extension service). For the municipalities of medium and high-very high marginalization corresponded to percentages of 18.4 and 10.4%, respectively, of those percentages only received at least one extension service 52.3 and 28.9%, respectively. 28.8% of the municipalities (114) presented very high, high and medium marginalization, the extension agents only had coverage 12.8% (51) of all the priority municipalities. In general, it can be deduced that agreement with the CONAPO (2015), only about one third of municipalities with target population of strata E1, E2 and E3, described by the diagnosis of FAO (2014) (Table 6).
Considering that the most frequent agricultural productive chains by GEIT and by state were: citrus, sorghum and corn and the most attended by extension agents were basic grains, citrus and barley (Table 7), there is a discrepancy in the importance or presence of demand of the sorghum chain and the high number of extension agents for barley, it may be necessary to analyze by agroecological region or by state to understand more the behavior between the demand of a chain and the degree of attention by extension agents.
Table 7 Incidence of Extensionists in percentage by productive chain in the Northern CRE.
| Agricultural | Chain | Barley | Citrus | Grains* | Vegetable Gardens | Sorghum | Tomato | Wheat |
| (%) | 4.19 | 6.24 | 10.62 | 1.87 | 2.85 | 1.87 | 1.61 | |
| Cattle | Chain | Bovine meat | Bovine milk | Bovine DP | Caprine | Ovine | ||
| (%) | 15.52 | 4.73 | 4.1 | 6.6 | 1.87 | |||
| Fishing and aquaculture |
Chain | Shrimp | Scale | Oyster | Tilapia | |||
| (%) | 1.69 | 1.61 | 1.07 | 2.05 |
*= grains (beans and corn).
In the case of livestock production chains, beef was the most demanded and most attended, followed by milk and goats in demand, in that order. However, he received more attention to goats than dairy cattle. It is reasonable that there should be greater attention to goats by the extension agents, since it is one of the characteristic chains of the social sector (E1 and E2). For aquaculture and fishing, the productive chains established in GEIT were: tilapia, scale and clam, these first two with greater attention to received services. The inconsistency between the oyster care and demand in GEIT of the clam product system was observed.
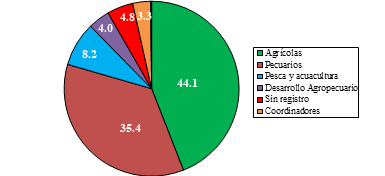
Of the participation of extension agents by sector; 44.1% of agricultural, 35.4 livestock and 8.2% in aquaculture and fishing were obtained (Figure 2), in this last sector the participation of extension workers was very low, considering the economic importance of the sector in the pacific coasts of the Northern CRE (SIAP, 2015). It is also striking that around 5% of the extension agents (52) did not know what value chain they were working on, it is important to have very well documented the value chains or product system that the Extension agents attend, in order to understand which service, they provide and can define the appropriate technological innovations according to the stratum to which the producer belongs.
Conclusions
The Northern CRE region occupies about 50% of Mexico’s territory and 49.5% of UER E1, E2 and E3 were registered. The main crops for the Northern CRE, according to their planted area and production value were: alfalfa, forage oats, green chili, beans, corn (yellow), tomato and wheat. According to this criterion, the most important livestock products for the region were milk and beef. These livestock systems have little representation in UER E1, E2 and E3, due to the fact that most of them are devoted to goat farming, mainly.
The chains served in the region, beans and goats, were well represented according to the target population of the component. The fishing sector was given little attention in terms of product systems, since it only registered about 15%, with no services in Sonora, where fishing activity has great relevance. In the territory of the Northern CRE, services were provided in 60% of the municipalities. However, the representation in the municipalities of high to medium marginalization was less than 50%.
The Zac and Dgo states presented a very low proportion of extension agents per UER, despite being entities with a medium degree of marginalization and having a high UER number of E1, E2 and E3. The same case was presented for the state of NL, although it presents a low degree of marginalization, it has the highest percentage of subsistence UER. In general, the extension agents attended the key productive chains for their state; nevertheless, it is necessary to focus services on some chains that were not attended in the magnitude that corresponded to them because of their importance for the entity and the target population. It is also of great importance that the GT of the states improve their planning process according to their diagnostic characteristics, which focus the services to the target population, to the chains or priority product systems of the region, as well as the training needs in the priority innovations most demanded or bottlenecks that appear within the UER of the North region.
Literatura citada
Aguilar, A. J.; Altamirano, C. J. R. y Rendón, M. R. 2010. Del extensionismo agrícola a las redes de innovación rural. FAO, CIESTAAM, UACH. Texcoco, Estado, México. 281 p. [ Links ]
Aguilar, B. U.; Amaro, G. R.; Bueno, D. H. M.; Chagoya, F. J. L.; Koppel, R. E. T.; Ortiz, O. G. A.; Pérez, S. J. M.; Rodríguez, C. M. A.; Romero, F. M. Z. y Vázquez, G, R. 2002. Manual para la formación de capacitadores modelo GGAVATT. SAGARPA-INIFAP-CIRCE. Campo Experimental Zacatepec. Morelos, México. 185 p. [ Links ]
Aguirre, F. 2012. El nuevo impulso de la extensión rural en América Latina: situación actual y perspectivas. 53 p. [ Links ]
CONAPESCA. 2014. Comisión Nacional de Acuacultura y Pesca. Anuario estadístico de acuacultura y pesca 2013, CONAPESCA-SAGARPA. 295 p. http://www.conapesca.gob.mx. [ Links ]
CONAPO (Comisión Nacional de Población). 2015. Índice de marginación por entidad federativa y municipio. https://www.gob.mx/conapo/documentos/indice-de-marginacion-por-entidad-federativa-y-municipio-2015. [ Links ]
Christoplos, I.; Sandison, P. and Chipeta, S. 2012. Guide to evaluating rural extensión. Global forum for rural advisory services (GFRAS). Lindau, Switzerland. 52 p. [ Links ]
DOF. 2015. Reglas de operación de la SAGARPA ejercicio fiscal 2016. SAGARPA. CD.MX. http://www.Sagarpa.gob.mx/.2016/Reglas-Operación-2016-Sagarpa-DOF-OFICIAL.pdf. [ Links ]
DOF. 2016. Reglas de operación de fomento a la agricultura de la SAGARPA para el ejercicio fiscal 2017. SAGARPA. CD. MX. http://www.Sagarpa.gob.mx/agricultura/Programas/ proagro/Normatividad.pdf. [ Links ]
INEGI. 2016. Resultados del módulo de condiciones socioeconómicas (MCS) 2015. Boletín de Prensa Núm. 286/16. Aguascalientes, Ags. http://www.inegi.org.mx/saladeprensa/ boletines/2016/especiales/especiales2016-07-03.pdf. [ Links ]
INEGI. 2017. Balanza comercial de mercancías de México. SNIEG. http://www.inegi.org.mx/est/contenidos/proyectos/registros/economicas/comercio/. [ Links ]
Janvry, A. y Sadoulet, E. 2004. Hacia un enfoque territorial del desarrollo rural. Cuarto Foro Temático Regional de América Latina y el Caribe “cómo cosechar las oportunidades el desarrollo rural en el Siglo 21”. Costa Rica. http://www.alternativasycapacidades.org/ sites/default/files/biblioteca. [ Links ]
López, G. J.; Jiménez, S. L.; Merino, A. L.; Figueroa, R. O. L.; Morales G. M. y Mariano, V. y González, R. 2008. Escuelas de campo, para capacitación y divulgación V. con tecnologías sustentables en comunidades indígenas. Agric. Téc. Méx. 34(1):33-42. [ Links ]
Méndez, S. M. J. 2006. Los retos de la extensión ante una nueva y cambiante noción de lo rural. Rev. Fac. Nal. Agr. Medellín, Colombia. 59(2):3407-3423. [ Links ]
Rendón, M. R.; Roldán, S. E.; Hernández H. B. y Cadena Í. P. 2015. Los procesos de extensión rural en México. Rev. Mex. Cienc. Agríc. 6(1):151-161. [ Links ]
Rodríguez, L.; La O, M.; Fonseca, M.; Guevara, F; Hernández, A. y Jiménez, M. 2009. Extensionismo e innovación como proceso de aprendizaje social y colectivo. ¿Dónde está el dilema? Rev. Cubana Cienc. Agríc. 43(4):387-394. [ Links ]
SAGARPA-FAO. 2014. Diagnóstico del sector rural y pesquero de México 2012. http://www.Sagarpa.gob.mx; http://www.fao.org. [ Links ]
SAGARPA. 2016. 4to informe de labores 2015-2016, SAGARPA. http://www.sagarpa.gob.mx/transparencia/pot-2016/informe/cuartoinformedelabores. [ Links ]
Sánchez, C. J. E. 2014. La política agrícola en México, impactos y retos. Sociedad Mexicana de Administración Agropecuaria A. C. Torreón, Coah. Rev. Mex. Agroneg. 35(2):946-956. [ Links ]
SIAP-SAGARPA. 2015. Anuario estadístico de la producción agrícola 2015. http://www.Infosiap.siap.gob.mx/aagricola-siap-gb/icultivo/index-jsp. [ Links ]
SIAP-SAGARPA. 2016. Servicio de Información Agroalimentaria y Pesquera. 2016. http://www.gob.mx/siap. [ Links ]
Received: April 2018; Accepted: June 2018
 Este es un artículo publicado en acceso abierto bajo una licencia Creative Commons
