


Services on Demand
Journal
Article
 text in
  English (pdf)
 Article in xml format
 Article references
 Send this article by e-mail
Indicators
-
 Cited by SciELO
 -
 Access statistics
Related links
-
 Similars in
SciELO
Similars in
SciELO
Share

 Permalink
Revista mexicana de ciencias agrícolas
Print version ISSN 2007-0934
Rev. Mex. Cienc. Agríc vol.9 n.3 Texcoco Apr./May. 2018
https://doi.org/10.29312/remexca.v9i3.1214
Articles
Characteristics and productivity of a MAC plant, Agave tequilana developed with fertigation in Tamaulipas, Mexico
1Instituto Nacional de Investigación Forestales, Agrícolas y Pecuarias. (enrique-77840@yahoo.com).
2Colegio de Postgraduados. (yanezmj@colos.mx).
3Instituto Politécnico Nacional-Centro de Biotecnología Genómica-Reynosa. (aguilaquecae@yahoo.com).
In the cultivation of Agave tequilana, the studies have been restricted to a part of its long cycle and to short periods of time, for this reason, with the objective of evaluating the agronomic characteristics in plant and pineapple in a complete cycle of the plant, they established suckers from Jalisco in the south of Tamaulipas in three conditions: a) in temporary and without fertilizer (TA); b) fertigation, in addition to precipitation, received water and nutrients (N, P, K, Ca, Mg, and micronutrients) through a drip irrigation system; and c) FB+fertigation, in addition to the above, these plants received basic fertilization (FB), with N, P, K and micronutrients, each treatment had three repetitions. Eight destructive evaluations were carried out using one plant per experimental unit, September 2004, February 2005, October 2005, 2006, 2007, 2008, 2009 and 2010. The plants developed with fertigation and fb+fertigation, on average exceeded 26% and 57% the height and number of leaves of plants of the TA, respectively; the highest annual production of dry matter (MS) was 51.8 t ha-1, estimating a total biomass per plant of 491.4 and 456.1 t ha-1 and 218.1 and 252.4 t ha-1 in the pineapple, respectively. In TA plants the total biomass was 97 t ha-1 and a pineapple yield of 46.5 t ha-1. In pineapple the sugars evaluated in ºBrix and total reducing sugars (ART) were not affected by the treatments. The concentration of ART in the pineapple fluctuated between 26.8 and 29%. The concentration of glucose and fructose was similar in early stages of pineapple development; however, at the end of the cycle during the maximum growth stage the mean value in the fructose concentration was 246.8 g per kg MS of pineapple and represented 88% of the two soluble monosaccharides evaluated, the glucose presented an inverse behavior and represented the remaining 12%.
Keywords: biomass production; drip irrigation; MAC; reducing sugars
En el cultivo de Agave tequilana, los estudios se han restringido a una parte de su largo ciclo y a periodos cortos de tiempo, por tal razón, con el objetivo de evaluar las características agronómicas en planta y piña en un ciclo completo de la planta, se establecieron hijuelos provenientes de Jalisco en el sur de Tamaulipas en tres condiciones: a) en temporal y sin fertilizante (TA); b) fertigación, además de la precipitación, recibieron agua y nutrimentos (N, P, K, Ca, Mg, y micronutrimentos) mediante un sistema de riego por goteo; y c) FB+fertigación, adicional a lo anterior, éstas plantas recibieron fertilización de base (FB), con N, P, K y micronutrimentos, cada tratamiento tuvo tres repeticiones. Se realizaron ocho evaluaciones destructivas utilizando una planta por unidad experimental, septiembre 2004, febrero del 2005, octubre de 2005, 2006, 2007, 2008, 2009 y 2010. Las plantas desarrolladas con fertigación y fb+fertigación, en promedio superaron en 26% y 57% la altura y número de hojas de plantas del TA, respectivamente; la mayor producción de Materia Seca (MS) anual fue 51.8 t ha-1, estimándose un total de biomasa por planta de 491.4 y 456.1 t ha-1 y 218.1 y 252.4 t ha-1 en la piña, respectivamente. En plantas del TA la biomasa total fue 97 t ha-1 y un rendimiento de piña de 46.5 t ha-1. En piña los azúcares evaluados en ºBrix y azúcares reductores totales (ART) no fueron afectados por los tratamientos. La concentración de ART en la piña fluctuó entre 26.8 y 29%. La concentración de glucosa y fructosa fue similar en etapas iniciales de desarrollo de la piña; Sin embargo, al final del ciclo durante la etapa de máximo crecimiento el valor medio en la concentración de fructosa fue de 246.8 g por kg MS de piña y representó 88% de los dos monosacáridos solubles evaluados, la glucosa presentó un comportamiento inverso y representó el restante 12%.
Palabras clave: azúcares reductores; MAC; producción de biomasa; riego por goteo
Introduction
Improving current yields in agricultural production systems, even with the increases in temperature and CO2 that are registered as an effect of climate change, is a challenge; one of the alternatives to face it, needs to elucidate the evolution, genomic characteristics and mechanisms of regulation of plants with acid metabolism of crasulaceae (MAC); transferring MAC engineering to crops with photosynthesis C3 and C4, with the objective of increasing the efficient use of water, reducing crop losses due to droughts and contributing to the expansion of agricultural production in abandoned or semi-arid lands (Owen and Griffiths, 2014; Heikkinen, 2015; Wullschleger et al., 2015). The MAC metabolism is typical of the Agavacea family, of which 151 species are endemic to Mexico. These plants are known as magueyes, agaves or mezcales (Gentry, 1982).
In Mexico, the species of economic importance are A. tequilana cultivated for the production of tequila; A. angustifolia, A. salmiana and A. americana among others, used in the elaboration of mezcal; A. fourcroydes and A. lechuguilla in obtaining fiber (Escamilla-Treviño, 2012). In recent years these plants have received attention, because in the MS of the leaves have cell walls containing between 3 and 15% lignin and 68% cellulose; this low concentration of lignin consumes less energy when it is used to produce biofuels, (Iñiguez-Covarrubias et al., 2001; Borland et al., 2009; Nobel, 2010; Somerville et al., 2010; Li et al., 2014).
Studies conducted on agave species have associated the fixation of CO2 with soil moisture (HS), temperature (T), photosynthetically active radiation (RFA), salinity (S) and nutrient deficiencies (DN), among other factors. With respect to T, in plants of A. tequilana that received 15 °C/5 °C of temperature during day/night, a fixation of 298 mmol m-2 of CO2 was registered in 24 h; fixation value that decreased 10 and 72% with increasing temperature of 25 ºC/15 ºC and 35 ºC/25 ºC, respectively (Pimienta et al., 2001). On the other hand, when the HS was not a limiting factor in A. deserti that was irrigated, the nocturnal opening of stomata, characteristic in these MAC plants, was modified, registering during the day the opening of stomata, observing the period of light 97% of the CO2 required by the plant (Hartsock and Novel, 1976).
The agave studies have been carried out in periods of time between 24 hours and two years, in different stages of the plant cycle; without considering, the complex interaction between stages of plant development, climatic conditions and soil fertility, etc. Dismissing the potential of these MAC plants, when they are developed without moisture limitations. For this reason, the objective of the present study was to study a complete cycle of the plant of A. tequilana, to document the behavior of its agronomic characteristics, yield and quality, when it is developed in a warm region of the south of Tamaulipas, under two systems of a) traditional production of temporary and without fertilizer; and b) an intensive production system, receiving the entire cycle of water and nutrients through a drip irrigation system.
Materials and methods
In May 2004, agave cultivation was established in the “Las Huastecas” Experimental Field of the National Institute of Agricultural and Cattle Forestry Research (INIFAP), located in the municipality of Altamira, Tamaulipas, Mexico, at 22° 33’ 59” latitude north, 98° 09’ 49” west longitude and 15 meters above sea level. The plants were developed in a Eutric Vertisols (INEGI, 2016), characterized from a composite sample, taken at 0.3 m depth, in 24 points of the terrain. In the soil sample, we determined: texture, moisture retention, organic matter, cation exchange capacity, interchangeable cations and pH, in accordance with the Official Mexican Standard NOM-021-SEMARNAP-2000 (Table 1).
Table 1 Physical and chemical properties of the clay soil where the agave crop was grown.
| Mechanical analysis | Humidity of floor | Interchangeable cations | ||||||||||
| Sand | Silt | Clay | CC | PMP | pH (1:2) | MO (%) | CIC | K | Ca | Mg | Na | |
| (%) | (%) | (cmol(+) kg-1) | ||||||||||
| 26.9 | 23 | 50.1 | 42.6 | 20.6 | 8.7 | 1.1 | 52.5 | 0.37 | 43.2 | 4.4 | 1.35 | |
CC= field capacity; PMP= permanent wilting point; MO= organic matter; CIC=cation exchange capacity.
The buds of agave from the state of Jalisco, were established in three conditions of fertilizer management: a) absolute control (TA), in conditions of rain and without fertilizer; b) fertigation, in addition to rain, each plant received during its development through a drip irrigation system and in 348 irrigation events, 3 960.8 L of water, 315.3 g of N; 179.9 g of P2O5; 353.4 g of K2O; 111 g of CaO and 89.1 g of MgO; and c) FB+fertigation, prior to the transplant, these plants received 162-150-250 kg ha-1 of N, P and K, respectively as basic fertilization (FB), in addition to the water and fertilizers that the plants received in the treatment previous. The source of fertilizers to provide P was ammonium monophosphate (11-52-00), while K was used for potassium nitrate (13-00-44). The FB was supplemented with one tonne per hectare of Econutriente® as an organic fertilizer, enriched with 5 kg ha-1 of magnesium sulfate, iron and zinc. Each treatment was established in three repetitions.
The land where the study was established was prepared and bordered one meter apart between rows. Only in the case of the FB+fertigation treatment, every third furrow was applied in the bottom the band fertilizer; subsequently, the board was split, covering the fertilizer with soil, which remained at a depth of approximately 30 cm below where grapefruit and pineapple-sized shoots were planted (Rendon et al., 2011). The experimental unit consisted of 6 rows of agave plants 3 m apart and 1.5 m between plants, establishing 16 plants per row and 96 rows per experimental unit of 405 m2.
During the development of the crop, eight evaluations were carried out, September 2004, February 2005, October 2005, 2006, 2007, 2008, 2009 and 2010, in each sampling, a plant was randomly extracted per experimental unit evaluated, plant height to the highest spine of the leaves of the head, total number of leaves fully spread, wet weight (PH) and dry matter (MS) of plant and pineapple. In this last organ with a refractometer portable refracto 30PX, Mettler Toledo was determined ºBrix, the total reducing sugars (ART) by the Ting method (1956) and fructose and glucose, by high efficiency liquid chromatography (HPLC) with a Hewlett-Packard/Agilent Technologies model 1100 equipped with a differential refractive index detector using an Aminex HPX-87H (Bio-Rad) 300 x 7.8 mm column, at a temperature of 40 °C, using a solution of H2SO4 0.005 N as effluent at a flow of 0.4 mL min-1. In each evaluation, the data obtained in the variables were analyzed as a completely randomized design and the mean values were compared using the Tukey test (p≤ 0.05), the values of the agronomic characteristics that showed significance were adjusted to regression models depending on the period of growth.
Results and discussion
From transplant to harvest, 77 months were used in the study, in this period the average minimum and maximum temperature was 19.8 and 29.9 °C, respectively; registering 5 952.2 mm as total precipitation (PPTOT), in 479 events. However, this PPTOT represented only 59% of the total evaporation recorded (EV). The deficit of precipitation with respect to evaporation was variable during the cycle of development of the crop, accentuating between 54 and 65 MDP; in this stage, precipitation represented only 35 of the EV. Situation that resulted in less storage of water for irrigation and decreased up to 50% the volume of irrigation and nutrients contributed in the last two years of crop development, in those plants developed with fertigation and FB+fertigation. The decrease in the volume of irrigation water at the end of the cycle, caused greater stress in the plants of greater development, which were those that received fertigation and FB+fertigation, in these plants, 65% of the population studied had physiological maturity at 71 MDP (emission of the floral scape), while the plants developed in the TA at 77 MP, did not emit floral scape.
The agave plants developed with Fertigation and FB+Fertigation also showed higher values (p≤ 0.05) of plant height, number of leaves, PH and MS of the plant, ºBrix and ART to the values that presented in the same characteristics the plants of TA, while the concentration of sugars evaluated as °Brix and reducing sugars (AR) were not affected by the management (Table 2).
Table 2 Agronomic and quality characteristics of the pineapple, registered in the agave plant developed in 77 months under different fertilization conditions.
| Description of treatments | Plant height (cm) | Number of leaves | Plant | Sugars in pineapple | ||||
| Wet weight | Dry matter | ºBrix | AR‡ | AR Total | ||||
| (kg) | (kg) | (%) | (g L-1) | (kg pineapple -1) | ||||
| Absolute Witness (TA) | 129 b† | 42.7 b | 29.4 b | 7.4 b | 29.4 a | 267.6 a | 2.8 b | |
| Fertigation | 156 a | 131.3 a | 138.2 a | 38.5 a | 31.8 a | 289.1 a | 13.8 a | |
| FB + fertigation | 153.3 a | 128.7 a | 148.9 a | 42.3 a | 32 a | 290.3 a | 15.6 a | |
†= Values with different letter in the same column are different (Tukey p≤ 0.05); ‡= reducing sugars.
Height and number of leaves per plant
The height and the number of leaves produced in the plants of the TA increased during the whole development cycle, their values were significantly lower (p≤ 0.05) than those registered in the plants developed with fertigation and FB+fertigation, without existing differences in the height values of these last plants. The values of both characteristics generated in the evaluations were significantly adjusted to quadratic models (Table 3), with which the annual rate of accumulation of height and leaves was estimated, during the development of the plant (Table 4).
Table 3 Regression models, mean square of the regression error (CMER) and coefficients of determination generated for the height and number of leaves recorded in the agave plant.
| Estimated feature | Regression model | CMER | R2 |
| Height (cm) | |||
| Fertigation | Y= -0.042+4.72+39.22 | 108.61 | 0.95† |
| FB+ Fertigation | Y= -0.052+5.57+30.22 | 73.35 | 0.97 |
| Absolute witness | Y= 0.006+0.42+58.09 | 70.61 | 0.89 |
| Number of leaves | |||
| Fertigation | Y= -0.012+2.16+35.14 | 190.15 | 0.84 |
| FB+ Fertigation | Y= -0.021+2.80+30.29 | 243.21 | 0.81 |
| Absolute witness | Y= -0.019+1.73+18.529 | 34.99 | 0.81 |
†= significant (p≤ 0.05).
Table 4 Annual growth rate (cm plant-1) and production of leaves (leaves plant-1), estimated using the models generated with the original information.
| Months after planted (MDP) | Height growth rate | Leaf production rate | |||||
| Fertigation | FB+ fertigation | Absolute control | Fertigation | FB+ fertigation | Absolute control | ||
| (cm plant -1 year -1) | (Leaves plant -1 year -1) | ||||||
| 12 | 46 | 54 | 7 | 37 | 31 | 3 | |
| 24 | 39 | 44 | 9 | 32 | 27 | 3 | |
| 36 | 27 | 29 | 10 | 23 | 20 | 4 | |
| 48 | 15 | 14 | 11 | 13 | 14 | 4 | |
| 60 | 2 | -1 | 12 | 4 | 7 | 4 | |
| 72 | -10 | -15 | 13 | -5 | 0 | 4 | |
In the plants of the TA, during the first year of established an increase of 7 cm in the height was estimated, growth rate that increased year by year, registering during the sixth year 13 cm as the highest annual growth rate (Table 4). The height in the plants of the TA at the end of the cycle (77 MDP) was 129 cm, height that in the plants that received water and nutrients in the irrigation system was registered in the first third of its cycle (22 MDP). In the same way, the tendency that the TA plant showed to increase the height with advancing age, was inverted in the plants with Fertigation and FB+fertigation, during the first year (12 MDP) these plants presented the highest growth rate increasing its height 46 and 54 cm, respectively; as the development cycle progressed, its growth rate decreased, at 48 MDP the height of the plant only increased 14 cm.
The number of leaves produced in the agave plant presented a behavior similar to the height previously described. The TA plants at 41 MDP had 57 leaves and was the largest number of leaves; amount that represented only 43% of the number of leaves that were recorded on average in plants developed with fertigation and fb+fertigation, the differences between plants that received fertilizer in the irrigation system and those that developed without irrigation were significant (p≤ 0.05).
The estimated annual rate of leaf production, allows us to infer that the TA plant in the first two years produced three leaves each year, later the plant increased its production to four leaves per year; this trend in the annual rate of leaf production was invested in the agave plants developed with fertigation and FB+fertigation (Table 4). In these last plants during the first two years an annual production of leaves 10 times higher was estimated with respect to the estimated production in TA plants. As the plant cycle progressed, the number of leaves produced per year decreased (Table 4), a situation that could be associated with a 48% decrease in the volume of irrigation water and the contribution of nutrients received by these plants in the sixth year of its development.
The greater production of leaves in the first years of development of the plant and its decrease in advancing the cycle of the plant, stage in which the pineapple develops, may indicate less internal competition of the plant between both structures. These results differ from those recorded by Nobel and Valenzuela (1987), in commercial plantings established in Tequila, Jalisco, who recorded an annual leaf production of 34 and 46 in A. tequilana plants, of three and six years, respectively.
Biomass in plant and pineapple
Biomass in the agave plant increased as the development cycle progressed, a tendency that at 41 and 77 MDP was modified negatively in TA plants, while in those developed with fertigation and FB+fertigation the biomass decreased only at the end of the cycle (77 MDP) (Table 5). In the TA plant, this decrease in biomass can be directly associated with a lack of moisture in the soil caused by the scarce rainfall registered between 54 and 77 MDP, without considering the distribution of rainfall during this period, the total rainfall represented only 44% of recorded evaporation.
Table 5 Fresh weight (PF) and dry weight (PS) accumulated in plant and pineapple (kg) in the evaluation stages during the development of the agave plant.
| Treatment | Months of agave development | |||||||
| 4 | 9 | 17 | 29 | 41 | 53 | 65 | 77 | |
| Plant | Fresh weight (kg plant-1) | |||||||
| Absolute control | 2.4 b† | 6.2 a | 15.2 b | 20.4 b | 13.8 b | 19.5 b | 30.4 b | 29.4 b |
| Fertigation | 5.2 a | 8.9 a | 34.1 a | 60.9 a | 86 a | 97.1 a | 159.2 a | 138.2 a |
| FB + fertigation | 5.4 a | 9.1 a | 31.1 a | 76.2 a | 89.5 a | 135.6 a | 176.1 a | 148.9 a |
| Pineapple | ||||||||
| Absolute control | 0.8 b | 1.3 a | 2.9 b | 5.3 b | 6.2 b | 8.1 b | 11.7 b | 14.1 b |
| Fertigation | 1.5 a | 2.2 a | 8.1 a | 15.3 a | 23.5 a | 33.1 a | 63.9 a | 66.1 a |
| FB + fertigation | 1.6 a | 2.2 a | 7.3 a | 18.3 a | 24.0 a | 46.7 a | 69.3 a | 76.4 a |
| Plant | Dry weight (kg plant-1) | |||||||
| Absolute control | 0.4 b | 0.9 b | 2.2 b | 3.5 b | 3.3 b | 5.8 b | 7.7 b | 6.9 b |
| Fertigation | 0.7 a | 1.1 ab | 4.7 a | 10.7 a | 13.4 ab | 25 a | 41.4 a | 36.5 a |
| FB + fertigation | 0.7 a | 1.4 a | 4.5 a | 11.9 a | 16.7 a | 31.6 a | 43.7 a | 39.8 a |
| Pineapple | ||||||||
| Absolute control | 0.1 b | 0.2 a | 0.7 b | 1.2 b | 1.4 b | 3.7 b | 4.1 b | 4.5 b |
| Fertigation | 0.2 a | 0.4 a | 1.3 ab | 3.5 a | 4.7 ab | 12.9 a | 21.2 a | 23.6 a |
| FB + fertigation | 0.2 a | 0.4 a | 1.3 a | 3.5 a | 6.4 a | 16.8 a | 21.6 a | 24.6 a |
†= Values with different letter in the same column are different (Tukey p≤ 0.05).
In the pineapple, the biomass increased during the whole cycle, independently of the conditions in which the agave plant was developed, indicating that, faced with a stress due to lack of moisture, the plant sacrifices the accumulation of biomass in the foliage, for the benefit of pineapple development, (Table 6). And this last body, until two years after the plant was established, it accumulated 23% of the total biomass of the plant and at the end of the cycle this percentage increased to 49%, a value slightly lower than 54% of the biomass reported in pineapple plants between 6 and 7 years by Nobel (1990).
Table 6 Annual production rate of dry biomass in the pineapple and the agave plant developed under three conditions of fertilization management.
| Treatment | Production of MS between evaluation stages | |||||
| 4 - 17 | 18-29 | 30-41 | 42-53 | 54-65 | 66-77 | |
| Plant | Between stages (kg of MS plant-1) | |||||
| Absolute witness | 1.8 ±0.15† | 1.3 ±0.09 | -0.2 ±0.32 | 2.5 ±3.01 | 1.9 ±4.04 | -0.7 ±0.54 |
| Fertigation | 4 ±0.75 | 6 ±1.93 | 2.6 ±2.15 | 11.6 ±7.9 | 16.5 ±10.15 | -4.9 ±2.86 |
| FB + Fertigation | 3.8 ±0.41 | 11.1 ±1.26 | 4.9 ±3.22 | 14.9 ±9.57 | 12 ±10.3 | -3.8 ±2.16 |
| Pineapple | ||||||
| Absolute witness | 0.6 ±0.05 | 0.5 ±0.05 | 0.2 ±0.06 | 2.2 ±1.25 | 0.4 ±1.61 | 0.5 ±0.3 |
| Fertigation | 1 ±0.32 | 2.3 ±0.24 | 1.2 ±0.82 | 8.2 ±3.35 | 8.3 ±5.57 | 2.4 ±0.16 |
| FB + Fertigation | 1.1 ±0.18 | 3.3 ±0.39 | 2.9 ±1.6 | 10.4 ±1.89 | 4.8 ±2.56 | 3 ±1.1 |
†= Values are means ± standard error; N= 3 plants.
The agave plants that received water and fertilizer in the treatments with fertigation and FB+fertigation, presented values of fresh weight (PF) of the plant and pineapple equal to each other (p≤ 0.05), but much higher than those registered in both characteristics of the plants developed in the TA; the greatest difference in the production of biomass accumulated between these plants and those developed in the TA was observed at 63 MP, at this stage they exceeded on average 5.5 and 5.7 times the total biomass recorded in the plant and pineapple of the TA, respectively.
The high MS production recorded in agave plants developed with fertigation and FB+fertigation shows that the negative effects of a high temperature on the agave plant mentioned by Nobel et al. (1998) and Pimienta-Barrios (2001), were minimized when the agave plant was developed without moisture limitations during the whole cycle, through fertigation (Table 5).
With the values of biomass recorded at 77 MP, in plants developed with the technique of fertigation and FB+fertigation and considering a commercial planting density of 3 300 plants ha-1, a production of 491.4 and 456.1 t ha-1 was estimated. total biomass in the plant and pineapple of 218.1 and 252.4 t ha-1, respectively; while in the TA plants, the total biomass estimated in the plant was 97 t ha-1, and in pineapple, a yield of 46.5 t ha-1. This shows that the water and nutrients provided to the agave crop in an intensive production system (fertigation) allows pineapple yields higher than 100.1 t ha-1 to be recorded as the average production value in the 2006 to 2015 period in the state of Jalisco (SAGARPA, 2016).
From the total biomass recorded in the agave plant to 4 MDP, the MS represented 14% and the remaining 86% was humidity, as the age of the plant increased, the MS increased to 27% to the detriment of humidity. Five years and 5 months after the plant was established (65 MDP), the highest amount of MS was recorded in the plant, with an estimated 140.4 t of MS ha-1 as an average value of production in plants developed with fertigation and FB+fertigation, amount significantly higher than the 25.5 t ha-1 estimated in the TA plant (Table 5). The water and nutrients that were received through the irrigation system plants developed with fertigation and FB+fertigation originated up to 65 MDP, variable increases in the annual MS production rate (Table 7), the highest estimated annual MS production rate it was 54.4 and 49.2 t ha-1, respectively, values that averaged 6.2 times the maximum annual accumulation of MS that occurred in the TA plant and also exceeded the production of 21.1 t ha-1 year-1 reported by Nobel and Valenzuela (1987) in six-year-old A. tequilana plants, established in the state of Jalisco.
Table 7 Concentration of monosaccharides in the dry matter of the Agave tequilana plant in different stages of its development.
| Treatment | Monosaccharide | Months of plant development (g kg-1 of MS) | |||||
| 17 | 29 | 41 | 53 | 65 | 77 | ||
| Absolute control | Fructose | 11.4 ±0.8† | 43.9 ±3 | 63.3 ±5.7 | 41.9 ±3.6 | 219 ±21.4 | 233.5 ±15.2 |
| Glucose | 22.4 ±6.4 | 14.8 ±4.3 | 224.7 ±20.4 | 260.7 ±24.9 | 30.1 ±2.8 | 34.1 ±0.7 | |
| Fertigation | Fructose | 12.6 ±0.6 | 48.8 ±12 | 54.7 ±4.1 | 37.3 ±2 | 244.4 ±7.8 | 252.6 ±5.1 |
| Glucose | 31.2 ±1.6 | 20.7 ±3.5 | 194.2 ±14.7 | 271.5 ±7.4 | 33.6 ±1.5 | 36.5 ±1.5 | |
| FB+ Fertigation | Fructose | 60 ±9.4 | 60 ±9.4 | 50.1 ±11 | 39.2 ±10.7 | 244.4 ±24.2 | 254.2 ±24.2 |
| Glucose | 32.4 ±1.9 | 32.4 ±1.9 | 177.7 ±38.9 | 277 ±43.8 | 33.3 ±3.2 | 36 ±3.8 | |
†= Values are means ± standard error; N= 3 plants.
In the TA plants between 30 and 41 MDP and during the last evaluation between 66 and 77 MDP the annual rate of DM production in the whole plant presented negative values; while, in the pineapple, the estimated MS accumulation rate increased throughout the plant’s development cycle (Table 6).
The negative values in the annual rate of production of MS, indicate that in two continuous evaluations carried out in plants selected at random, the highest MS value was registered in plants of the first sampling. On the other hand, in the early stages of development of the plant, the annual MS production rate registered lower negative values with respect to those registered in adult plants; this situation can be associated, among other things, with a lower demand for humidity in small plants and also in that period coincided with the record of low temperatures of the cycle that, according to the studies of Novel et al. (1998); Pimienta-Barrios et al. (2001), could be more favorable for the development of the plant. The decrease in the rate of MS accumulation in the agave plant observed at the end of the cycle (77 MDP), as mentioned above, was also associated with the reduction in the volume of water and fertilizer that they received between 54 and 77 MDP.
Sugars in the pineapple
The concentration of ºBrix and ART in the pineapple at 6 years and 7 months of development of the agave plant (77 MDP), was not modified by the fertilizer and water it received (p≤ 0.05), Table 2; in this stage, ART concentration fluctuated between 26.8 and 29%, ART values slightly lower than 30.8 and 32.7%, reported by Mellado-Mojica and López (2012), in pineapples harvested in the state of Jalisco during the wet season and dry, respectively. According to Mancilla-Margalli and López (2006), the environmental conditions originated that in pineapples of A. tequilana of 6 years of age harvested in Jalisco, 900 mg g-1 of MS of soluble total carbohydrates (sucrose, fructose and glucose) were registered. While in Guanajuato, pineapples of the same age were only 550 mg g-1 of MS.
Variations in the concentration of ART in the MS of the pineapple in the present study were recorded by the effect of the management conditions in which the plants were developed and also by the effect of the development of the plant (Figure 1); that is, at 29 MDP the mean value of ART in the pineapples of the three plants was 246.3 g kg MS, 2.6 below and 3.4 times the median concentration value of ART registered at 65 and 77 MDP, respectively; in these last two stages of cultivation in the pineapple of the plant developed in the TA the highest concentration of ART was recorded, a situation that can be associated with the metabolic flexibility of the agaves that allows them to adapt to different environmental conditions where the availability of water in these plants it is the limiting factor.
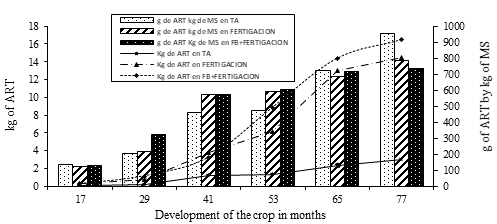
Figure 1 Accumulation of total reducing sugars (ART, kg pineapple-1) and concentration of ART (g kg of MS) in the pineapple of agave plants developed under three conditions of fertilizer management.
According to the above, the water and fertilizers applied through the fertigation technique to the agave plant in the warm region of southern Tamaulipas, allowed to produce greater volumes of pineapple, with a concentration of sugars similar to that determined in plants developed in the TA. However, when favoring the growth of pineapple in plants that received fertigation and FB+fertigation, the quantity of ART was increased 5.3 times with respect to the pineapple of plants developed in the TA (p≤ 0.05) (Table 4).
These differences in the values of ART in the pineapple of the plants of the TA and the pineapples of plants developed with fertigation were observed from the initial stages of development of the agave plant, (Figure 3). However, regardless of the nutritional management received by the agave plant, at 41 MDP (3 years and 5 months) the plants accumulated in the pineapple 22% of the ART, with respect to the value of ART determined in the agave pineapple. At the end of the cycle (77 MDP), the remaining 78% was accumulated in later stages.
The monosaccharides that were part of the ART of the agave pineapple (fructose and glucose) were not affected by the nutritional management that the plant received. In the initial stage at 17 MDP, the concentration of fructose and glucose in the ART showed a mean value of 28.25 g kg-1 of pineapple MS (Table 7); that is, in the first evaluation, both monosaccharides were at the same concentration in the pineapple. Subsequently, fructose and glucose showed a tendency to differentially increase their concentration: with respect to glucose at 53 MDP, 269.7 g kg-1 of pineapple MS was estimated, this value represented 87% of the total concentration of both monosaccharides present in the pineapple. ART and which decreased up to 12% during the last two evaluations (65 and 77 MDP).
The decrease of the glucose during the stage of greater growth of the pineapple (two last evaluations), originated increases in the concentration of fructose in the ART whose average value was 246.8 g kg-1 of pineapple MS and represented 88% of the total of the monosaccharides evaluated. The behavior of these monosaccharides in the pineapples of A. tequilana plants was different from that previously reported by Mellado-Mojica and López (2012), who, in pineapples of different ages collected in Amatitlán, Jal., Mexico, reported higher fructose concentrations to glucose concentration regardless of the stage of development of the pineapple.
Conclusions
The development of the Agave tequilana plant through the fertigation technique, receiving water and nutrients throughout the cycle of its development, allowed demonstrating:
Plants developed with fertigation present a greater growth from initial stages of the cycle, registering in average 180 cm of height and 148 leaves, exceeded in 26 and 57%, respectively, the values registered in these characteristics in plants developed without irrigation and without fertilizer.
With a commercial seeding density of 3 300 plants ha-1, in plants developed with fertigation, a total biomass production in the plant was estimated between 456.1 and 491.4 t ha-1 and in the pineapple between 218.1 and 252.4 t ha-1; values higher than 97 t ha-1 and 46.5 ha-1 of total biomass of the plant and pineapple, respectively, estimated in TA plants.
The concentration of sugars in the pineapple evaluated as °Brix and AR were not affected by the water and fertilizer management.
Gratefulness
To the Produce Tamaulipas Foundation, AC, for the financing of the research project during 2004-2012.
REFERENCES
Borland, A. M.; Griffiths, H.; Hartwell, J. and Smith, J. A. C. 2009. Exploiting the potential of plants with crassulacean acid metabolism for bioenergy production on marginal lands. J. Exp. Bot. 60(10):2879-2896. [ Links ]
Escamilla-Treviño, L. L. 2012. Potential of plants from the genus Agave as bioenergy crops. Bioenerg. Res. 5(1):1-9. [ Links ]
Gentry, H. S. 1982. Agaves of Continental North America. The University of Arizona Press, Tucson, Arizona, USA. 670 p. [ Links ]
Hartsock, L. T. and Nobel, S. P. 1976. Watering converts a CAM plant to daytime CO2 uptake. Nature. 262(8):574-576. [ Links ]
Heikkinen N. 2015. Does agave hold the secret to drought-resistant farming?. Scientific American. http://www.scientificamerican.com/article/does-agave-hold-the-secret-to-drought-resistant-farming/. [ Links ]
INEGI. 2016. (Instituto Nacional de Estadística, Geografía e Informática).Mapa digital de México 2016. http://gaia.inegi.org.mx/mdm6/?v=bGF0OjIyLjc5MTQyLGxvbjotOTguODQ0MjYsejo1LGw6YzQxNg. [ Links ]
Iñiguez-Covarrubias, G.; Díaz-Teres, R.; Sanjuan-Dueñas, R.; Anzaldo-Hernández, J. and Rowell, R. M. 2001. Utilization of by-products from the tequila industry. Part 2: potential value of Agave tequilana Weber azul leaves. Bio. Technol. 77(2):101-108. [ Links ]
Li, H.; Pattathil, S.; Foston, B. M.; Ding, S-Y.; Kumar, R.; Gao, X.; Mittal, A.; Yarbrough, M. J.; Himmel, E. M.; Ragauskas, J. A.; Hahn, G. M. and Wyman E. C. 2014. Agave proves to be a low recalcitrant lignocellulosic feedstock for biofuels production on semi-arid lands. Biotechnol. Biofuels. 7(50)1-11. [ Links ]
Mancilla-Margalli, N. A. and López, M. G. 2006. Water-soluble carbohydrates and fructan structure patterns from Agave and Dasylirion species. J. Agric. Food Chem. 54(20):7832-7839. [ Links ]
Mellado-Mojica, E. and López, M. G. 2012. Fructan metabolism in A. tequilana Weber Blue variety along its developmental cycle in the field. J. Agric. Food Chem. 60(47):11704-11713. [ Links ]
Nobel, S. P. 1990. Environmental influences on CO2 uptake by agaves, cam plants with high productivities. Econ. Bot. 44(4):488-502. [ Links ]
Park, S. N. Desert wisdom/agaves and cacti: CO2, water, climate change. 2010. iUniverse, Inc. New York, NY and Bloomington, IN. 182 pp. [ Links ]
Nobel, S. P. and Valenzuela, G. A. 1987. Environmental responses and productivity of the CAM plant, Agave tequilana. Agricultural and Forest Metereorology. 39(4):319-334. [ Links ]
Nobel, S. P.; Castañeda, M.; North, G.; Pimienta-Barrios, E. and Ruiz, A. 1998. Temperature influences on leaf CO2 exchange, cell viability and cultivation range for Agave tequilana. J. Arid Environ. 39(1):1-9. [ Links ]
Secretaría del Medio Ambiente y Recursos Naturales Norma Oficial Mexicana NOM-021-SEMARNAT-2000. Que establece las especificaciones de fertilidad, salinidad y clasificación de suelos. Estudios, muestreo y análisis.Diario Oficial de la Federación en línea http://biblioteca.semarnat.gob.mx/janium/Documentos/Ciga/libros2009/DO2280n.pdf. [ Links ]
Owen, A. N. and Griffiths, H. 2014. Marginal land bioethanol yield potential of four crassulacean acid metabolism candidates (Agave fourcroydes, Agave salmiana, Agave tequilana and Opuntia ficus-indica) in Australia. Global Change Biology. Bioenergy. 6(6):687-703. [ Links ]
Pimienta-Barrios, E.; Robles-Murguía, C. and Nobel, P. S. 2001. Net CO2 Uptake for Agave tequilana in a warm and a temperate environment. Biotropica. 33(2):312-318. [ Links ]
Rendón, S. L. A.; Ávila M. M. E.; Rodríguez, G. B. y Del Real, L. J. I. 2011. (Eds): manual técnico para el establecimiento de huertas madre de agave azul. Consejo regulador del Tequila (C.R.T.). Libro técnico núm. 1. 127 p. [ Links ]
SAGARPA. 2016. (Secretaría de Agricultura, Ganadería, Pesca y Alimentación). Anuario estadístico. Oiedrus Jalisco. http://www.oeidrus-jalisco.gob.mx/agricultura/anuarios/. [ Links ]
Somerville, C.; Youngs, H.; Taylor, C.; Davis, C. S. and Long, S. P. 2010. Feedstocks for lignocellulosic biofuels. Science. 329(1):790-792. [ Links ]
Wullschleger, D. S.; Hao-Bo, G.; Reyes, C. and Aguilar, N. C. 2015. A roadmap for research on crassulacean acid metabolism (CAM) to enhance sustainable food and bioenergy production in a hotter, drier world. New Phytologist. 207(3):491-504. [ Links ]
Received: March 00, 2018; Accepted: May 00, 2018
 Este es un artículo publicado en acceso abierto bajo una licencia Creative Commons
