


Servicios Personalizados
Revista
Articulo
 texto en
  Inglés (pdf)
 Artículo en XML
 Referencias del artículo
 Enviar artículo por email
Indicadores
-
 Citado por SciELO
 -
 Accesos
Links relacionados
-
 Similares en
SciELO
Similares en
SciELO
Compartir

 Permalink
Revista mexicana de ciencias agrícolas
versión impresa ISSN 2007-0934
Rev. Mex. Cienc. Agríc vol.9 no.1 Texcoco ene./feb. 2018
https://doi.org/10.29312/remexca.v9i1.864
Investigation note
Intensities of multidimensional poverty in Mexico at municipal level
1División de Ciencias Económico Administrativas-Universidad Autónoma Chapingo. Carretera México-Texcoco km 38.5. Chapingo, Texcoco, Estado de México, México. CP. 56230. Tel. 01(595) 1109855. (libelunazul@gmail.com; mportillo49@yahoo.com.mx).
The objective of this research was to develop a typology that would allow to distinguish intensities of multidimensional poverty among the poorest municipalities of Mexico, characterize them and locate them geospatially. A database was created with municipal statistics prepared by CONEVAL and INAFED. Of the 2 456 municipalities of the country, the 1 659 were selected whose average income is below the line of economic welfare. The matrix prepared in Excel was exported to Infostat, where multivariate statistical methods were used, particularly cluster analysis. Three conglomerates were obtained, which are represented with maps made with ArcGis. The typology obtained groups the municipalities that do not reach the well-being line in three levels of poverty intensity, whose specific characteristics and geospatial distribution are considered a useful reference when targeting programs to combat poverty.
Keywords: conglomerates; multivariate analysis; rural development; targeting; welfare
El objetivo de esta investigación fue elaborar una tipología que permitiera distinguir intensidades de pobreza multidimensional entre los municipios más pobres de México, caracterizarlos y ubicarlos geoespacialmente. Se conformó una base de datos con estadísticas municipales elaboradas por CONEVAL e INAFED. De los 2 456 municipios del país, se seleccionó a los 1 659 cuyo ingreso promedio se encuentra por debajo de la línea de bienestar económico. La matriz elaborada en Excel se exportó a Infostat, donde se procedió a partir de métodos estadísticos multivariados, particularmente análisis de conglomerados. Se obtuvieron tres conglomerados que se representan con mapas elaborados con ArcGis. La tipología obtenida agrupa a los municipios que no alcanzan la línea de bienestar en tres niveles de intensidad de la pobreza, cuyas características específicas y distribución geoespacial se consideran una referencia útil al momento de focalizar los programas de combate a la pobreza.
Palabras clave: análisis multivariado; bienestar; conglomerados; desarrollo rural; focalización
Introduction
Poverty can be understood from different spheres, Spicker (2009) distinguishes three: social, material and economic. In the social it identifies it as a class that generally entails a pejorative and discriminatory sense; in the material, such as the limitation of resources and the presence of needs that remains a pattern of deprivation; and in the economic one as an unacceptable degree of inequality. The problem is so complex that in addition to being able to be perceived from different areas, according to the interest of the one who does it, several methods and variables are adopted to measure and define poverty.
A few years ago, in Mexico, three welfare lines were defined to locate the population with insufficient income in three situations: food poverty, poverty of skills and property poverty. Since 2008, poverty is measured with a multidimensional method, which combines the dimension of social rights, based on six fundamental rights: food, health, education, housing, basic services and social security and the income dimension from four wellness lines that are updated each month based on the cost of food and non-food baskets in rural and urban areas. With this new approach, “a person finds himself in a situation of multidimensional poverty when he is not guaranteed the exercise of at least one of his rights for social development, and his income is insufficient to acquire the goods and services he needs to satisfy his needs”. CONEVAL (2009).
The experience of Latin American countries such as Chile, Uruguay and Bolivia, shows that the use of multivariate statistical techniques for the classification and grouping of the population living in poverty, in order to identify the target population of government programs, are an effective tool to reduce poverty levels (Brodersohn, 1999). Unlike the stagnation in the level of poverty in Mexico that has affected half of the national population for thirty years; in Uruguay poverty fell from 47% in 1986 to 6.2% in 2016 and in Bolivia, statistics went from 66% in 2000 to 38% in 2015. In the case of Chile where the multidimensional method is also used, poverty went from 45% in 1987 to 12% in 2015 measured with the income method and 28% to 21% between 2009 and 2005 measured with the multidimensional method (CONEVAL 2016; INE, 2017a; INE, 2017b; CASEN, 2017).
Sen (2000); ONU (2004), agree that poverty is a specific experience, local and circumstantial; that is explained by many variables and manifests as the inability to meet needs and develop capacities, but how to combat a level of poverty that affects so many in a country as heterogeneous as Mexico? and why is it so important to distinguish particular characteristics that lead to adequate targeting of public programs? it is precisely the specificity of the incidence of poverty and the particular needs of the affected population that is to be addressed in this research.
We worked with official statistical information available at the municipal level reported by the National Council for the Evaluation of Social Development Policy (CONEVAL) and the National Institute for Federalism and Municipal Development (INAFED). To the seven indicators of multidimensional poverty, the Gross Domestic Product (PIB) per capita and the economic participation rate was added. Under the premise that the income indicator is the main variable that determines the degree of poverty in a society (Foster et al., 1984), the first prioritization criterion was to choose only those municipalities whose average income is below the line of economic well-being (LB), for which the measurement in rural and urban areas of the reference year was considered. Thus, of the 2 456 municipalities that make up the Mexican Republic, 1 659 were selected whose average income is below the LB.
The information was ordered in a matrix form and imported into the Infostat program, where it was worked from multivariate analysis. In particular, a cluster or group analysis was carried out, which allows individuals to be grouped into groups that are heterogeneous with each other and homogeneous within (Diaz et al., 1997; Peña, 2002; De Martinelli, 2012). The principle of non-hierarchical agglomeration K-means was selected for large samples and squared Euclidean distance, data were standardized, five initial configurations were taken and the obtaining of three clusters was determined. The algorithm used can be expressed as follows:
In Mexico, 1 659 municipalities that represent 68% of the total, receive an average income that does not cover the basic basket, a fact that in principle represents a serious problem of poverty in the country. On the other hand, only 797 municipalities; that is, another 32% has an average income level above the welfare line that represents the cost of the basic food and non-food basket. The municipalities below the welfare line include 27.5 million people, of which 20.7 million are poor, that is, 75%. But in addition, 29% are extreme poor, which means triple the incidence of extreme poverty compared to the national total. In this way, the typology is applied to the 1659 municipalities where income and access to basic social rights are a generalized problem for the population.
Type A municipalities
The first conglomerate groups the 627 most marginalized municipalities in the country, where 6.7 million people live, of which 9 out of 10 live in poverty and 5 out of 10 live in extreme poverty. This group includes 62% of the indigenous municipalities of Mexico, with a diversity of more than 30 ethnic groups, the most representative being the Nahua, Tzeltal, Tzotzil, Mixtec and Tarahumara.
The income represents only 60% of the cost of the basic basket and the conditions of generalized marginality are reflected in the fact that 8 out of 10 people lack basic services, which prevents or hinders the access to other rights. About 4 out of 10 inhabitants lack access to education, health, food and housing quality and spaces; and access to social security includes practically the entire population, which is explained by the almost non-existence of formal jobs. The main sources of income are government programs, other transfers and income from independent salaried work, with agricultural activities being representative.
This first group includes approximately half of the municipalities of the states of Chiapas, Oaxaca and Guerrero, as well as a third of the municipalities of Puebla and Veracruz, making these five states, with the greatest diversity of the country’s indigenous population, those of greater emergency in terms of poverty. These states have historically been the poorest, which has led them to be the predominant target population of government transfers (Lusting and Szekely, 1997); however, unlike the other conglomerates, the proportion of people living in poverty continues to increase.
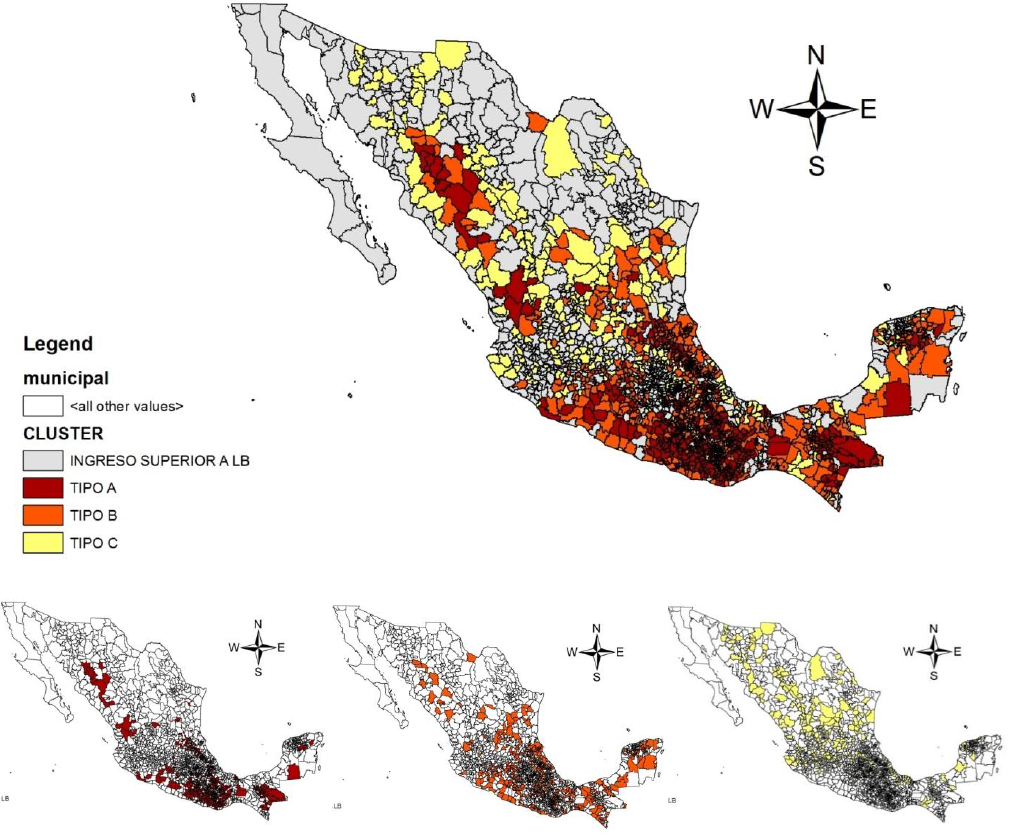
On the other hand, it is important to note that conglomerate A is mainly representative, but not exclusive to the south of the country. Such is the case of 9 Tarahumara municipalities of Chihuahua bordering Sinaloa, 11 Nahua municipalities of Hidalgo bordering Veracruz, 10 Nahua, Pampas and Huastecan municipalities of the central, middle and Huasteca regions of San Luis Potosí and 11 Mayan municipalities of Yucatan that border Quintana Roo (Table 1 and Figure 1).
Table 1 Indicators of poverty by conglomerates.
| Indicador | A | B | C | Total |
| Number of municipalities | 627 | 627 | 405 | 1659 |
| Number of locations | 33 144 | 49 178 | 33 301 | 115 623 |
| Number of inhabitants | 6 714 871 | 1 231 5042 | 8 583 131 | 27 613 044 |
| Percentage of people in poverty | 88% | 75% | 66% | 75% |
| Percentage of people in extreme poverty | 51% | 28% | 15% | 29% |
| Average monthly per capita income ($) | 772 | 1213 | 1531 | 1172 |
| Average number of people lacking access to basic services | 83% | 61% | 33% | 59% |
| Average number of people lacking access to quality and housing spaces | 44% | 29% | 16% | 30% |
| Average number of people lacking access to food | 38% | 30% | 25% | 31% |
| Average number of people lacking access to education | 42% | 33% | 28% | 34% |
| Average number of people lacking access to health services | 41% | 38% | 30% | 36% |
| Average number of people lacking access to social security | 92% | 85% | 78% | 85% |
| Average PIB per capita ($) | 23 828 | 32 933 | 44 260 | 3 3674 |
| Average economic participation rate | 40% | 46% | 47% | 44% |
| Average employed population with less than 2 minimum wages | 82% | 69% | 59% | 70% |
| Average index of marginalization (0-100) | 41.41 | 31.09 | 24 | 32.17 |
| Average value of the human development index (HDI) | 0.55 | 0.62 | 0.66 | 0.61 |
Source: elaboration with information from CONEVAL, INAFED and CDI.
Type B municipalities
The second conglomerate also includes 627 municipalities, but almost twice as many inhabitants as in the first conglomerate. In this case, 35% of the municipalities are indigenous or with the presence of an indigenous population; the most representative ethnic groups are Nahua and Mayan. Around 9 out of 12 million people live in poverty; however, the intensity decreases because the extreme poor are reduced to 28% of the population. The average income allows to cover the cost of the rural basic food basket but not the basic non-food basket.
The lack of access to basic services still affects 6 out of every 10 inhabitants and around a third of the population lacks access to quality and spaces for housing, food, education and health. The proportion of people lacking social security decreases slightly but even the vast majority of families are engaged in activities that earn less than two minimum wages per day. Transfers continue to be important, but as a complement to the income from salaried work and independent work, taking on more weight than non-agricultural work.
It is striking that this conglomerate is representative of the states of Mexico, Querétaro and Michoacán, same as in the classification elaborated by Székely et al. (2007), some years ago, they were considered as states with a medium level of poverty. The most accelerated case of poverty increase occurs in Michoacán, an entity for which Lenin et al. (2009) observes a discouraging trend since 2005. In addition to the regions of Tierra Caliente and Apatzingan Valley in Michoacán, in this conglomerate the Huauchinango and Tehuacán regions in the state of Puebla, adjacent to the states of Veracruz and Oaxaca, as well as the Huasteca region of San Luis Potosí.
In the same way, the conglomerate includes municipalities with specific geographical characteristics. On the one hand, there are municipalities in the state of Mexico that are located on the border with Guerrero and Michoacán. On the other hand, a large part of the Yucatán peninsula is observed, which includes the municipalities of Campeche that are not located in the limits of the Gulf of Mexico, the east of Yucatán, the sierra and Usumacinta the Tabasco region and the municipalities that do not form part of the archaeological zone of Quintana Roo.
Type C municipalities
The 405 type C municipalities that make up the third conglomerate, concentrate 8.5 million inhabitants, of which 66% are in multidimensional poverty and 15% in extreme poverty. Unlike the previous conglomerates, in this one there is not a significant proportion of indigenous inhabitants because it is dispersed, in contrast, rural-urban links take great importance. The average income allows to cover the cost of the rural or urban basic food basket, but it still does not reach the economic welfare line, since 6 out of every 10 inhabitants live with less than 2 minimum wages. The income comes mainly from salaried work, however, it is presumed that temporary and informal jobs predominate, since the lack of access to social security persists in 8 out of 10 inhabitants. This conglomerate shows an important advance in the quality and spaces of housing and access to basic services, but there are still significant lags in food, education and health.
The geographic location predominates in the center and north of the country. Here is the highest proportion of the poor in the states of Sinaloa, Sonora, Coahuila, Durango, Guanajuato, Jalisco, Nayarit, Zacatecas, Tamaulipas, Aguascalientes, Morelos and Tlaxcala. In some cases, specific regional characteristics are observed in the location of the municipalities for each entity. For example, for Sinaloa, Sonora and Nayarit this conglomerate includes municipalities far from the coast, which is also the agricultural area. Also, in Tamaulipas the conglomerate includes municipalities far from the border with the United States.
Conclusions
The current methodology for measuring multidimensional poverty in Mexico shows that the incidence is very high, but also very heterogeneous. The described typology allows to contrast intensities of poverty, locate them geo-spatially and make comparisons between municipalities, entities and regions; which is considered a useful reference for the design of public policies.
Under the premise that the problem is more serious where it is more intense and widespread, the municipalities that are part of the typology should be a priority in the fight against poverty of each entity. This level of poverty not only represents a violation of human rights, but also puts the next generations at a great disadvantage, affecting the continuity of the cycle of poverty.
Income is the main indicator of well-being, so supporting the productive capacity of municipalities and generating formal employment is the public policy with the greatest impact. In the dimension of social rights, the government must begin by differentiating which are the deepest social deficiencies in each conglomerate and guarantee access to fundamental rights such as basic services, food, education and health, among the population that truly needs it.
Literatura citada
Brodersohn, V. 1999. Focalización de programas de superación de la pobreza. In: Derecho a tener derecho: infancia, derecho y políticas sociales en América Latina. Montevideo. Instituto Interamericano del niño (IIN) y UNICEF. [ Links ]
CASEN (Encuesta de Caracterización Socioeconómica Nacional). 2017. Situación de la pobreza en Chile. Santiago de Chile. Ministerio de Desarrollo Social, Subsecretaría de Evaluación Social. [ Links ]
CONEVAL (Consejo Nacional de Evaluación de la Política de Desarrollo Social). 2009. Metodología para la medición multidimensional de la pobreza en México. México, D. F. [ Links ]
CONEVAL (Consejo Nacional de Evaluación de la Política de Desarrollo Social). 2016. Evolución de las dimensiones de la pobreza 1990-2014. México, D. F. [ Links ]
De Martinelli, G. 2012. De los conceptos a la construcción de los tipos sociales agrarios, una mirada sobre distintos modelos y las estrategias metodológicas. Argentina. Rev. Latinoam. Metodol. Inves. Soc. 2(1):24-43. [ Links ]
Díaz, B.; Cruces, E. y Morillas, A. 1997. Las regiones europeas: una tipología basada en la aplicación de técnicas multivariantes. Málaga. Rev. Astur. Econ. 10(1):249-265. [ Links ]
Foster, J.; Greer, J. and Thorbecke, E. 1984. Notes and comments: A class of decomposable poverty measures. Revista Econométrica. 3(52):761-766. [ Links ]
INE (Instituto Nacional de Estadística). 2017a. Indicadores de pobreza. Estado plurinacional de Bolivia. [ Links ]
INE (Instituto Nacional de Estadística Uruguay). 2017b. Incidencia de pobreza en hogares por área geográfica, según año. Encuesta continua de hogares. Uruguay. [ Links ]
Lenin, C., Hernández, P. y Chávez, J. 2009. Distribución del ingreso y pobreza en Michoacán, 1980-2005. Mundo Siglo XXI. México. Mundo Siglo XXI. CIESAS. Instituto Politécnico Nacional (IPN). 56-66 pp. [ Links ]
Lusting, N. y Székely, M. 1997. México: evolución económica, pobreza y desigualdad. Proyecto: los determinantes de la pobreza en América Latina. Washington, D. C. PNUD, BID y CEPAL. 50 p. [ Links ]
ONU (Organización de las Naciones Unidas). 2004. Human Rights and poverty reduction: a conceptual framework. Nueva York-Ginebra. 46 p. [ Links ]
Peña, D. 2002. Análisis de datos multivariantes. España. Mc-Graw Hill. 539 p. [ Links ]
Sen, A. 2000. Development as freedom. New York, Oxford . University Press. [ Links ]
Spicker, P. 2009. Definiciones de pobreza: doce grupos de significados. In: Spicker, P.; Álvarez, S. y Gordon, D. (eds.). Pobreza un glosario internacional. Colección CLACSO-CROP. 291-306 pp. [ Links ]
Székely, M.; López, L.; Meléndez, A.; Rascón, E. y Rodríguez, L. 2007. Poniendo a la pobreza de ingresos y a la desigualdad en el mapa de México. Economía Mexicana. Nueva Época. 2(16):239-303. [ Links ]
Received: January 00, 2018; Accepted: February 00, 2018
 Este es un artículo publicado en acceso abierto bajo una licencia Creative Commons
