


Servicios Personalizados
Revista
Articulo
 texto en
  Inglés (pdf)
 Artículo en XML
 Referencias del artículo
 Enviar artículo por email
Indicadores
-
 Citado por SciELO
 -
 Accesos
Links relacionados
-
 Similares en
SciELO
Similares en
SciELO
Compartir

 Permalink
Revista mexicana de ciencias agrícolas
versión impresa ISSN 2007-0934
Rev. Mex. Cienc. Agríc vol.9 no.1 Texcoco ene./feb. 2018
https://doi.org/10.29312/remexca.v9i1.846
Articles
Economic valuation for an environmental improvement in Leon, Guanajuato
1División de Ciencias Económico Administrativas-Universidad Autónoma Chapingo. Carretera México-Texcoco km 38.5. Texcoco, Estado de México. CP. 56230. (haalexx_86@hotmail.com.).
2División de Ciencias Forestales (DICIFO)-Universidad Autónoma Chapingo. Carretera México-Texcoco km 38.5. Texcoco, Estado de México. CP 56230.
3Preparatoria Agrícola-Universidad Autónoma Chapingo. Carretera México-Texcoco km 38.5. Texcoco, Estado de México. CP 56230.
4Consultor independiente. Calle Arboledas núm. 28, Montecillo Texcoco, Estado de México. CP. 56264.
The present work addressed the problem of environmental pollution that exists in the municipality of Leon, Guanajuato. The metropolitan area of Leon is located in the seventh place of environmental pollution nationwide. The municipality has a population of 1 436 733 inhabitants and concentrates 27.7% of the total vehicular park of the state of Guanajuato and there is also established the most important footwear industry in Mexico, which is reflected in an environmental deterioration. Environmental pollution in Leon is considerable, since 57.2% of the surveyed population states that air quality is bad. This situation is reflected in the environmental deterioration and health problems of the inhabitants of the city. The main objective of the research has been to estimate the willingness to pay by the population of the municipality of Leon, Guanajuato, for the creation of a green fund to help mitigate the environmental problems of the municipality. To estimate the DAP, the contingent valuation method was used, for which surveys were conducted to the inhabitants of the city of León, in this way the necessary information was collected in order to obtain the DAP of the inhabitants of the city. The average DAP per inhabitant estimated was $131.15 pesos, earning an annual income of around $60 408 083.45 pesos; that is, $4 174 712.06 dollars in the year of 2014, taking as reference a vehicular park of 460 603 units (UAIP, 2015) for the same year.
Keywords: contingent valuation; environment; willingness to pay (DAP)
El presente trabajo abordó el problema de la contaminación del medio ambiente que existe en municipio de León, Guanajuato. La zona metropolitana de León se ubica en el séptimo lugar de contaminación ambiental a nivel nacional. El municipio tiene una población de 1, 436, 733 habitantes y concentra 27.7% del total del parque vehicular del estado de Guanajuato y ahí se encuentra también establecida la industria del calzado más importante de México, lo que se ve reflejado en un deterioro ambiental. La contaminación ambiental en León, es considerable, ya que 57.2% de la población encuestada, manifiesta que la calidad del aire es mala. Esta situación se refleja en el deterioro ambiental y problemas de salud de los habitantes de la ciudad. El objetivo principal de la investigación ha sido estimar la disponibilidad a pagar por parte de la población del municipio de León, Guanajuato, para la creación de un fondo verde que ayude a mitigar la problemática ambiental del municipio. Para estimar la DAP, se empleó el método de valoración contingente para lo cual, se realizaron encuestas a los habitantes de la ciudad de León, de esta manera se recabó la información necesaria para poder obtener la DAP de los habitantes de la ciudad. La DAP promedio por habitante estimada fue de $131.15 pesos pudiendo obtener ingresos anuales de alrededor de los $60 408 083.45 pesos; es decir, $4 174 712.06 de dólares en el año de 2014, tomando como referencia un parque vehicular de 460 603 unidades (UAIP, 2015) para ese mismo año.
Palabras clave: disponibilidad a pagar (DAP); medio ambiente; valoración contingente
Introduction
In this era of globalization, the concern for care, conservation of the environment and natural resources, has caused environmentalists, as well as those in charge of carrying out economic and social development policies, to focus their attention on this topic of such in this way, the levels in the quality of life of the people of the present and the future are not threatened by scarcity, degradation and contamination of natural resources.
Air pollution is a significant problem for urban areas with a high level of industrial development and a large vehicular park, which intensifies the concentration of various pollutants exposing the population to the dangers associated with health. This implies an increase in efforts to reduce levels of concentration of pollutants that have a negative impact on the health of the population and the ecosystem in general. This situation leads to an increase in costs for the care of human health incurred by the health sector and which directly affects the income of people who do not have a free medical service.
Air pollution in the city of Leon is mainly caused by the high concentration of population, the vehicle fleet and the leather industry. It is worth mentioning that Leon is the most populated municipality in the state of Guanajuato. According to demographic data, only in the municipality of Leon there is a total of 1 436 733 inhabitants, in addition it concentrates 26.2% of the inhabitants of the whole State and at the national level it is the 7th most populous municipality (INEGI, 2010). Among the pollutants that stand out in this municipality are sulfur dioxide, carbon monoxide, nitrogen oxide and total organic compounds (IEG, 2006).
In view of this situation, the government of the state of Guanajuato, through the Institute of Ecology of the State, assumes the responsibility of assessing and taking measures to improve the quality of the environment in the state, which is one of the most important environmental challenges faces this Institute. In order to achieve these purposes, an automatic air quality monitoring network has been integrated, in order to have a real diagnosis of the problem of air pollution in the Industrial Corridor area (Leon, Silao, Irapuato, Salamanca, Celaya), typified as critical by the Official Mexican Standard NOM-085-SEMARNAT-1994 (IEG, 2006).
The municipality of Leon has three automatic monitoring stations: the Chamber of the Footwear Industry of the state of Guanajuato (CICEG), the IMSS-T21 and the one of the Faculty of Medicine (FM). The monitoring stations of Leon are managed by the Institute of Ecology of Guanajuato and its operation is under the responsibility of the Technological University of León.
The municipality of Leon occupies the first place in the contribution of total pollutants at the state level, this clearly linked to the fact that it is the municipality of the State with the greatest amount of population and vehicular park, which is the main emitter of carbon monoxide (CO). On the other hand, it is the second place in emitting total organic compounds (COT), derived from the processes of tanning and use of solvents, coatings and glues used by the tannery and footwear industry (Figure 1).
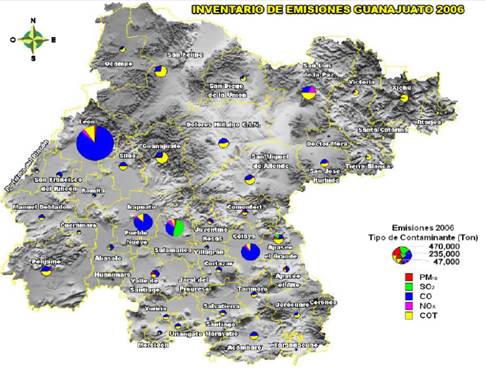
Figure 1 Inventory of emissions for the state of Guanajuato. Source: taken from the Guanajuato emissions inventory (2006).
Given the situation of a high concentration of carbon monoxide (CO) and a high emission of total organic compounds (COT), the authorities are already concerned about the possible damages they cause to the health of people and the environment in general, so the main objective of this research was to estimate the economic value for an improvement in air quality in León, Guanajuato by using the contingent valuation method (MVC).
At present, the contingent valuation method is the most used to make valuations of goods and services without a market. This method was consolidated through a favorable report from the commission of experts of the National Oceanic and Atmospheric Administration (NOAA), chaired byArrow and Solow (Arrow et al., 1993). In 1993 the panel of experts was in favor of the method as a reasonable tool to calculate the value of non-use or passive use in the loss of welfare due to environmental disasters (Riera, 1994).
The studies to estimate the behavior and the revealed preferences of the consumers before an improvement in goods as in the quality of the water, that use the method of contingent valuation have found that the income, the educative level, the perception in the quality of the water and The living conditions of the home are statistically significant in the results of the model (Azdulbaki et al., 2008). This method has also been used to know the willingness to pay users of recreational activities in the Colorado River water flows, where they applied one hundred surveys to visitors, mainly from San Luis Río Colorado, conducted an econometric analysis of a single limit to the referendum question of availability to pay (Sanjurjo et al., 2007).
With regard to research aimed at analyzing aspects related to air quality, Osnaya (2002) made an analysis of the PROAIRE program of the Metropolitan Zone of the Valley of Mexico (ZMVM), where control measures are established to reduce emissions of greenhouse gases and local air pollutants. It was estimated that for the period of 2003 -2010, it is possible to save almost 700 cases of chronic bronchitis and other diseases derived from air pollution, which is reflected with a monetary benefit in public health in the order of US $200 million by year. Karimzadegan et al. (2008) conducted a study in which they concluded that air pollution affects human health in the city of Tehran, Iran, using the contingent valuation method, estimated the costs in health damages by the increase per unit of the following agents pollutants: US $16 224 for each unit increase in PM10, US $28 816 for each unit increase in CO2, US $1 927 for each unit increase in NO2 and US $7 739 for each unit increase in SO2.
Burtraw et al. (2001) in a study to reduce the accumulation of greenhouse gases, through the reduction of fossil fuel use in the United States of America, indicate that among the main pollutants that harm human health are nitrogen oxides (NOx) and carbon dioxide (CO2). They establish that with a tax of $25 per metric ton on the emission of coal, it would reduce the expenses for illnesses by approximately $8.00 per person per year. The increase in urbanization goes hand in hand with the increase in the deterioration of air quality (Wang and Zhang, 2008) as in the case of the city of Jinan in China, where by the low quality of the air and using the valuation method contingent, residents show that 59.7% of respondents were able to express a positive willingness to pay, and that the average DAP was 100 Chinese Yuan, per person, per year.
Materials and methods
The methodology used to carry out this research consisted in the use of the contingent valuation method to estimate the economic value of the air resource with the purpose of proposing the creation of a green fund to help improve air quality in Leon, Guanajuato In order to carry out the collection of the information, a simple random sampling (MAS) was carried out, through which the sample size was estimated, a questionnaire was subsequently developed and applied to the target population in a personal way.
For the estimation of the parameters of the logistic regression model, the logistic regression was used in order to estimate the DAP by the population of León, Guanajuato.
The contingent valuation method (MVC), is located within the direct - hypothetical methods that seeks to know the valuation that people make of the changes in the level of welfare, produced by a qualitative or quantitative change in the supply of a good environmental what is achieved through the application of questionnaires, where direct questions are asked under the assumption of the existence of an own market for these types of goods. It is considered that the management of these markets is completely comparable with the individual responses that are made in real markets (Mitchell and Carson, 1993).
In their origins, the theorists of environmental economics and natural resources, such as Mitchell and Carson (1989) developed the MVC contingent valuation method to measure the demand for an environmental good. In conventional economics, demand describes a relationship between the price of the good and the quantity purchased.
Where: G is the amount of the good purchased; P the price of the good and S is a vector of economic variables that could affect the demand.
In the contingent valuation method, the researcher applies surveys to create a hypothetical market for the environmental good that is the subject of study. To do this, the good that will be valued is described, to later ask the interviewees how much they would be willing to pay and at the same time ask questions to obtain information about their socioeconomic characteristics. Once the information obtained from the surveys has been collected, the econometric analysis is done to subsequently construct the demand function of the environmental good from a regression that describes the price that the individual is willing to pay (DAP) for the consumption of the good and the characteristics socio-economic aspects of the interviewed individual.
The area under the demand curve is determined using the model described by Hanemann (1984). The model proposed by this author estimates the maximization of utility at the point at which the consumer is willing to accept a reduction in his income (I) by the amount of the price he would pay for the consumption of the environmental good in exchange for the utility that he receives compensates for his loss of income. This concept is shown in the following equation:
Where: U= the utility function of the consumer, which is a function of; y0= the prevailing environmental conditions; y1= improved environmental conditions from a policy or project; I= consumer income; P= the price of “offer” that the consumer would pay for the improvement of the environmental good; A= a vector of socioeconomic attributes that affect DAP.
However, it is not possible to observe all the components that influence the utility of the individual consumer. Therefore, it is assumed that utility is a random variable with an observable mean and a parametric distribution. Given this assumption, the random utility variable (V) is described as:
Where: v(%)= the value of the mean for U (•); ε= an unobservable component of the utility of the individual consumer, which is distributed independently and identically with zero mean.
The interviewed consumer will respond positively to the question about his DAP when the following condition is met:
The questionnaire used to gather the necessary information to try to estimate the DAP in the municipality of Leon, Guanajuato, contains socioeconomic variables such as: age of the respondent, sex, education, marital status, occupation, income, economic dependents. It also includes the perception of the environment describing the environmental scenario of the city of Leon, considering the contamination of water, air, soil erosion, loss of biodiversity, and deforestation. The respondent is asked to order from 1 to 3, where 1 is “urgent” and 3 “less urgent”, the environmental aspects that require greater attention in the municipality in the aspect of soil pollution and erosion, pollution and scarcity of the water and air pollution.
The respondent is asked if he knows of any public or private program aimed at improving the environmental situation in his region. He is consulted if he or someone in his family has become ill due to issues attributable to contamination, as well as the frequency. In the last section of the questionnaire they are asked about the willingness to pay (DAP), which is the elementary question of the contingent valuation.
According to Haab and McConnel (2002) there are several ways to obtain the willingness to pay. These authors propose four ways to obtain information and estimate preferences. Of those recommended by these authors, the cards of payment and the dichotomous or discreet choice are combined.
To determine the sampling units to which the questionnaires were applied, simple random sampling was used to carry out the survey, guaranteeing that all elements of the population have the same probability of being chosen (Cochran, 2000).
The level of confidence chosen was 95%, so the value of Z is 1.96; s2 is the estimated variance of the pilot sample with a value of 68.12 and d2 which is the limit of the sampling error or standard error, takes the value of 12. The size shown calculated for the municipality of Leon was 125 observations, which is the number of questionnaires applied.
Econometric model
The statistical base of the econometric model that was used for this investigation starts from the logistic distribution, since the dependent variable is a qualitative variable the value is estimated from a logit model. The logistic regression model starts from the hypothesis that the data follow the following model:
Logistic regression model
In order to simplify the expression, it is defined as z:
Therefore, the model can be represented as follows:
Clearing the quotient:
Where: p is the probability that it will occur to the study event. By operating algebraically on the equation, you get to:
As the logistic distribution function is:
Therefore, you can rewrite the model much more compactly in the following way:
Where it follows that the logistic regression model is a non-linear regression model, but is linear in logarithmic scale corresponding to the original definition:
That is, the difference in the probability of an event occurring with respect to not occurring is linear, but on a logarithmic scale. Therefore, the meaning of the coefficients, although keeping a certain relationship with the linear regression model, will be somewhat more complex to interpret (Rojo, 2007).
The logistic model for this case is the following:
The meaning and description of the variables is provided in Table 1.
Table 1 Specification of the variables included in the model.
| Variable | Denomination | Description | Explanation | Scale |
| Prob(Si) | P(si) | Probability of saying YES | Probability of answering YES to the question of availability to pay | Dichotomous 1= yes 0= not |
| Prepr | X1 | Predetermined price | Hypothetical price to be paid randomly assigned | Price assigned according to the design of the payment card |
| Age | X2 | Age of the interviewed | Years old | Continua |
| Sexo | X3 | Sex | ----- | Dichotomous 1= male 0= female |
| Esc | X4 | Scholarship | School grade | Ordinal From 1 to 6 according to the level of schooling |
| Eciv | X5 | Civil status | ----- | Dichotomous 1= Married 0= Single |
| Ing | X6 | Monthly income | Monthly income received by the family | Ordinal |
| More than $12 001= 5 | ||||
| $9 001-$12 000= 4 | ||||
| $6 001-9 000= 3 | ||||
| $3 001-6 000= 2 | ||||
| 0-$3 000=1 | ||||
| Tafa | X7 | Size of the family | People that make up the family | Continua |
| Prioamb | X8 | Environmental priority | Of the three natural resources (water, soil and air) which is the most urgent to attend | Ordinal 1= if people consider air is more urgent, 0 = if people do not consider the air as urgent but to another resource |
| Caliair | X9 | Perception of air quality | If contamination levels are very noticeable for the population | Dichotomic 1 = if the air quality is considered good 0 = air quality is not considered good |
| Cspro | X10 | Knowledge about a mitigation program to the problem of environmental pollution | If the population knows a public or private program to improve air quality | Dichotomous 1 = if they know any program, 0 = do not know any program |
| Enfe | X11 | Diseases | If any member of the family has become ill due to air pollution | 1 = if you have fallen ill 0 = you have not fallen ill |
Results and discussion
The results obtained from the survey in relation to the socioeconomic variables are the following: 61% of the respondents belong to the male sex, while the remaining 39% are female. Regarding the age of the interviewees, 28% are between 18 and 25 years old, while 14% are between 36 and 45 years old. With respect to schooling, 34% have high school studies. The predominant marital status in the surveyed population is married with 64.8%. Regarding the income variable, 55.2% of the population reported obtaining income between $3 001- $6 000 pesos. 56.8% of the interviewees consider that it is more important to treat the problem of water pollution than that of air (34.4%) Table 2.
Table 2 Value in percentage of the socioeconomic variables included in the model.
| Variable | Criterion | (%) |
| Sex | Male | 61 |
| Female | 39 | |
| Age | More than 56 | 8 |
| Between 46 and 55 | 12.8 | |
| Between 36 and 45 | 14.4 | |
| Entre 26 and 35 | 36 | |
| Between 18 and 25 | 28.8 | |
| Scholarship | I do not study | 8 |
| Primary | 12.8 | |
| High school | 32 | |
| preparatory school | 34.4 | |
| University | 12.8 | |
| Civil status | Married | 64.8 |
| Single | 35.2 | |
| Income | Less than $ 3 000 | 17.6 |
| Between $3 001 and $6 000 | 55.2 | |
| Between $6 001 and $9 000 | 15.2 | |
| Between $9 001 and $12 000 | 6.4 | |
| More than $12 001 | 5.6 | |
| Environmental priority | Soil | 8.8 |
| Water | 56.8 | |
| Air | 34.4 |
Source: elaboration with results of the surveys.
Of the negative responses to the DAP, 8 are mainly related to economic issues (47.06%) and 6 that represent 35.29% of the negative responses. The population considers that the government should be in charge of solving the environmental problem Table 3.
Table 3 Reason why you are not willing to pay.
| Reason | Results | (%) |
| For economical reasons | 8 | 47.06 |
| Do not trust the proper use of funds | 3 | 17.65 |
| The government should address these types of problems | 6 | 35.29 |
| He has no interest in the subject | 0 | 0 |
| Total | 17 | 100 |
Source: elaboration with results of the surveys.
Econometric results
To perform this procedure, the computational package of Statical Analysis System 9.0 (SAS) was used, applying PROC LOGISTIC procedures. The results were interpreted following Allison (1999) and Greene (2003). The convergence status message of the model indicates that the numerical solution converged. The econometric results are shown in Table 4.
Table 4 Results of the logistic regression.
| Parmeter | DF | Estimator | Standard error | Chi-squared | Pr>Chi squared |
| Intercept | 1 | 5.9403 | 2.806 | 4.4817 | 0.0343 |
| Prepr | 1 | -0.0177 | 0.0727 | 0.0594 | 0.8075 |
| Edad | 1 | 0.00058 | 0.0244 | 0.0006 | 0.981 |
| Sexo | 1 | -0.7059 | 0.6965 | 1.0272 | 0.3108 |
| Esc | 1 | 0.3995 | 0.3127 | 1.632 | 0.2014 |
| Eciv | 1 | -0.9226 | 0.7774 | 1.4086 | 0.2353 |
| Ing | 1 | -0.8169 | 0.2777 | 8.6556 | 0.0033 |
| Tafa | 1 | 0.00577 | 0.2481 | 0.0005 | 0.9815 |
| Prioamb | 1 | 0.5808 | 0.6541 | 0.7885 | 0.3745 |
| Caliair | 1 | -1.7988 | 1.2535 | 2.0592 | 0.1513 |
| Cspro | 1 | -2.0634 | 0.9964 | 4.2885 | 0.0384 |
| Enfe | 1 | -0.1094 | 0.7665 | 0.0204 | 0.8865 |
Source: elaboration with SAS output.
At the individual level it is observed that none of the variables is significant at the usual levels of statistical significance of 90%, 95% or 99%. However, they are kept at the respective level of trust because of their importance from the economic point of view.
In the case of discrete binary choice models, it is common to use the concept analogous to the coefficient of determination R2 that explains the overall fit of the model, for which the statistic called pseudo R2 of McFaden is used. According to Greene (2003) this statistic can be calculated by the following expression:
Where: LnL is the likelihood function with the restriction that all parameters are equal to zero and LnL0 the same function for an unrestricted model, which is calculated as follows:
Where: P is the proportion of affirmative responses to the DAP (p= 0.864) and n is the sample size (n= 125), substituting values is:
The value of LnL is obtained from the SAS output of -2LnL= 82.509. When clearing LnL, we have a value of LnL= -41.2545. Substituting the values of LnL0 and LnL in the McFaden pseudo-R2 formula, the following value is obtained:
The value of R2 is low (0.17), which means that 17% of the DAP is explained by the variables included in the model, but this level of adjustment is common in valuation work, for example, Tyrväinen and Väänäen (1998) obtained a value of R2= 0.15.
To estimate the DAPmedia, the following expression was used:
Where α is the sum of the coefficients of the variables multiplied by their mean including the independent term and β is the value of the coefficient PREPR with negative sign. Therefore, an average DAP of $131.15 pesos is estimated, with a probability level of 91.06% of a positive response from the DAP. The probability was obtained by replacing the values of coefficients and the average values of the variables in the following expression:
Where z=β
Conclusions
The population of León, Guanajuato positively values the improvement of environmental quality. In the study, an average DAP of $131.15 pesos per inhabitant was estimated for the reduction of pollution in the municipality of León, Guanajuato, for a single annual payment. This allows to obtain annual income of $60 408 083.45 pesos; that is, $4 174 712.06 dollars in the year of 2014, for the formation of the green fund to mitigate pollution, taking as a reference a vehicle fleet of 460 603 units for the same year. The population of León, Guanajuato, believes that it is more important to address the problem of water pollution than air pollution, so the public body in charge of the environmental issue should review the water quality conditions of the municipality.
Literatura citada
Allison, D. P. 1999. Logistic regression using the SAS system: theory and applications. SAS Institute. Cary, NC, USA. [ Links ]
Arrow, K.; Solow, R.; Portney, P. R.; Leamer, E. E.; Radner, R. and Schuman, H. 1993. Report of the NOAA panel on contingent valuation. January 11. [ Links ]
Azdulbaki, B.; Gunes, E. and Florkowski, W. J. 2008. Willingness to pay for potable water in the Southeastern Turkey: an application of both state and revealed preferences valuation method. Ag economics search research in agricultural and apliedmeeting. February 2-6, Dallas, Texas, USA. [ Links ]
Burtraw, D.; Krupnick, A.; Palmer, K.; Paul, A.; Toman, M. and Bloyd, C. 2001. Ancillary benefits of reduced air pollution in the United States from moderate greenhouse gas mitigation policies in the electricity sector. Resources for the Future. [ Links ]
Cochran, W. G. 2000. Técnicas de muestreo. Editorial continental. 15va . Edición. [ Links ]
Gómez, A. J. R. 1977. Introducción al muestreo. Tesis de Maestría, Colegio de Postgraduados. Chapingo, Estado de México. [ Links ]
Greene, W. H. 2003. Econometric analysis. Prentice Hall. New York, NY. USA. [ Links ]
Habb, T. C. and McConnell, K. E. 2002. Valuing environmental and natural resources. The econometrics of non-market valuation. Edward Elgard Publishing. Cheltenham, UK, England. [ Links ]
Hanneman, W. M. 1984. Welfare evaluations in contingent valuation experiments with discrete responses. Am. J. Agric. Econ. 66:332-341. [ Links ]
INEGI. 2010. Censo de Población y Vivienda. Resultados preliminares. [ Links ]
Inventario de Emisiones Guanajuato (IEG) (2006). Instituto de ecología del estado. Salamanca, Gto., México. Primera edición. http://www.guanajuato.gob.mx/iee. [ Links ]
Karimzadegan, H.; Rahmatian, M.; Farhud, D. and Yunesian, M. 2008. economic valuation of air pollution health impacts in the Tehran Area, Iran. Iranian J. PublHealth. 37 p. [ Links ]
Martínez, D. M. A. y Martínez, G. M. A. 2006. Métodos econométricos intermedios. Universidad Autónoma Chapingo. México. [ Links ]
Mitchell, R. and Carson, R. 1989. Using surveys to value public goods. The contingent valuation method. Resources for the future, Washington, D. C. [ Links ]
Osnaya, R. P. 2002. Co-beneficios de los controles sobre la contaminación del aire local y global de la Ciudad de México. Instituto Nacional de Ecología, SEMARNAT. [ Links ]
Riera, P. 1994. Manual de valoración contingente. Instituto de Estudios Fiscales. Barcelona, España. [ Links ]
Rojo, A. J. M. 2007. Regression con variable dependiente cualitativa. Instituto de Economía y Geografía. Madrid, España. [ Links ]
Sanjurjo, R. E. e Islas, C. I. 2007. Valoración económica de la actividad recreativa en el río Colorado, Región y Sociedad. El Colegio de Sonora Hermosillo, México. 9:147-172. [ Links ]
Scheaffer, L.; Mendenhall, R. W. y Ott, L. 2006. Elementos de muestreo. Editorial Paraninfo. [ Links ]
Tyrväinen, L. and Väänäen, H. 1988. The economic value of urban forest amenities: an application of the contingent valuation method. Landscspe and urban planning. [ Links ]
Unidad de Acceso a la Información Pública (UAIP). Guanajuato. Unidad de Acceso a la Información Pública (UAIP). http//:20188_respuesta_20188:https://transparencia.guanajuato.gob.mx/dedalo/.../bajaarchivo.php?... 20/02/2015. [ Links ]
Vásquez, F.; Cerda, A. y Orregon, S. 2007. Valoración económica del ambiente: fundamentos económicos, econométricos y aplicaciones. 1ª (Ed.). Buenos Aires. Thomson Learning. [ Links ]
Wang, Y. and Zhang, Y. S. 2008. Air quality assessment by contingent valuation in Ji’nan, China. Journal of Environmental Management. http://home.wlu.edu/~caseyj/wang_2008_journal-of-environmental-management.pdf. [ Links ]
Received: January 00, 2018; Accepted: February 00, 2018
 Este es un artículo publicado en acceso abierto bajo una licencia Creative Commons
