


Servicios Personalizados
Revista
Articulo
 texto en
  Inglés (pdf)
 Artículo en XML
 Referencias del artículo
 Enviar artículo por email
Indicadores
-
 Citado por SciELO
 -
 Accesos
Links relacionados
-
 Similares en
SciELO
Similares en
SciELO
Compartir

 Permalink
Revista mexicana de ciencias agrícolas
versión impresa ISSN 2007-0934
Rev. Mex. Cienc. Agríc vol.8 spe 19 Texcoco nov./dic. 2017
https://doi.org/10.29312/remexca.v0i19.655
Articles
Mango growth regulators: their relationship with carbohydrates number and size of cells
1Instituto Nacional de Investigaciones Forestales, Agrícolas y Pecuarias. Carretera Internacional México-Nogales km 6, Santiago Ixcuintla, Nayarit, México. CP. 63300. Tel. 55 38718700, ext. 84416.
2Colegio de Postgraduados-RGP-Fruticultura. Carretera México-Texcoco km 36.5, Montecillo, Estado de México, México. CP. 56230. Tel. 595 9520200. (racm@colpos.mx; alexge@colpos.mx).
3Universidad Autónoma de Chapingo-Departamento de Fitotecnia. Carretera Fed. México-Texcoco km 38.5, Chapingo, Estado de México, México. CP. 56230.
4Centro de Investigación en Alimentación y Desarrollo. Carretera El Dorado km 5.5, Col. Campo El Diez, Culiacán, Sinaloa, México. CP. 80129. (tosuna@ciad.edu.mx).
Growth regulators increase fruit size by modifying the distribution pattern of photosynthates, or by increasing the number and size of cells. The objective was to determine the effect of growth regulators on the accumulation of sugars and on the number and size of cells in ‘Ataulfo’ mango. The treatments were: T1 application of 50 mg L-1 of TDZ at 0 days after full bloom (DDF) combined with three applications ofAG3 (50 mg L-1) at 15 + 30 + 45 DDF. The T2 corresponded to the application of TDZ + AG3 (50 mg L -1 of c/u) at 15 + 30 + 45 + 60 DDF. The T3 Witness. The experimental design was completely randomized, three treatments with four replications and one tree as a useful plot were evaluated. The variables evaluated were fruit length and diameter, carbohydrate content, number and size of cells. It was possible to increase fruit size up to 20% with T1 and 23% with T2, with respect to the control. The sugar content was similar in fruits with or without growth regulator. At 45 DDF, the number of cells ranged from 3 526 to 4 603 mm2, T1 had the highest number but was statistically equal to that found in T2. At T2 the cell size increased 30%, in relation to the control and 23% with respect to the fruits of T1. The increase in parthenocarpic fruit size was associated with greater cell division and elongation. The pollinated fruits had larger cells than the parthenocarpic ones.
Keywords: Mangifera indica L.; cell size; cytokinins; fruit growth; gibberellins; sugars
Los reguladores de crecimiento incrementan el tamaño de fruto al modificar el patrón de distribución de fotosintatos, o al incrementar el número y tamaño de células. El objetivo fue determinar el efecto de reguladores de crecimiento en la acumulación de azúcares y en el número y tamaño de células en mango ‘Ataulfo’. Los tratamientos fueron: T1 aplicación de 50 mg L-1 de TDZ a 0 días después de plena floración (DDF) combinado con tres aplicaciones de AG3 (50 mg L-1) a 15+30+45 DDF. T2 correspondió a la aplicación de TDZ+AG3 (50 mg L-1 de c/u) a los 15+30+45+ 60 DDF. T3 Testigo. El diseño experimental fue completamente al azar, se evaluaron tres tratamientos con cuatro repeticiones y un árbol como parcela útil. Las variables evaluadas fueron: longitud y diámetro de frutos, contenido de carbohidratos, número y tamaño de células. Se logró incrementar el tamaño de fruto hasta 20% con T1 y de 23% con T2, respecto al testigo. El contenido de azúcares fue similar en los frutos con o sin regulador de crecimiento. A los 45 DDF, el número de células varió de 3 526 a 4 603 mm2, T1 presentó el mayor número aunque fue estadísticamente igual al encontrado en T2. En T2 el tamaño de las células se incrementó 30%, con relación al testigo y 23% respecto a los frutos de T1. El incremento logrado en el tamaño de frutos partenocárpicos estuvo asociado a una mayor división y elongación celular. Los frutos polinizados tuvieron células más grandes que los partenocárpicos.
Palabras claves: Mangifera indica L.; azúcares; citocininas; crecimiento de fruto; giberelinas; tamaño de células
Introduction
There is evidence that growth regulators increase parthenocarpic fruit size in mango (Ogata et al., 2010; Pérez et al., 2015). A number of studies agree that the increase occurs by modifying the distribution pattern of photosyntates, specifically by an increase in the concentration of sugars, in fruit trees such as vines (Pérez and Gómez, 2000), to ‘Kousui’ (Zhang et al., 2007) and citrus (Agusti et al., 2002; Khalid et al., 2012). However, in cranberry cv. Beckyblue rabbiteye, the application of gibberellins (GAs) did not modify the distribution pattern, indicating that the size of fruits both pollinated and treated with AG3 did not depend on the capacity to accumulate sugars (Cano and Darnell, 1997a).
In fruit trees, the source-demand relationship is related to fruit growth and crop productivity (Goldschmidt, 1999). This relationship also influences the levels of sugars such as glucose, fructose and sucrose that are synthesized in leaves and move through the phloem to non-photosynthetic or plant-demanding organs, including fruit. It has long been known that sucrose is the main sugar transported and that its transport by phloem depends on the concentration gradient between loading and unloading sites (Avigad, 1982). Sucrose once discharged from the phloem at the sites of demand, can enter the cells of the fruit by two routes, via symplastic through plasmodesmata, or via cell wall apoplast.
In mango there are few studies on carbohydrate content in developing fruits. In the Irwin cultivar during fruit development (90-110 days after flowering, the last date corresponded to physiological maturity) the fructose content increased from 12.8 mg g-1 fresh weight to 20.6 mg, after harvest increased to approximately 30 mg and remained stable until maturity of consumption. The glucose content was stable between 10 mg g-1 and decreased after harvest. The sucrose content was lower than glucose and fructose during development; however, after harvest until maturity of consumption showed a strong increase from 5.9 to 82 mg g-1.
The starch content was high during development (≈50mgg-1) and decreased after harvest until practically disappeared (Wei et al., 2013). In ‘Keitt’ mango, Bernardes et al. (2008) observed accumulation of starch during fruit development and mentioned that it is the most likely source of carbon for the synthesis of soluble sugars. Apparently, glucose and fructose can be used both to synthesize starch and to breathe. During fruit growth, there is a low amount of sucrose due to the hydrolysis of this disaccharide imported from the leaves, to provide the carbon demand during development (Bernardes et al., 2008).
Most studies on carbohydrate content in mango, are mainly focused on postharvest. During this stage, starch degradation is highly correlated with sucrose accumulation, concluding that it is the main mango sugar (Castrillo et al., 1992; Bernardes et al., 2003; Bernardes et al., 2008; Wei et al., 2013).
On the other hand, in many fruit trees the production of cells before flowering and immediately after pollination/ fertilization is the first factor that drives the early growth of the fruit. While cell expansion or elongation is an important facilitator of organ growth, increased fruit growth especially during the late stage of development is often achieved (Johnson et al., 2011).
Fruit size is associated with differences in cell number and size, large fruits are related to a high number of cells in many fruits such as peach (Scorza et al., 1991), strawberry (Cheng and Breen, 1992), olive (Rapoport et al., 2004), cherry (Olmstead et al., 2007), and tomato (Bohner and Bangerth, 1988; Bertin et al., 2003; Tanksley, 2004; Bertin et al., 2009). In the present study, the results obtained in the present study are shown in Fig. It was shown that growth regulators induce mooring and development of parthenocarpic fruits, affecting cell division and elongation.
In cranberry cv. Beckyblue differences in the final size of pollinated fruits and parthenocarpic fruits treated with AG3 were due to cell length rather than to cell numbers (Cano and Darnell, 1997b). In Sultana grape the application of AG3 (45 mg L-1) eight days after flowering increased the size of seedless fruits by increasing cell division and lengthening (Pérez and Gómez, 2000). While in ‘Kousui’ pear an increase in fruit size was in response to the exogenous application of AG3+4 and was associated with an increase in the size of mesocarp cells (Zhang et al., 2006).
In mango fruits, there are currently no papers on this subject and even less on ‘Ataulfo’ parthenocarpic fruits. Therefore, the objective of the present study was to determine the effect of growth regulators on the accumulation of sugars and on the number and size of cells in ‘Ataulfo’ mango fruits.
Materials and methods
The study was conducted in 2014 at Atonalisco, municipality of Tepic, Nayarit (21° 18’ north latitude and 104° 53’ west longitude, 450 meters above sea level). A commercial orchard of ‘Ataulfo’/regional creole mango was selected, with 80% incidence of parthenocarpic fruits (PRT). Trees were 8 years old set at 5 × 5 m between row and tree, respectively. The orchard was managed with gravity irrigation (one each month from February to April), pruning (about 50 cm pruning and elimination of central branches) and fertilization with 2 kg of Triple 17 per tree at the beginning of the rainy season (June) and 2 kg of organic fertilizer (manure) per tree applied in september
Three treatments were evaluated. In treatment 1, 50 mg L-1 of TDZ was applied at 0 days after full bloom (DDF) combined with three applications of AG3 at 15 + 30 + 45 DDF. Treatment 2 corresponded to the application of TDZ + AG3 (50 mg L -1 of c/u) at 15 + 30 + 45 + 60 DDF. A control was used. Previous studies indicated that these doses increased fruit size (Pérez et al., 2015). The sprays were made at the point of drip between 8:00 am; 10:00 am by means of motorized spray pumps. The commercial Revent® product was used as TDZ source and Progibb® was used for AG3. The 1 mL L-1 of surfactant water (Inex®) and 1% leaf urea was used as a penetrating agent. The control was sprinkled with water + surfactant and urea, the pH of the solutions was adjusted to 5.8 with hydrochloric acid (HCl).
The variables evaluated were: length and diameter of fruits sampled, carbohydrate content and cell number and size.
Length and diameter of fruit. The fruit length and diameter were recorded every 15 days, starting from stage I of slow growth of the fruit (15 DDF) until stage III corresponding to an accelerated growth of the same (105 DDF, physiological maturity). For this, four inflorescences per tree were selected and up to four parthenocarpic fruits were marked for each inflorescence, only one of them was measured. It was evaluated using a digital vernier (Control Company).
Determination of carbohydrates. At each treatment, fruit samples were collected at 15, 30, 45, 60, 90 and 105 days after full bloom (DDF), the last sampling was performed at harvest (physiological maturity). In the first sampling, 10 fruit of each repetition (approximately 5 g) were taken, in the subsequent samplings two parthenocarpic fruits were taken and two pollinated by repetition and in the final sampling, one fruit of each one by repetition. These were transported in icebox to the laboratory. From each fruit a sample of approximately 5 g of pulp was taken from the middle part of the fruit, samples of both parthenocarpic and pollinated fruits were separately homogenized and four replicates were formed for each treatment and stored at -20 °C their analysis.
Following the methodology used by Cano and Darnell (1997a), with slight modifications, of each type of fruit and repetition was taken 1 g of fresh weights (pf) of pulp, separately and was ground with liquid nitrogen. For the extraction, 80% ethanol (10 mL) was used at boiling for 2 min. 100 mg of mannitol was added as an internal standard. The extract was centrifuged at 3000 rpm and the supernatant was decanted and the residue was re-extracted twice more. Chloroform (3 mL) was added to the supernatant, centrifuged at 2 000 rpm for 3 min at 4 oC. The aqueous phase was rescued and dried under vacuum, resuspended with water and passed through ion exchange resins (Dowex-1 and Dowex -50). The final supernatant was vacuum dried, resuspended with HPLC grade water and filtered through a 0.45 µm mesh filter.
The content of glucose, sucrose and fructose was determined by HPLC (High Performance Liquid Chromatography). The sample was injected into a Bio-Rad HPLC (Cambridge, MA), using a Bio-Rad Aminex® HPX-87C cation exchange column with the following measurement conditions: flow 0.6 mL min-1, column temperature 80 °C, detection cell temperature 45 °C and mobile phase, HPLC grade water. A volume of 20 µm was injected.
Size and number of cells. In the same treatments, parthenocarpic fruits were sampled at 15, 30 and 45 days after full bloom (DDF) . At each sampling stage, three fruits per replicate were taken for a total of 12 fruits per treatment. Only in the 45 DDF stage were 12 parthenocarpic fruits and 12 pollinated by treatment. In the first sampling the fruits were immediately placed in FAA (10% (v/v) formaldehyde, 5% glacial acetic acid, 50% 100% ethanol and 35% distilled water). In the following samples a portion of epicarp + mesocarp was taken from the middle part of the fruit and fixed in FAA in the same manner as in the first sampling. The samples were dehydrated in a gradual series of alcohol and xylol to finish with 100% xylol. They were then fixed in paraffin at 60 °C. Anatomical sections (8 µm) were made using a rotating microtome (American Optical, USA), the cuts were stained with safranin and fixed green.
The number and size was determined using microscopy (Stereomaster digital zoom high-resolution microscope; Fisher Scientific, Pittsburgh, PA) and image projection taken from the cross section of the fruit (40X). For the number of cells, an area of 15 mm2 was delimited in each of the cuts, using the sowtware ImageTool ver 3 and counting the number of cells projecting the image. The cross-sectional area of the fruit was calculated by measuring the diameter of the fruit and using the equation for the area of an ellipse. The formula used by Cano and Darnell (1997b) was used to calculate the number of cells in the cross-sectional area of the fruit.
To determine the size, the delimited area (15 mm2 ) was considered and 20 mesocarp cells (near exocarp) were measured in each section, using ImageTool 3.0 software. The cross-sectional area was determined by measuring the diameter of the cell in two directions and using the equation for the area of an ellipse (Area= πab, where a and b are the major and minor half-axes of the ellipse.
A completely randomized experimental design was used, three treatments were evaluated with four replicates and one tree as a useful plot.
Analysis of variance by sampling date and multiple comparisons of means were performed according to the Tukey test at a p≤ 0.05. The SAS program version 9.2 was used (SAS, 2008).
Results
Size of fruit
In all treatments, fruit size (length and diameter) in stage I was less than 1 cm. In stage II of fast growth (45 DDF), the fruit length of T1 was 5.1 cm and in fruits of T2 the length was 5.3 cm, being statistically equal to the previous treatment (Figure 1a). The control fruits had a length of 4.1 cm. In the final stage of growth (stage III), the length was 6.8 and 7.2 cm in treatments T1 and T2, respectively; in control fruitsnwas 5.1 cm. At 105 DDF, the diameter varied from 3.4 in the control), to 4.9 in T2 (Figure 1b), the control presented the smallest fruits.
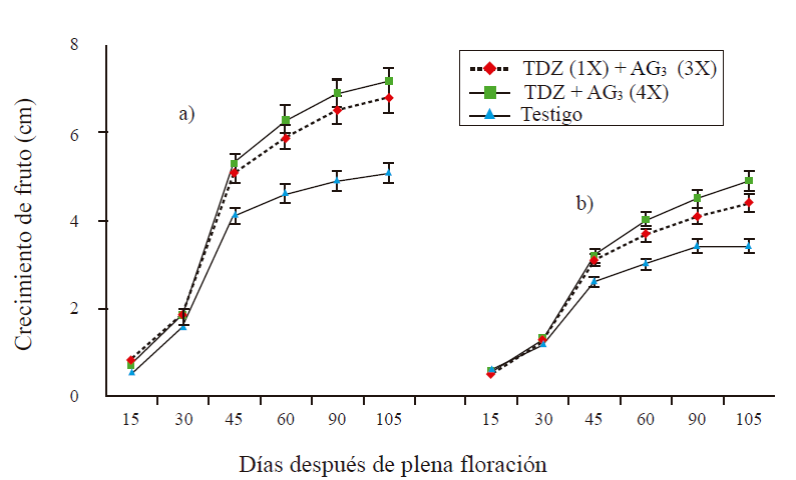
Figure 1 Length (a) and diameter (b) of parthenocarpic fruits with antd without application of growth regulator. 1X= an application at 0 DDF; 3X= three applications at 15 + 30 + 45 DDF; 4X= four applications at 15 + 30 +45 + 60. The bars at each point represent the average of 16 fruits per treatment ± standard error.
Accumulation of sugars
In parthenocarpic fruit there were no significant differences between sucrose and glucose treatments in the early stages of development (15, 30 and 45 DDF), except for fructose. In fruits with an application of TDZ (50 mg L-1) DDF + three applications of AG3 at 15 + 30 + 45 DDF (T1), the fructose content was 1.03 mg g-1 fresh weight (pf) at 15 days DDF, decreased at 30 and 45 days, remained slightly higher at 60 and decreased at 105 DDF (Figure 2A). In fruits with application of TDZ + AG3 (50 mg L-1 of c/u) at 15 + 30 + 45 + 60 DDF (T2), the content at 15 DDF was 0.5 mg g-1 of pf, a the 30 DDF was 0.73 mg g-1 pf and remained stable at 60 and 105 DDF. In control fruits, the content remained at ≈0.8 mg g-1 of pf during fruit development with the exception of 45 DDF which had a content of 0.6 mg g-1 of pf (Figure 2a).
The glucose content remained stable between 0.2 and 0.3 mg g-1 of pf during the early developmental stage and decreased at 60 and 105 DDF, the behavior was equal between treatments (Figure 2b). In all treatments, sucrose maintained stable levels in its contents during 15, 30 and 45 DDF (< a 0.1 mg g-1 of pf), to increase from 60 DDF until reaching its maximum content at 105 DDF (Pr= 0.004 to 60 DDF and Pr≤ 0.0001 at 105 days). In the last stage the content varied from 1.6, 1.9 and 2 mg g-1 of pf, for T1, T2 and T3, respectively, T2 and T3 were statistically equal with a high sucrose content, compared to T1 (Figure 2c).
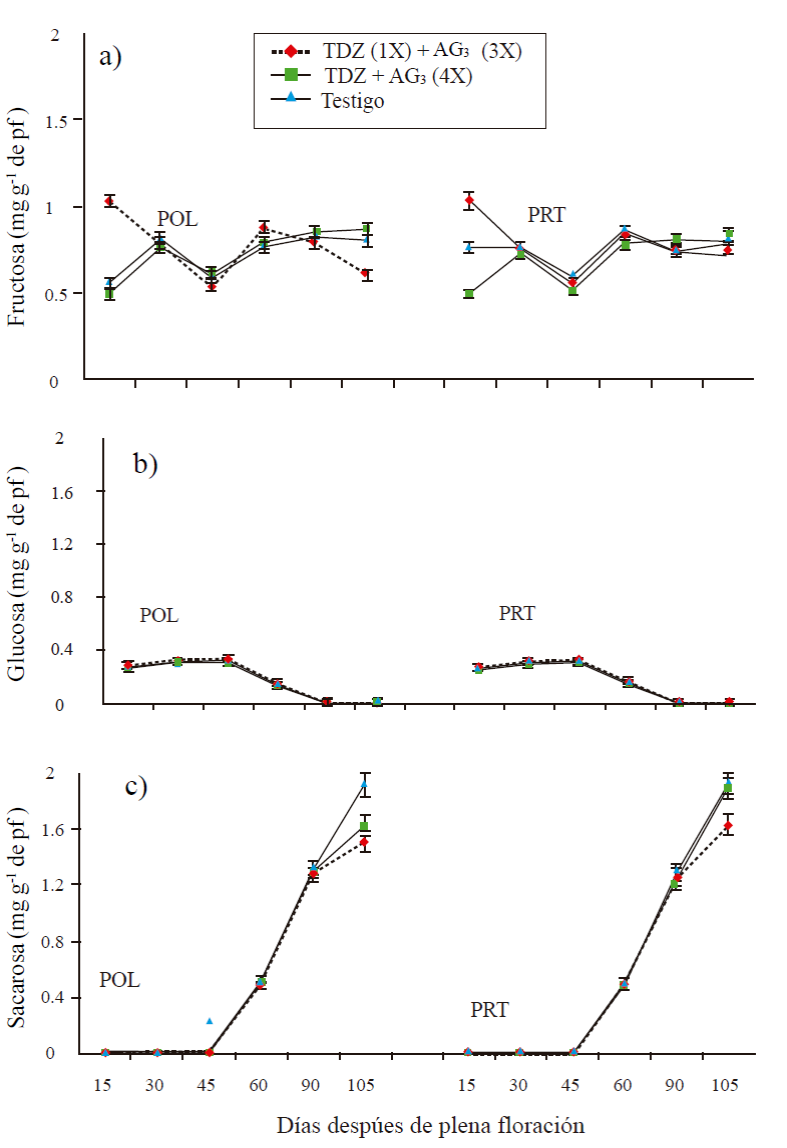
Figure 2 Content of fructose (A), glucose (B) and sucrose (C) in parthenocarpic fruits (PRT) and pollinated (POL) mango ‘Ataulfo’. 1X= an application at 0 DDF; 3X= three applications at 15 + 30 + 45 DDF; 4X= four applications at 15 + 30 + 45 + 60 DDF. The bars at each point represent the average of four replicates per treatment ± standard error.
In pollinated fruits, the results were very similar to those found in parthenocarpic fruits (Figure 2a, 2b, and 2c). There were no significant differences between treatments, nor between sampling times. The glucose content ranged from 0.3 mg g-1 of pf in the early stages to decrease to 60 and 105 DDF. Fructose presented differences between treatments in the sampled stages. Sucrose was maintained at levels below 0.1 mg g-1 of pf at 15, 30 and 45 DDF, subsequently increased from 60 DDF of about 0.5 mg g-1 to pf 1.5 to 1.6 and 2 mg g -1 to 105 DDF in treatments T1, T2 and T3, respectively, showing significant differences between treatments (Pr≤ 0.004) in this last stage.
Number and size of cells
Fifteen days after flowering, fruits treated with a TDZ application (50 mg L-1) at zero DDF + three applications of AG3 at 15 + 30 + 45 DDF (T1) had 772 cells in an area of 15 mm2 , the rest of the treatments had ≈549 and 474 cells (Figure 3). At 30 DDF the number varied from 2 878 to 262 cells mm-2, the largest number corresponded to T1 but statistically it was not different from T2 or control. At 45 DDF, the number of cells ranged from 3 526 to 4 mm2, T1 had the highest number but was statistically equal to that found at T2, but T3 showed lower numbers of cells. From 15 to 45 days T1 was numerically superior but statistically only at 45 DDF was different from the control.
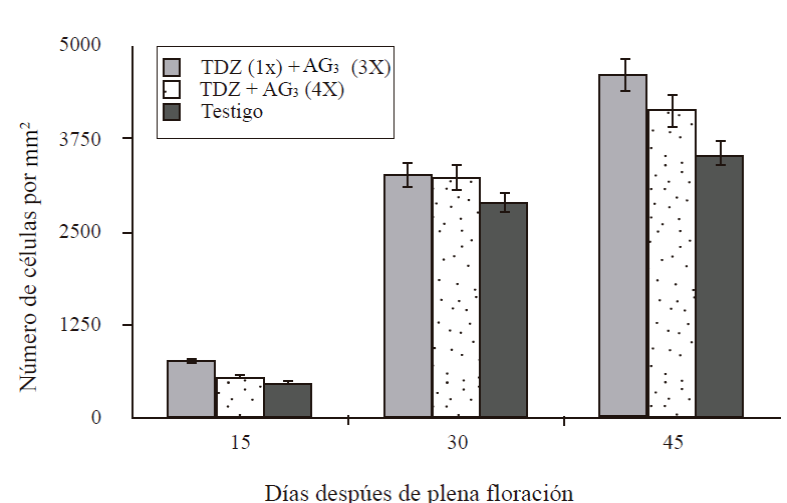
Figure 3 Number of cells of the cross section of the mesocarp of parthenocarpic fruits in ‘Ataulfo’ mango development. 1X= an application at 0 DDF; 3X= three applications at 15 + 30 + 45 DDF; 4X= four applications at 15 + 30 + 45 + 60 DDF. Column bars represent the average of 12 sections per treatment ± standard error.
A variation in the size of the cell was observed, increasing as the fruit developed. At 15 DDF, the cell size was between 10 thousand µm2 in fruits treated with a TDZ application at zero DDF + three applications of AG3 at 15 + 30 + 45 DDF (T1), and 15 thousand μm2 in those treated with four TDZ AG3 applications at 15 + 30 + 45 + 60 DDF (T2) and in control (Figure 4). At 30 DDF, the largest size corresponded to T2 (25 thousand µm2), T1 and T3 had a size of 15 and 18 thousand μm2, respectively. The size increased vigorously at 45 DDF of 76, 84 in T3 up to 108 thousand µm2 in fruits of T2, T2 presented the largest cells followed by T1; however, this latter treatment was not significantly different from the control. At the same time, the size of cells in pollinated fruits varied between 134 and 147 thousand µm2 (Figure 5). Parthenocarpic fruits with four applications of TDZ + AG3 at 15 + 30 + 45 + 60 DDF, had cells of 108 thousand µm2 and the pollinated ones with the same application of regulator had cells of 147 thousand µm2.
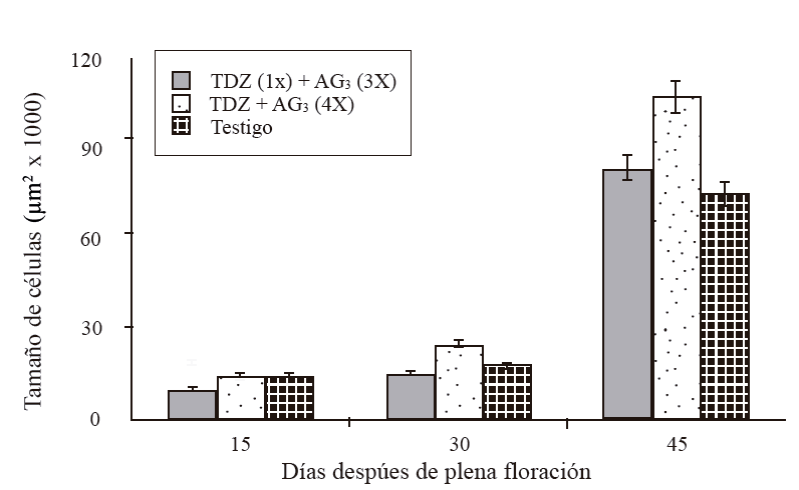
Figure 4 Cell size of the cross section of the mesocarp of parthenocarpic fruits in ‘Ataulfo’ mango development. 1X= an application at 0 DDF; 3X= three applications at 15 + 30 + 45 DDF; 4X= four applications at 15 + 30 + 45 + 60 DDF. Column bars represent the average of 20 cells per treatment ± standard error.
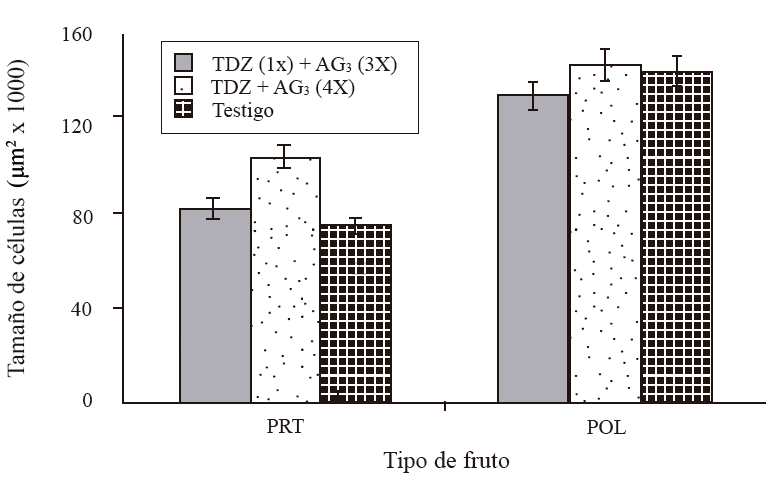
Figure 5 Cell size of the cross section of the mesocarp of parthenocarpic and pollinated fruits of ‘Ataulfo’ mango, 45 days DDF. 1X= an application at 0 DDF; 3X= three applications at 15 + 30 + 45 DDF; 4X= four applications at 15 + 30 + 45 + 60 DDF. Column bars represent the average of 12 sections per treatment ± standard error.
Discussion
Growth regulators increased the size of parthenocarpic fruits in both length and diameter. A 20% increase was achieved with T1 and 23% with T2, with respect to fruit length without regulator (T3). According to several authors, the increase in size is due to the fact that the regulators increase the demand force by modifying the distribution pattern of photosynthesis (Pérez and Gómez, 2000; Agusti et al., 2002; Zhang et al., 2007; Khalid et al., 2012).
The results of this study do not coincide with the previous reports, since the sugar content was similar to the fruits without growth regulator, so in ‘Ataulfo’ mango the size achieved in parthenocarpic fruits was not a function of the accumulation of sugars; which coincides with the results found by Cano and Darnell (1977a) where the size of cranberry fruits both pollinated and treated with AG3 did not depend on the capacity to accumulate sugars. This indicates that the response of the photosynthesis distribution depends on the type of fruit and the species.
In pollinated and parthenocarpic fruits, glucose showed low content during the early stages of development and decreased in the stage of rapid fruit growth, while fructose remained slightly unstable during all growth, showing levels slightly higher than glucose. The results agree with those obtained in mango ‘Irwin’ by Wei et al. (2013) and ‘Keitt’ by Bernardez et al. (2008) mentioning that in the early stages of development, glucose and fructose can be used both to synthesize starch and to breathe.
Sucrose content in both types of fruit was practically insignificant in the early stages of development (15-45 DDF, division and cell elongation) and increased from 60 DDF achieving an increase of almost 100% in physiological maturity. Different studies show that during the early stages of development, sucrose is transported from leaves to developing fruits, it is hydrolyzed by enzymes such as sucrose synthase upon entry into the cell via simplasto and acidic or cell wall invertase upon entry via apoplast, to provide the carbon demanded during development (Koch, 2004; Bernardes et al., 2008). In this regard, Wei et al. (2013) report high acid invertase activity in developing fruits (stage I) of ‘Irwin’ mango.
On the other hand, regardless of the type of fruit and the application of regulators, sucrose was the sugar of greater presence in fruits with physiological maturity. This indicates that it was the main sugar from physiological maturity to maturation (postharvest) and is responsible for the sweetness of the fruit. The results found coincide with those obtained by Castrillo et al. (1992); Bernardes et al. (2008) and Wei et al. (2013), in mango ‘Haden’, ‘Keitt’ and ‘Irwin’, respectively. According to these authors, in the stage of maturation the degradation of starch in fruit is highly correlated with the accumulation of sucrose. In addition, several authors agree that sucrose synthesis is due to the activity of sucrose phosphate synthase (Hubbard et al., 1991; Castrillo et al., 1992; Wei et al., 2013).
On the other hand, the number of cells was increased in parthenocarpic fruits independently of the application of regulators in stage I and II of the development of the fruit, with a tendency towards an increase according to the development of the same. In stage I of fruit development (15 DDF), a 30% increase in T1 (one application of TDZ in flowering and three applications of AG3 to 15 + 30 + 45 DDF) was achieved in relation to the control. This suggests the action of TDZ (cytokinin) on cell division during that stage. At the beginning of stage II (30 DDF) the increase was 12% with respect to the control with the same treatment, but at the end of that stage (45 DDF) the difference between this and the control was approximately 24%.
The results indicated that the application of cytokinins (TDZ) was key at the time of flowering to induce greater cell division and therefore a larger number of cells, which is probably associated with the size achieved in parthenocarpic fruits. The results agree with that reported in several fruit trees, where there is evidence that growth regulators induce mooring and development of parthenocarpic fruits, affecting cell division and elongation (Pérez and Gómez, 2000; Zhang et al., 2006).
In general, the cell division period of the mesocarp was 15 to 30 DDF (Figure 6), but in the control fruit mesocarp smaller division was observed at 30 DDF (Figure 6F). In Figure 6A, a larger number of cells can be observed at 15DDF caused by the action of TDZ, relative to control Figure 6C at the same stage.
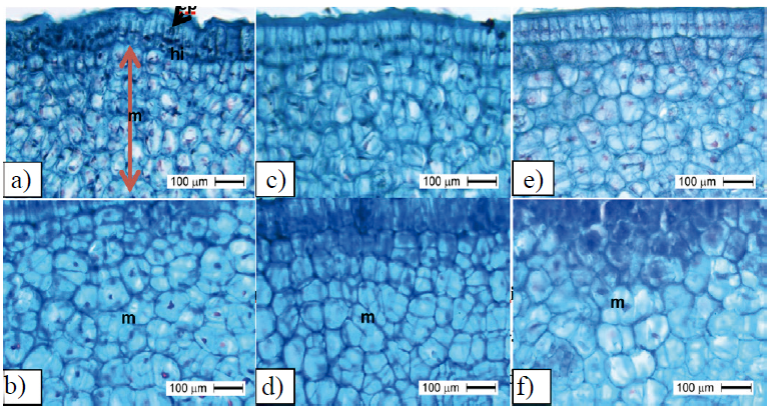
Figure 6 Number of cells in mesocarp of ‘Ataulfo’ mango fruit. with TDZ application at 0 DDF + three applications of AG3 at 15 + 30 + 45 DDF at stage I of fast fruit growth and start of step II (b); number of cells in fruits treated with four applications of TDZ + AG3 at 15 + 30 + 45 + 60 DDF in stage I of fast fruit growth (c) and start of Stage II (d); umber of cells in fruits without growth regulator in stage I of fast growing fruit (e) and beginning of Stage II (f); ep= epicarp; hi= hypocarp; m= mesocarp.
Regarding cell size, during stage I, T2 fruits (four applications of TDZ + AG3 at 15 + 30 + 45 + 60 DDF) had numerically larger but significantly equal cells to the control. In the same treatment, from the beginning of stage II (30 DDF) until the end of stage (45 DDF) the size increased 30% in relation to the control and 23% in relation to the fruits of T1 (an application of TDZ in flowering and three applications of AG3 to 15 + 30 + 45 DDF). The increase in cell size of parthenocarpic fruits can explain, as well as that achieved in cell numbers, the increase in fruit length and diameter and therefore in the size of the fruit, indicating that the repeated applications of TDZ and AG3 stimulated the cellular elongation and therefore the size of the fruit.
The results agree with those obtained in fruit trees such as vine (Pérez and Gómez, 2000) and in pear ‘Kousui’ (Zhang et al., 2007), where the increase in fruit size was associated with an increase in the size of mesocarpo by the action of GAs. In cranberry, differences in fruit size were mainly associated with differences in cell size, but the number of cells had a lower ratio (Cano-Medrano and Darnell, 1997b).
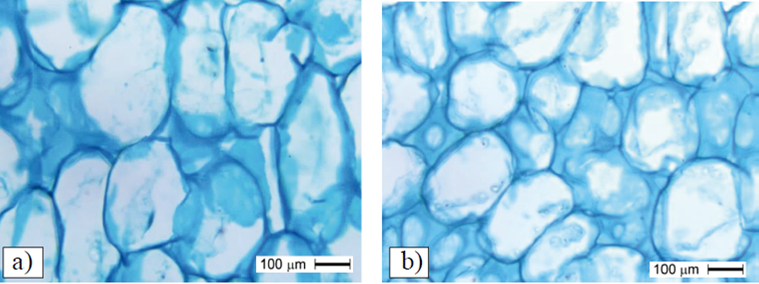
On the other hand, even when the parthenocarpic fruit size increased, it did not exceed that of the pollinated ones. The difference was that although the regulators stimulated cell division and elongation in parthenocarpic fruits, the size of the cells in pollinated fruits was higher (Figure 7a).
Conclusions
The application of TDZ and AG3 did not increase the strength of the demand in parthenocarpic fruits of ‘Ataulfo’, so the increase in size of the fruits is not associated with the distribution of photosynthates.
Sucrose was the main sugar in mango fruits ‘Ataulfo’ in stage III development.
The increase in parthenocarpic fruit size was associated with greater cell division and elongation.
In parthenocarpic fruits, TDZ (cytokinin) assumed an important role in cell division while AG3 had it in cellular expansion.
Pollinated fruits have larger cells than parthenocarpic ones.
Literatura citada
Agusti, M.; Martinez, F. A. and Mesejo, C. 2002. Citrus fruit quality. Physiological basis and techniques of improvement. Agrociencia. 6(2):1-16. [ Links ]
Avigad, G. 1982. Sucrose and other disaccharides. In: plant carbohydrates. Intracellular carbohydrates. Loewus, F. A. and Tanner, W. (Eds.). Springer-Verlag, Berli. ISBN 3- 540-216-11007-0. 13A:234 p. [ Links ]
Bernardes, S. A. P. F.; Lajolo, F. M. e Cordenunsi, B. R. 2003. Evolução dos teores de amido e açúcares solúveis durante o desenvolvimento e amadurecimento de diferentes cultivarem de manga. Ciênc. Tecnol. Aliment. Campinas. 23(Supl):116-120. [ Links ]
Bernardes, S. A. P. F. ; Oliveira-Nascimento, J. R.; Lajolo, F. M. and Cordenunsi, B. R. 2008. Starch mobilization and sucrose accumulation in the pulp of Keitt mangoes during postharvest ripening. J. Food Biochem. 32:384-395. [ Links ]
Bertin, N.; Borel, C.; Brunel, B.; Cheniclet, C. and Causse, M. 2003. Do genetic make-up and growth manipulation affect tomato fruit size by cell number, or cell size and DNA end reduplication? Ann. Bot. Lond. 92(3):415-424. [ Links ]
Bertin, N. ; Causse, M. ; Brunel, B. ; Tricon, D. and Genard, M. 2009. Identification of growth processes involved in QTLs for tomato fruit size and composition. J. Expt. Bot. 60(1):237-248. [ Links ]
Bohner, J. and Bangerth, F. 1988. Effects of fruit-set sequence and defoliation on cell number, cell-size and hormone levels of tomato fruits (Lycopersicon esculentum Mill.) within a truss. Plant Growth Regulator. 7(3):141-155. [ Links ]
Cano, M. R. and Darnell, R. L. 1997a. Sucrose metabolism and fruit growth in parthenocarpic vs seeded blueberry (Vaccinium ashei) fruits. Physiol. Plantarum. 99(3):439-446. [ Links ]
Cano, M. R. and Darnell, R. L. 1997b. Cell number and cell size in parthenocarpic vs pollinated blueberry (Vaccinium ashei) fruit. Annals of Botany. 80(4):419-425. [ Links ]
Castrillo, M.; Kruger, N. J. and Whatley, F. R. 1992. Sucrose metabolism in mango fruit during ripening. Ireland. Plant Sci. 841:45-51. [ Links ]
Cheng, G. W. and Breen, P. J. 1992. Cell count and size in relation to fruit size among strawberry cultivars. USA. J. Amer. Soc. Hort. Sci. 117(6):946-950. [ Links ]
Goldschmidt, E. E. 1999. Carbohydrate supply as a critical factor for citrus fruit development and productivity.USA. HortScience. 34(6):1020-1024. [ Links ]
Hubbard, N. L.; Pharr, D. M. and Huber, S. C. 1991. Sucrose phosphate synthase and other sucrose metabolizing enzymes in fruits of various species. Physiol. Plantarum . 82(2):191-196. [ Links ]
Johnson, L. K.; Malladi, A. and NeSmith, S. 2011. Differences in cell number facilitate fruit size variation in rabbiteye blueberry genotypes. J. Amer. Soc. Hort. Sci . 136(1):10-15. [ Links ]
Khalid, S.; Mañik, A. U.; Khan, A. S. and Jamil, A. 2012. Influence of exogenous applications of plant growth regulators on fruit quality of young ‘Kinnow’ mandarin (Citrus nobilis × C. deliciosa) trees. Int. J. Agric. Biol. 14(2):229-234. [ Links ]
Koch, K. 2004. Sucrose metabolism: regulatory mechanisms and pivotal roles in sugar sensing and plant development. Plant Biol. 7(3):235-246. [ Links ]
Ogata, T; Tamura, H.; Hamada, K. and Hasegawa, K. 2010. Effect of gibberelin on setting and growth of non-pollinated parthenocarpic fruit in mango. Acta Hortic. 884(78):597-604. [ Links ]
Olmstead, J. W.; Lezzoni, A. F. and Whiting, M. D. 2007. Genotypic differences in sweet cherry fruit size are primarily a function of cell number. J. Amer. Soc. Hort. Sci . 132(5):697-703. [ Links ]
Pérez, B. M. H.; Osuna-Encio, T.; Gutiérrez-Espinosa, M. A.; Santiago-Cruz, M. de J. y Cano-Medrano, R. 2015. Thidiazuron y ácido gibrerélico en amarre y tamaño de fruto de mango ‘Ataulfo’ polinizados y partenocárpicos. Interciencia. 40(10):677-683. [ Links ]
Pérez, F. and Gómez, M. 2000. Possible role of soluble invertase in the gibberellic acid berry-sizing effect in Sultana grape. Plant Growth Regulation. 30(2):111-116. [ Links ]
Rapoport, H. F.; Manrique, T. and Gucci, R. 2004. Cell division and expansion in the olive fruit. Acta Hort. 636(56):461-465. [ Links ]
SAS. 2008. SAS versión 9,2. SAS Institute Inc. Cary, NC, EEUU. [ Links ]
Scorza, R.; May, L. G.; Purnell, B. and Upchurch, B. 1991. Differences in number and area of mescocarp cells between small- and large fruited peach cultivars. J. Amer. Soc. Hort. Sci . 116(5):861-864. [ Links ]
Tanksley, S. D. 2004. The genetic, developmental, and molecular bases of fruit size and shape variation in tomato. Plant Cell. 16(1):S181-S189. [ Links ]
Wei, C. B.; Wu, H. X.; Ma, W. H.; Wang, S. B. and Sun, G. M. 2013. Sucrose Metabolism and Changes of Relative Enzymes in Mangifera indica L.‘Irwin’. Acta Hortic . 992(70):569-574. [ Links ]
Zhang, C.; Tanabe, K.; Tamura, F.; Itai, A. and Yoshida, M. 2007. Roles of gibberellins in increasing sink demand in Japanese pear fruit during rapid fruit growth. Plant Growth Regulator 52(2):161-172. [ Links ]
Zhang, C.; Tanabe, K.; Wang, S.; Tamura, F.; Yoshida, A. and Matsumoto, K. 2006. The impact of cell division and cell enlargement on the evolution of fruit size in Pyrus pyrifolia. Ann. Bot. 98(3):537-543. [ Links ]
Received: April 00, 2017; Accepted: July 00, 2017
 Este es un artículo publicado en acceso abierto bajo una licencia Creative Commons
