


Serviços Personalizados
Journal
Artigo
 texto em
  Inglês (pdf)
 Artigo em XML
 Referências do artigo
 Enviar este artigo por email
Indicadores
-
 Citado por SciELO
 -
 Acessos
Links relacionados
-
 Similares em
SciELO
Similares em
SciELO
Compartilhar

 Permalink
Revista mexicana de ciencias agrícolas
versão impressa ISSN 2007-0934
Rev. Mex. Cienc. Agríc vol.8 no.8 Texcoco Nov./Dez. 2017
https://doi.org/10.29312/remexca.v8i8.704
Articles
Development of a web application to evaluate agricultural crops through the MAP method
1Colegio de Postgraduados-Campus Montecillo. Carretera México-Texcoco km 36.5, Montecillo, Texcoco, Estado de México. CP. 56230.
2Campo Experimental Valle de México-INIFAP. Carretera Los Reyes-Texcoco km 13.5, Coatlinchán, Texcoco, Estado de México. AP. 10. CP. 56250. Tel. 01 (800) 0882222, ext. 85353. (sangerman.dora@inifap.gob.mx).
3Campo Experimental Pabellón- INIFAP. Pabellón de Arteaga, Aguascalientes. CP. 20660. Tel. 01 (800) 0882222. (reyes.luis@inifap.gob.mx).
A web application was developed, with a friendly interface, a flexible and secure database for information management, this application evaluates agricultural crops through the methodology of the matrix of policy analysis (MAP) developed by Monke and Pearson (1984). In order to know the accuracy of the web application in agricultural crops, an essay was made capturing a wheat production crop in Guanajuato (District 005 Cortazar), based on information already obtained. Once the analysis was done, it was concluded that the developed web application is efficient, accurate and reliable to evaluate agricultural crops through variables such as competitiveness, comparative advantage and protection coefficients. The contribution of this work shows that it is possible to create web applications that allow the evaluation of agricultural crops.
Keywords: comparative advantage; competitiveness; indicators; subsidy
Se desarrolló una aplicación web, con una interfaz amigable, cuenta con una base de datos flexible y segura para el manejo de información, esta aplicación evalúa cultivos agrícolas a través de la metodología de la matriz de análisis de políticas (MAP) desarrollado por Monke y Pearson (1984). Para conocer la precisión de la aplicación web en cultivos agrícolas, se hizo un ensayo capturando un cultivo de producción de trigo en Guanajuato (Distrito 005 Cortázar), realizado con base a información ya obtenida. Una vez efectuado el análisis se concluyó que la aplicación web desarrollada es eficiente, precisa y confiable para evaluar cultivos agrícolas mediante variables como competitividad, ventaja comparativa y coeficientes de protección. La aportación de este trabajo demuestra que es posible crear aplicaciones web que permiten evaluar cultivos agrícolas.
Palabras claves: competitividad; indicadores; subsidio; ventaja comparativa
Introduction
The analysis of comparative advantages is essential to measure the effects of commercial openness and the efficiency of regional production systems. For the development of this work we have used the matrix of the policy analysis matrix (MAP), developed by Monke and Pearson (1984). This is a theoretical model to build the matrices of income, costs and profits (at private and economic prices) through spreadsheets, so it is difficult to keep the correct data and avoid errors if you do not have the necessary care, in addition an efficient, precise and user-friendly tool is required for greater competitiveness, in view of the above, a web application was developed that offers a user-friendly interface design that allows analyzing competitiveness, comparative advantages, as well as the profitability of projects agricultural products through the MAP method.
The MAP is based fundamentally on the analysis of budgets, at market prices and at social prices (opportunity costs). Thus, competitiveness (measured as private profitability) and comparative advantages (efficiency in the use of domestic production resources) of different production systems and different production areas are determined, referring to specific consumption centers (Gittinger, 1983). One of the advantages of this methodology is the identification of the different policy instruments (macroeconomic and sectorial) that affect the competitiveness of agricultural systems and the quantification of the effects of these policies (Salcedo, 2007).
Under this scenario of international competitiveness, agricultural production in the country assumes this concept: producing efficiently for the domestic and foreign markets, since these products offer comparative advantages and profitability, are an important source of foreign currency and also generate employment (Salcedo et al., 1993). Therefore it is necessary to have an efficient tool for setting policies in an agricultural system based on the calculation of a series of indicators that allow us to determine the situation of competitiveness, protection and subsidy, such as MAP but in a faster way.
The MAP reorganizes data from private and social budgets to facilitate the evaluation of policy effects and market distortions in marketable inputs, factors of production and products. The MAP format contains data on income, costs and profitability for a single crop at private and social prices (Pearson and Monke, 1984).
Therefore, the main objective of this work is to develop a web application with a friendly interface and an adequate, flexible and secure database for the management of information in the analysis of competitiveness and comparative advantages of agricultural crops through the MAP method. In this work the development of a web application is considered, for which some concepts related to the application and related to it are defined.
A web application is a computer system that users use by accessing a web server through the Internet or an intranet. Web applications are popular due to the simplicity of the web browser as a thin client (Senn, 1997). The ease of updating and maintaining web applications without distributing and installing software on thousands of potential clients is another reason for its popularity (Barry and Lang, 2001).
The web application resides on a server and responds to customer requests over the Internet. On the client side, the web application is hosted by a browser. The user interface of the application takes the form of HTML pages and are displayed by the client’s browser (Escalona et al., 2002). The application server reads the code of the page, finishes the page according to the instructions of the code and removes the code from the page. The result is a static page that the application server returns to the web server, which in turn sends it to the requesting browser. The only thing that the browser receives when the page arrives is pure HTML code (Sierra and Antonio, 2007).
Web applications need a programming language that is a set of instructions, operators and syntax rules, which are made available to the programmer so that they can communicate with existing hardware and software devices (Mueller, 2005). A database that Whitten et al. (1996) defines as a comprehensive non-redundant set of structured data organized independently of its use and its implementation in machine accessible in real time and compatible with concurrent users with need for different information and not predicable in time.
A web application is developed through a systems life cycle. Laudon and Laudon (1996) states that a systems development life cycle is a view of the activities that occur during software development, attempts to determine the order of the stages involved and the transition criteria associated between these stages. The cascade model is the most basic of all the models, and serves as a building block for the other life cycle models (Pressman, 2001). The vision of the waterfall model says that software development can be through a simple sequence of phases. Each phase has a set of well-defined goals, and the activities within a phase contribute to the satisfaction of goals of that phase or perhaps to a sub-sequence of goals of the phase (Sommerville, 2001).
Materials and methods
Methodology of the MAP
Gotsch et al. (2003) point out that the main data that make up the budget of a crop are: tradable inputs (fertilizers, seeds, pesticides), internal factors (land, labor and capital), products (crops) and by-products, prices of inputs and products.
After calculating the private budget, the social prices are determined. The social prices of internal factors and tradable goods are determined differently. Internal factors are assigned social prices equivalent to the value of their opportunity cost; that is to say, the utilities in their alternative use more profitable from the social point of view. The value of the opportunity cost of the land can be estimated from the same budgets of the activities (such as the marginal utilities of the land in the most profitable crops from the social point of view). It is difficult to establish the opportunity cost values of labor and capital since it involves adjusting market prices by means of some selected compensatory conversion factor to reflect the estimated degree of distortion existing in the economy (Naylor and Gotsch, 1992).
According to Morris (1990) with the data of the economic budget can calculate the cost ratio of internal resources or comparative advantage of a crop with the following formula:
Where: RCR= cost ratio of internal resources; G= cost of internal factors valued at economic prices; E= gross income valued at economic prices; F= cost of production of tradable inputs valued at economic prices; and (E-F)= value added valued at efficiency (economic) prices.
If RCR is greater than unity or negative, it implies that: it is not profitable for the country to produce the crop, there is an inefficient use of domestic resources and the country has no comparative advantage in crop production. If RCR is less than the unit implies that: if it is profitable for the country to produce the crop, there is an efficient use of internal resources and the country has a comparative advantage in the production of the crop.
Forero et al. (2007) indicates that the nominal protection of inputs (CPNI) coefficient shows the degree of transfer in marketable inputs and is determined by the quotient of these inputs evaluated at private prices between their corresponding evaluations at economic efficiencyprices.
Where: B= production cost of tradable inputs valued at private prices; F= production cost of tradable inputs valued at economic prices; Pj= weighted average price of marketable inputs, at national market prices; and Pj*= average price of economic efficiency of marketableinputs.
Jimenez and Quiros (1999) define the effective protection coefficient (CPE) as the relationship between the values added at market prices between the values added at economic prices. This coefficient measures the degree of transfer to products and inputs derived from the commercial policy and the exchange rate.
Where: A= gross income valued at private prices; B= production cost of tradable inputs valued at private prices; E= gross income valued at economic prices; F= production cost of tradable inputs valued at economic prices; VAP= value added at market prices (A-B); and VAE= value added valued at economic efficiency prices.
If the CPE is greater than one, it implies that the effect of policies oriented towards products and marketable inputs constitutes a positive incentive to production and cultivation is protected. If the CPE is less than one, it implies that the effect of the policies oriented to products and marketable inputs constitutes a negative incentive for production, the crop is not protected and the higher the CPE, the greater the private gain compared to the one it would generate, in the absence of policies that positively affect the product and marketable inputs since it ignores the effects of the policy on internal factors of production.
Several methods were used to carry out the project, such as: the system development life cycle was cascaded, which was divided into six stages, which are analysis, design, coding, testing, installation and maintenance. There are many variants that depend on the organization, the type of system to be made, the tastes of the administrators and time. The database development cycle was divided into two phases that aims to design the logical and physical structure of a database to meet the information needs of users of a defined set of applications.
The technology that was selected is ASP.Net in combination with the C# programming language, ASP.NET is complemented by a designer and a very complete toolbox in the integrated visual studio programming environment, it is independent of the language (MacDonald, 2002). C# was selected for its full support for object-oriented programming; the database manager that was chosen is mySQL, because of the type and size of the information handled in it. Regarding the navigation design, the type of structure defined is hierarchical because of the first screen that is the beginning of the session, the registration screen and the crop screen are derived from which the budget screen appears and from this the screen of private, economic budget, summaries and policy effects.
The search for errors that were made through the unit tests, which were used to check the correct functioning of a specific component of the application, as new functionalities were added to the application, tests were performed to measure the progress, as well as to verify that what used to work continues to work giving way to regression tests; integration tests: these were carried out after having concluded the total application, checking the operation in an integral manner. The navigation tests were performed to ensure that there were no broken links and the access tests were run to verify that only registered users could enter.
Development of a crop exemplified through software
To determine the accuracy of the web application in agricultural crops, a trial was conducted capturing a wheat production crop in Guanajuato (District 005 Cortazar), carried out according to the information obtained by Luna (2005). The sample crop analyzed corresponds to nine rural development support centers (CADER’s) in the state of Guanajuato, with irrigation technology by pumping, to exemplify the technology used for irrigation by pumping, BMF was used with an area of 3 928.2 ha and yield of 7 t ha-1.
Results and discussion
The developed web application was called the Evaluation System MAP (SIEMAP), which will allow users to register information on agricultural crops that they wish to evaluate. The web application starts with a user registration screen where you must enter username and password through text boxes, if you do not have these data you need to press register to create an account (Figure 1).

After registering a window will appear that allows us to capture crops, we must capture the general data of the crop and then start capturing budgets, which are entered by sections, it is necessary to capture the two budgets before referring to the summaries (Figure 2).

First, the private budget is captured because if it is not, the economic budget will not be shown since it depends on the private one. To start the private budget, press the private budget button and the input classification window will be displayed. Figure 3. In the figure there is an order of introduction that must be followed to avoid errors.

Each section must be completed through a form with text boxes that ask for different data and have three buttons; calculate, save and cancel. It also has a table that shows the data that is saved to later modify or eliminate them, these elements are similar in each section. As referred to in Figure 4.

In the case of the economic budget, its capture mode is different. A table of each type of inputs, previously captured in the private budget with the name of the input and the quantity of the input, is shown. The user only enters the economic price in the order that the private was captured, as shown in Figure 5.

After finishing the capture of both budgets you can see the reports, which in the web application are shown in the budgets window as summaries of each budget and MAP. In these summaries we can see the following reports: full budget, budget summary, relative cost structure, income analysis, relative income structure and budget indicators. MAP considers the two budgets to generate their reports, which are net effects of the policy and protection coefficients. The reports are seen in a list where we can choose the report that we want to see. All can be printed on letter-size sheets and are exportable to Microsoft Office Word, Microsoft Office Excel and Acrobat Reader. As seen in Figure 6.

With the information obtained from the crop with BMF technology, MAP calculations were made through the web application, obtaining the results that are analyzed below.
In the Table 1 shows the percentage structure and value of production costs of wheat with BMF technology at private prices. The total cost per hectare of the aforementioned crop is $12 287.15, where the highest percentage of the total cost was in internal factors cost represented 49.66% equivalent to $6 101.63 mainly for the supply of electricity and the high cost of manual labor.
Table 1 Structure and value of private appreciation wheat production costs.

Elaboración con datos obtenidos de la aplicación.
In Table 2 it is observed that the cost of internal factors represents the highest cost with 80.65% of the total cost that is equivalent to the amount of $19 428.14, this as a consequence of the opportunity cost assigned to the land is $15 000, which is what they are failing to earn by producing wheat.
Table 2 Structure and value of wheat production costs at economic prices.

Elaboración con datos obtenidos de la aplicación.
In Table 3 it can be seen that at private prices a total income of $11 550.00 was obtained and generated a net added value of $3 514.33 as well as an intermediate consumption of $8 035.67, the absolute remuneration to the capital was $288.08. This means that wheat production generates an outflow of $8 035.67 ha-1. Therefore, the 3 928.2 ha analyzed yielded $31 565 718.89 in the entire district, generating value in the sector itself of $3 514.33 and for the 3 928.2 ha of the district $13 804 991.11 These data show the importance of wheat production In the analysis of income at economic prices, it is observed that the total income obtained is higher than the private prices 43.29%, passing from $11 550.00 to $16 550.45 ha-1. This indicates that the producer is failing to earn due to the effect of both commercial policies and the exchange rate and the interest rate of approximately $2 500 ha-1.
Table 3 Total income in the cultivation of wheat at private and economic prices.
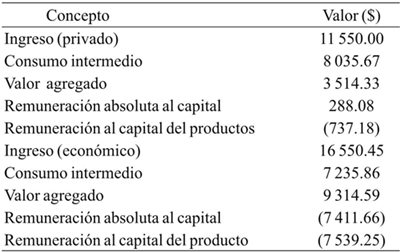
Elaboración con datos obtenidos de la aplicación.
There is loss at economic and private prices but the loss at private prices was lower; therefore for this crop there is a negative gain in both budgets for private prices $737.15 and economic prices $7 539.25. Table 4 shows that tradable inputs received negative transfers (taxes) with an amount of $480.38 ha-1. The internal factors received positive transfers (subsidies) with an amount of $13 326.51 ha-1. Indirectly tradable inputs have a tax and their total is $1 043.58 ha-1. With regard to gross income, it is observed that it is $5 000.45 ha-1. Which results from the difference between the private and economic price, in addition to the exchange rate policy. It is worth mentioning that in marketable inputs, internal factors and indirectly tradable inputs the numbers in parentheses mean subsidies; however, in the items such as gross income and total effect, they mean taxes. In the total effect an indirect tax is observed as a result of the equivalent policies corresponding to $6 802.10.
Table 4 Summary of policy effects on wheat production.

Elaboración con datos obtenidos de la aplicación
The private cost ratio (RCP) indicates the proportion that the factors represent within the value added. The RCP indicator was 1.13, therefore the crop does not pay the cost of the factors, there is no profit generation and it is not profitable. For the calculation of the comparative advantage, the indicator “cost ratio of internal resources” (RCR) was used, which indicates the efficiency of each production alternative when using internal resources to save a currency unit, the RCR indicator for this crop was 1.30 this means that it is not profitable for the country, there is an inefficient use of domestic resources and therefore has no comparative advantage.
The nominal input protection coefficient (CPNI) shows the degree of transfer to marketable and indirectly tradable inputs. The majority of the CPNI is greater than one unit, which means that these inputs are unprotected or overvalued. The case of herbicides that have a tax of 584%, insecticides with 182% and fungicides with 114% stand out in this area. This means that the herbicides have a price of $736.16, the insecticides of $151.12 and the fungicides of $175.96, the seed turned out to have an indirect tax of 55%, equivalent to $237.6. Regarding the indirectly tradable inputs, it is observed that they are protected and the highest protection is provided by the pumping equipment that presents an indirect tax of 117% equivalent to $721.57.
The effective protection coefficient (CPE) obtained was 0.71. It shows that producers are receiving lower remuneration for their production factors due to policy interventions; that is, there is a disincentive (lack of protection), it is negatively affected by trade policies such as tariffs, quotas on foreign trade, taxes, subsidies and exchange rates.
The social subsidy to the producer (SSP) for this crop was 0.41% of the income generated in economic terms which is mainly due to the overvaluation of the currency among other things. With regard to the subsidy equivalent to the producer (ESP) for this example was 0.59%, which indicates that an indirect tax of 41% is applied respectively. Finally, the ratio of subsidy to the profit of the producer (SGP) for this crop cannot be calculated since it requires both private and economic gains to be positive.
Conclusions
It was possible the development of the web application to perform the evaluation of crops through the MAP method, with each of its elements, and its interface was designed so that any user with knowledge of the MAP method can use it. The results show that the web application is efficient, accurate and reliable to evaluate crops through the MAP method. It allows us to generate reports of each of the budgets quickly such as: full budget, budget summary, relative cost structure, income analysis, relative income structure and budget indicators. For MAP, the reports are net effects of the policy and protection coefficients, in which both budgets are included. Through these you can determine different variables such as competitiveness, comparative advantage, protection coefficients, subsidy relations. These reports can be exported in various formats such as DOC (Microsoft Word), XLS (Microsoft Excel) and PDF (Acrobat Reader).
Based on the information of the wheat crop used and once the analysis was made, the following conclusions were obtained: wheat production is subject to a series of market distortions that manifest themselves in very high values that affect profitability and competitiveness cultivation, cultivation is not competitive not because it allows the generation of profits, is not profitable for the country, an inefficient use of domestic resources is given and therefore has no comparative advantage and also the producers are receiving less remuneration their production factors due to policy interventions.
Literatura citada
Barry, C. and Lang, M. 2001. A survey of multimedia and web development techniques and methodology usage. IEEE Multimedia. 8(2):52-60 [ Links ]
Escalona, M. J.; Torres, J. y Mejías, M. 2002. Metodologías de desarrollo de sistemas de información en la web y análisis comparativo. Novática. Rev. Asoc. Téc. Inf. 159:49-59. [ Links ]
Forero, J.; Saboya, S. y Ezpeleta, S. 2007. La competitividad de los productores agropecuarios colombianos integrados a la cadena de alimentos balanceados para animales y a la cadena láctea. Proyecto de asistencia técnica de la FAO TCP/COL/3001.FAO. Colombia. [ Links ]
Gotsch, C.; Scott, H.; Pearson, R. and Bahri, S. 2003. Computer tutorial for policy analysis matrix (PAM) in Indonesian agriculture. 20-115 pp. [ Links ]
Gittinger, J. 1983. Análisis económico de proyectos agrícolas. Instituto de Desarrollo Económico-Banco Mundial (BM). Tecnos, Madrid. 221 p. [ Links ]
Couloris, G.; Dollimor, J. y Kindberg, T. 2001. Sistemas distribuidos: conceptos y diseño. Addison-Wesley, Madrid. 84 p. [ Links ]
Jiménez, A. y Quiros, Y. 1999, Aplicación de la Metodología Matriz de Análisis de Política (MAP) el caso de la papa en Costa Rica. In: XI congreso Nacional Agronómico. [ Links ]
Laudon, K. y Laudon, J. 1996. Administración de los sistemas de información. 3ra . edición. 426 p. [ Links ]
Luna, E. 2005. La producción de trigo en la principal región productora de Guanajuato (Distrito 005 Cortázar), en el ciclo otoño - invierno 2002-2003. Problemática frente al TLCAN. Tesis de Maestría. 165 p. [ Links ]
MacDonald, M. 2002, ASP.NET. Manual de referencia. McGraw-Hill/Interamericana de España, SA. 481 p. [ Links ]
Morris, M. L. 1990. Determinación de la ventaja comparativa mediante el análisis del CRI: pautas establecidas a partir de la experiencia del CIMMYT. El Batán, Texcoco, Estado de México. [ Links ]
Mueller, J. 2005. Desarrollo de aplicaciones web con visual studio 2005. Wiley. 822 p. [ Links ]
Naylor, R. y C. Gotsch. 1992. Matriz de análisis de política: ejercicios de cómputo. Traduc. Salcedo, S. Secretaría de Agricultura y Recursos Hidráulicos-Subsecretaría de Política Sectorial y Concertación. México. 87 p. [ Links ]
Pearson, S. R. and E. A. Monke, 1984. The policy analysis matrix. A manual for practitioner. The Praga Corporation. Falls Church, Va. USA. 201 p. [ Links ]
Pressman, R. S. 2001. Ingeniería de Software: un enfoque práctico. McGraw-Hill. New York. 850 p. [ Links ]
Salcedo, S. 1993. Política agrícola y maíz en México: hacia el libre comercio norteamericano. Rev. Comercio Exterior. 43(4). [ Links ]
Salcedo, S. 2007. Competitividad de la agricultura en América Latina y el Caribe. Oficina Regional de la FAO para América Latina y el Caribe, Santiago, Chile. Proyecto de cooperación técnica de la FAO TCP/COS/3001. 98 p. [ Links ]
Senn, J. 1997. Análisis y diseño de sistemas de información. 2da . edición. McGraw-Hill. Colombia. [ Links ]
Sierra, M. y Antonio, J. 2007. Desarrollo de aplicaciones web con ASP.net 2.0. RA-MA. Madrid, España. [ Links ]
Sommerville, I. 2001. Software engineering. Addison-Wesley. 720 p. [ Links ]
Whitten, J. L.; Bentley, Lonnie, D. y Barlow, V. 1996. Análisis y diseño de sistemas de información. McGraw-Hill. Colombia.908 p. [ Links ]
Received: July 2017; Accepted: November 2017
 Este es un artículo publicado en acceso abierto bajo una licencia Creative Commons
