


Serviços Personalizados
Journal
Artigo
 texto em
  Inglês (pdf)
 Artigo em XML
 Referências do artigo
 Enviar este artigo por email
Indicadores
-
 Citado por SciELO
 -
 Acessos
Links relacionados
-
 Similares em
SciELO
Similares em
SciELO
Compartilhar

 Permalink
Revista mexicana de ciencias agrícolas
versão impressa ISSN 2007-0934
Rev. Mex. Cienc. Agríc vol.8 no.8 Texcoco Nov./Dez. 2017
https://doi.org/10.29312/remexca.v8i8.703
Articles
Climate change affects the number of hours in the thermal ranges of chilli in North-Central Mexico
1,2Campo Experimental Zacatecas-INIFAP. Carretera Zacatecas-Fresnillo km 24.5, Calera, Zacatecas, México. (medina.guillermo@inifap.gob.mx; mena.jaime@inifap.gob.mx).
3Campo Experimental Centro Altos de Jalisco- INIFAP. Carretera libre Tepatitlán-Lagos de Moreno km 8, Tepatitlán, Jalisco, México.
4Campo Experimental Pabellón- INIFAP. Carretera Aguascalientes-Zacatecas km 32.5, Pabellón de Arteaga, Aguascalientes, México. (rodriguez.victor@inifap.gob.mx).
5Sitio Experimental Metepec-INIFAP. Carretera Toluca-Zitácuaro km 4.5, Vialidad Adolfo López Mateos s/n, Zinacantepec, Estado de México, México. ( soria.jesus@inifap.gob.mx).
In Mexico, chili cultivation has a long cultural tradition and is one of the main centers of origin and domestication. An average of 97,306 ha is planted annually in the north of the country. However, the productivity of the chili crop is very erratic due to biotic and abiotic factors that occur during its development. Extreme temperatures and water availability are two of the dominant abiotic stressors. The objective of this work was to know the effect of global warming, on the thermal range of the chili crop. A historical analysis was performed on the variation of the number of hours with temperature inside and outside the thermal range of chili, and a similar analysis in the climatic scenarios 2050 and 2070 in the RCPs 4.5 and 8.5. Both in the historical analysis and in the climatologies we found positive and negative effects of global warming. Global warming will favor chilli cultivation with a surface increase (22.6%) with hourly temperature within development thresholds (15 to 32 °C) and a surface increase (15.8%) within the optimum temperature range (18 to 28 °C). Chili cultivation will be limited by the increase (20.8%) in the surface area with hourly temperature above the upper threshold (32 °C) and an increase (18.5%) in the area with a night time temperature above the upper threshold of night temperature (18 °C) in RCP 4.5 and in climatology 2050. High temperature stress will have an effect on the yield decrease due to the negative effect on pollination and fruit binding processes.
Keywords: Capsicum annuum; global warming; hourly temperature; Mexico; RCP
En México el cultivo del chile tiene una larga tradición cultural y es uno de los principales centros de origen y domesticación, anualmente se siembran en promedio 97 306 ha en el Norte Centro del país. Sin embargo, la productividad del cultivo de chile es muy errática debido a factores bióticos y abióticos que se presentan durante su desarrollo. Temperaturas extremas y la disponibilidad de agua son dos de los factores de estrés abiótico dominantes. El objetivo de este trabajo fue conocer el efecto del calentamiento global, sobre el rango térmico del cultivo de chile. Se realizó un análisis histórico sobre la variación del número de horas con temperatura dentro y fuera del rango térmico de chile, y un análisis similar en los escenarios climáticos 2050 y 2070 en los RCP 4.5 y 8.5. Tanto en el análisis histórico como en las climatologías se encontraron efectos positivos y negativos del calentamiento global. El calentamiento global favorecerá al cultivo de chile con un aumento de la superficie (22.6%) con temperatura horaria dentro de los umbrales de desarrollo (15 a 32 °C) y un aumento de la superficie (15.8%) dentro del rango de temperatura óptima (18 a 28 °C). El cultivo de chile se verá limitado por el aumento (20.8%) de la superficie con temperatura horaria mayor al umbral superior (32 °C) y un aumento (18.5%) de la superficie con temperatura nocturna horaria mayor al umbral superior de temperatura nocturna (18 °C) en el RCP 4.5 y en la climatología 2050. El estrés por temperatura alta repercutirá en la disminución del rendimiento debido al efecto negativo en los procesos de polinización y amarre de frutos.
Palabras clave: Capsicum annuum; calentamiento global; México; RCP; temperatura horaria
Introduction
El género Capsicum comprende más de 200 variedades de chile, agrupadas en más de 30 especies, de las cuales, cinco están domesticadas, y es C. annuum L. la más conocida y de mayor importancia económica, ya que es la más ampliamente distribuida y utilizada a nivel mundial (Madhavi et al., 2016); esta especie agrupa a la mayoría de los tipos de chile cultivados en México, entre los que destacan: ancho, serrano, jalapeño, piquín, Anaheim, morrón, mirasol, pasilla y mulato (Muñoz y Pinto, 1970; Pozo, 1981; Laborde y Pozo, 1984).
In Mexico the cultivation of chili has a long cultural tradition and is one of the main centers of origin and domestication (Long, 1982; Laborde and Pozo 1984), as indicated by archaeological remains where ancestral seeds have been found in the valley of Tehuacan, Puebla, with an antiquity of 8 500 years (Evans, 1993). Annually, an average of 97 306 ha (2010-2014) is planted in Chili under irrigation conditions in the spring-summer crop cycle, mainly in the states of Zacatecas, 34.9%, Chihuahua 27%, and San Luis Potosí 15%, Durango 5.2%, Guanajuato 3.7%, Jalisco 3% and Aguascalientes 0.9%, more than 90% of the national surface (SIACON, 2014).
These states are located in the North-Central region of the country in what is known as the Mexican Altiplano and the varieties of wide chili, pasilla, mirasol or guajillo and puya, such as dry chili are grown. However, the productivity of the chili crop is very erratic due to both the biotic and abiotic factors that occur during the development of the crop. Extreme and inadequate temperatures and water availability are two of the dominant abiotic stressors in this chili producing region, which drastically reduce the growth and production of this crop.
In order to develop the technologies required to overcome the limiting effects of abiotic stress on the productivity of the chili crop, it is necessary to understand the tolerance mechanisms of the plant, the sources of tolerance and the methods to incorporate these qualities into the chili plant. Therefore, a first step is to know the temperature ranges that affect the physiological processes of the chili plants (Taiz and Zeiger, 2006). The maximum and minimum temperature that defines limits of growth and development of an organism, and an optimum temperature at which the growth advances more quickly, are defined as cardinal temperatures. The high temperature affects several aspects of the physiology and growth of the chili plant, which in turn can have a direct or indirect effect on the fruit mooring, and as a consequence, decrease the yield.
Chili originates from tropical and subtropical regions of Central and South America, and requires warm temperature conditions for its development, since its optimum growth is between 25 and 30 °C (Madhavi et al., 2016); however, temperatures above 32 °C, or below 15 °C affect a variety of physiological functions, growth is usually delayed and performance is reduced (Mercado et al., 1997; Gunawardena and De Silva, 2014) this sensitivity to extreme temperatures is more pronounced for the types of chili that have been selected for temperate cultivation regions, such as the Mexican Altiplano, where dry chili is produced, mainly the wide, pasilla, mirasol and puya varieties, whose optimal temperature for their development is between 18 and 28 °C (Medina and Mena, 2016).
There are variations in temperature reports for the development of chili, Sanders et al., 1980, indicate that the minimum temperature for growth and development of the chili plant is 18 °C, with plants in the range of 5-15 °C has poor growth. The highest vegetative growth occurs with temperatures in the range of 25 to 27 °C during the day and at 18-20 °C at night (Bakker and van Uffelen, 1988).
The most important factor determining flower differentiation is environmental temperature, especially at night (Bosland and Votava, 2000). The temperature of the air also has a great effect on the formation of pollen and its viability; temperature above 30 °C occurring 15 days before pollination causes pollen sterility (Cochran, 1938), and night temperature of 10 ±2 °C reduces the number and percentage of germination of the pollen grains (Shaked et al., 2004). The largest fruit mooring occurs when the temperature of day and night is between 21 and 16 °C, respectively.
The yield is high when the air temperature, during the day, during the mooring of fruit, fluctuates between 18 and 32 °C, the fruits do not tie when the temperature during the day is greater of 32 °C (Olareweju, 1988; Aloni et al., 1999). In general, the optimum temperature for fruit berthing is 22 to 26 C during the day and 15 to 18 °C during the night (Rylski and Spigelman, 1982).
The visible morphological changes in chili plants exposed to environmental stress during the flowering and fruiting period are the fall of floral buds, flowers and small fruits (Saha et al., 2010). The poor mooring of fruits is considered as one of the biggest barriers for the tropical adaptation of chili peppers. Flower development stages and early stages of chili seed filling after pollination are more sensitive to heat stress (Erickson and Markhart, 2001).
With climate change it is expected that by 2050 the average temperature of the earth will increase from 2 to 5 °C, or more, according to the Intergovernmental Panel on Climate Change (IPCC, 2014). Currently, climate change represents one of the main problems facing agriculture, due to the changes it causes in climate patterns and therefore in agro-climatology related to the management of agricultural activities. In this study, we intend to know the effect of global warming on the number of hours inside and outside the thermal range of the chili crop in future climatic scenarios.
Materials and methods
The study area comprised the main dry chili producing states of north central Mexico: Chihuahua, Durango, Zacatecas, Aguascalientes, Jalisco, Guanajuato and San Luis Potosi. Daily data of maximum temperature and minimum temperature of the stations of weather of the National Meteorological Service were used. It selected 131 stations with more than 30 years and more than 90% of data. Figure 1 presents the study area, areas with potential for chili production (Medina and Mena, 2016) and the location of the stations used.
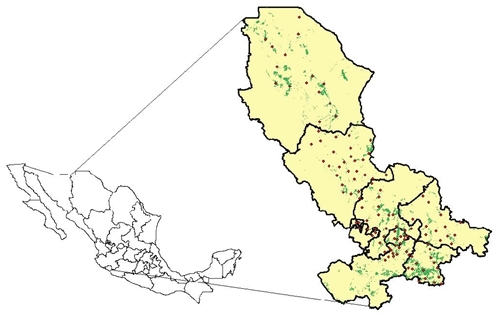
Figure 1 Area of study, areas with potential for the productionof dry chili and climatic stations used.
With the daily data of maximum and minimum temperature, hourly data were obtained (Snyder, 1985) of the entire historical series of data of the stations. With these data the number of hours in which the temperature was inside and outside the optimal cardinal temperature ranges for chili (Table 1) was estimated during the growing cycle. With the number of hours of each range for the April-October crop cycle, each of the series years of each season, regional analyzes of historical trends were made using 20-year moving averages.
Table 1 Threshold and optimal values of cardinal temperatures for dry chili cultivated in the study region.
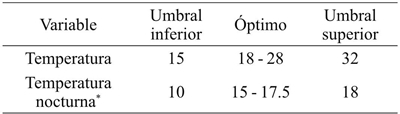
*= la temperatura nocturna se consideró de las 19 a las 6 h.
To generate maps with the number of hours of temperature of each range, regression models were estimated for the crop cycle from April to October. For this, 61 stations were selected nationwide covering different environments. The hourly temperatures per day of each of the 61 stations were obtained, the number of hours of temperature for each range were obtained and they were related to the average maximum and minimum temperatures in the same period of culture. A model was thus obtained for each range for the April-October crop cycle.
In order to estimate the effect of climate change on the number of hours inside and outside the cardinal temperatures, the climate change information system of the Mexican Republic of INIFAP was used (Ruiz-Corral et al., 2016) which consists of base climatology of the period 1961-2010 and climatology of the years 2041 to 2080 in the representative concentration routes (RCP) 4.5 and 8.5 of greenhouse gases (GEI). These were obtained from information from the WorldClim Global Change data portal, which generated an assembly model composed of 11 models of general circulation (GCM) reduced in scale and calibrated (Walton et al., 2013) selected for Mexico BCC-CSM1-1, CCSM4, GISS-E2-R, HadGEM2-AO, HadGEM2-ES, IPSLCM5A-LR, MIROC-ESM-CHEM, MIROC-ESM, MIROC5, MRI-CGCM3, NorESM1-M).
The RCP intermediate emissions was used (4.5) which is consistent with future reductions relatively ambitious emissions and RCP high emissions (8.5) which is consistent with a future without policy changes to reduce emissions (Van Vuuren et al., 2011).With these scenarios the projections were made. The values of maximum temperature and minimum temperature of the years 2041 to 2080 were used. Monthly data were obtained for climatic scenarios 2041-2060 and 2061-2080, hereafter referred to as climatologies or years 2050 and 2070 respectively.
Results and discussion
Historical Trends
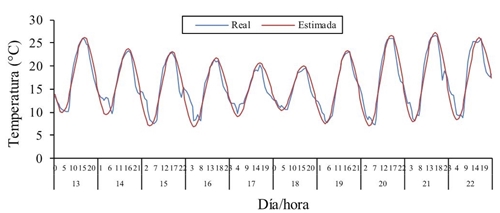
To validate the estimation of temperature time data with the proposed model, daily data of maximum and minimum temperature of an automatic climate station were used and compared with their real time data (Figure 2). The real and estimated were adjusted to a linear regression resulting in a R2= 0.9, fulfilling the 1:1 validation assumptions; that is, the intercept was statistically equal to zero and the slope statistically equal to one (Fritz et al., 1997).
With the hourly data we estimated the number of hours in which the temperature was inside and outside the optimal cardinal temperature ranges for the development of chili in the crop cycle from April to October. The analysis of regional historical trends from 1981 to 2010 and with averages every 20 years (considering the 131 stations) is presented in Figure 3.
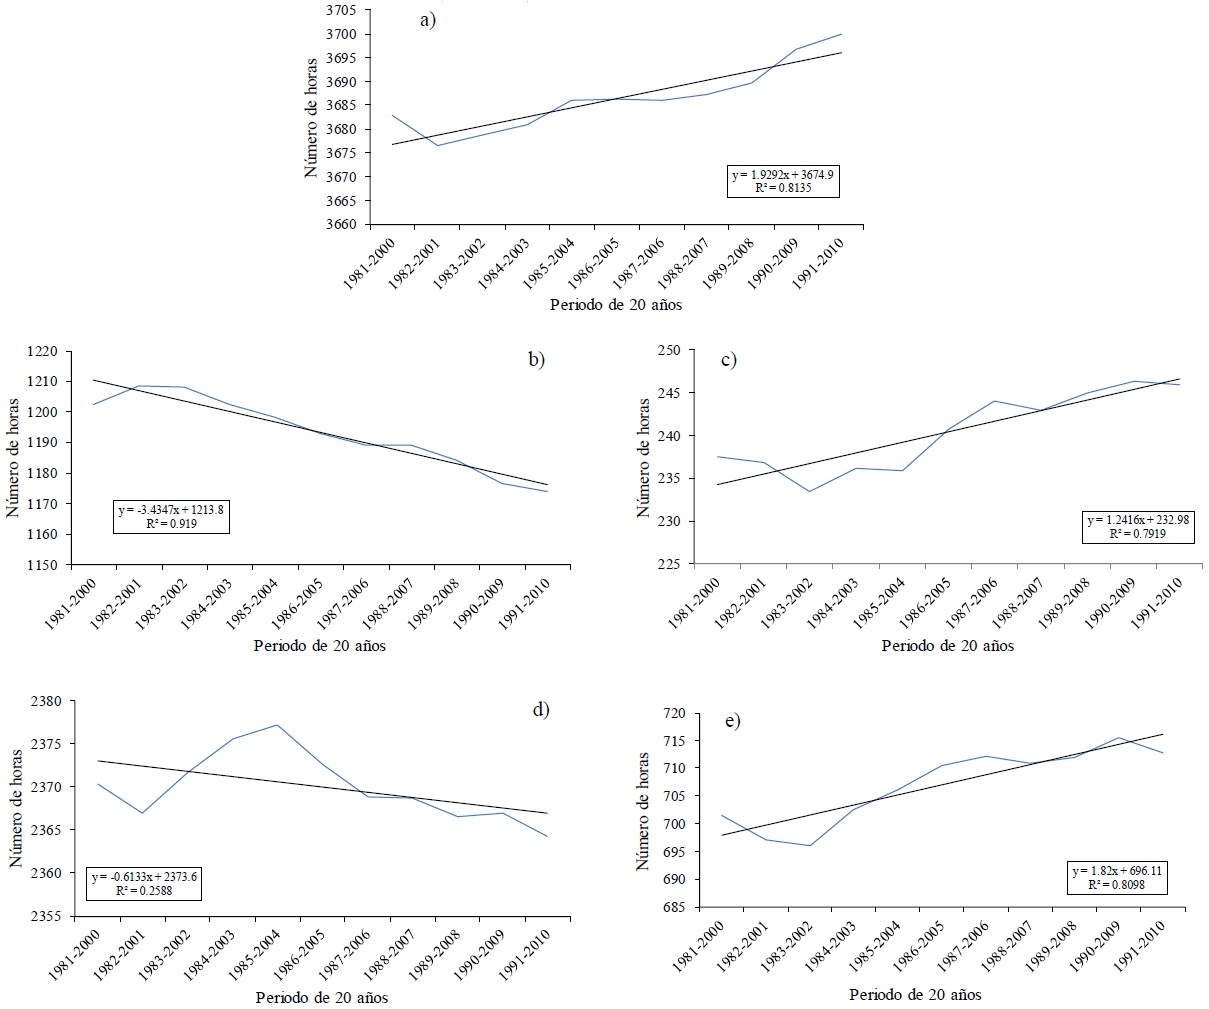
The number of hours within the threshold temperature range for the development of chili (15 to 32 °C), has an increasing tendency (p= 0.0002); that is, the number of hours with appropriate temperature for chili (Cochran, 1938; Shaked et al., 2004) has been increasing (Figure 3a). The historical trend of the number of hours with temperature below the minimum temperature threshold (15 °C) for chili development (Figure 3b) is downward (p≤ 0.0001), which is also a benefit for this culture (Mercado et al., 1997).
However, the temperature above 32 °C, which is harmful to chili because of increased pollen sterility and fruit abortion (Olareweju, 1988; Aloni et al., 1999) has a tendency to increase at the same time would increase the days of heat stress (Figure 3c). Therefore, two of the variables indicate a favorable effect (increase in the number of hours within the range of Capsicum development and decrease in the number of hours below the minimum threshold), whereas the variable hours above the upper threshold of temperature, which negatively affects pollination and fruit binding, has also increased.
The number of hours with temperature within the optimum range the development of chili in the north central region of Mexico (18 to 28 °C) has decreased, as seen in Figure 3d and, conversely, the night temperature greater than 18 (Figure 3e) has increased, which increases the risk of abortion of flowers and small fruits (Gunawardena and De Silva, 2014), the observed response of these two last variables means a trend of lower potential yield of chili.
The number of hours below the minimum temperature thresholds has decreased, this is favorable for chili cultivation (Shaked et al., 2004) because there are more hours with appropriate temperature for the development of chili, but the number of hours above the upper thresholds have increased and this is very detrimental to chili cultivation because the thermal stress especially affects plant height, branches, crown diameter and number of fruits (Gunawardena and De Silva, 2014).
Climate scenarios
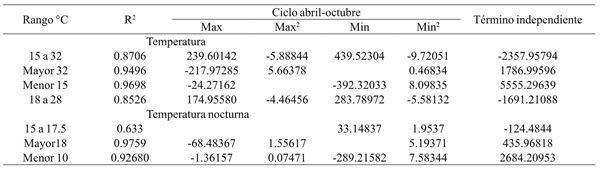
For the analysis of future climatic scenarios, the number of hours of each temperature range for the crop cycle from April to October was related to the mean maximum and minimum temperatures in that same period, this for the 61 stations distributed throughout the area study. The generated models presented values of R2 between 0.8526 and 0.9759, except the model of the night temperature range that resulted with a value of 0.683, all the models resulted with a p≤ 0.0001.
With these models maps of the number of hours of each of the chili developmental thresholds or temperatures (Table 1) were generated for the current climatic scenario (1981-2010) and for the climatologies 2030, 2050 and 2070 for the routes of greenhouse gas concentration (RCP) 4.5 and 8.5. The R2 of all models were acceptable to very good since the values were from 0.85 to 0.97 for both daytime and nighttime temperatures (Table 2). As an example the maps of two temperature ranges are presented. Figure 4 shows the maps with the percentage of the number of hours with temperature between the thresholds for chili development (15 to 32 °C) in the April-October crop cycle in the North Central region.
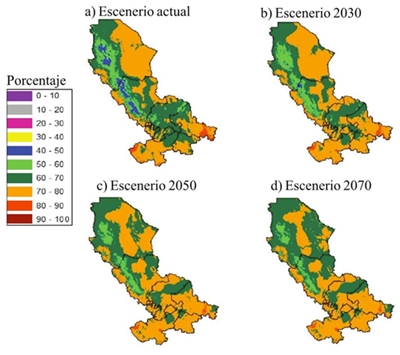
Figure 4 Percentage of the number of hours with temperaturas of 15 to 32 °C (thresholds for chili) in the April- October crop cycle, in four climatic scenarios in the dry chili production region.
Table 2 Coefficients of regression models to estimate the number of hours in each temperature range from maximum and minimum average temperature in the April to October cycle.
The chili cultivation is mainly planted in areas that have between 60 and 70% of the total number of hours in the agricultural cycle within this chili thermal range (Figure 4a, dark green); in the 2050 climatology the surface with this range is maintained and then increases 16.97% in the climatology 2070 in RCP 4.5. Considering the surface of the current scenario as 100%, in Figure 4b it can be seen that by the year 2030 there is a decrease of 9.3% of the surface between 60 and 70% of hours within the thermal range of chili from 100 a 90.7% (Table 3), this means that there will be a smaller area with temperature within the range for the development of Chili, mainly in the states of Zacatecas, Aguascalientes and Guanajuato.
Table 3 Percentage of the number of hours within the chili thermal range (15-32 °C) in the April-October cycle and its percentage in future climatic scenarios in the North-Central region.
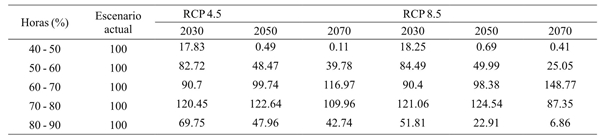
Porcentaje de los escenarios futuros con base en el escenario actual. En el rango de 60-70 se cultiva el chile.
In the climatic scenarios 2050 and 2070, the decrease in the surface with suitable temperatures for the development of the chili crop in the three states mentioned above will continue, only in the state of Chihuahua there is a trend of increase in the surface with temperatures for the development of this crop in scenarios 2030, 2050 and 2070 (Figures 4a-d). Figure 5 presents the maps with the percentage of the number of hours with nocturnal temperature greater than the upper threshold for the optimal development of chili (>18 °C), in the April-October crop cycle in the north central region. chili cultivation is mainly planted in areas that have between 10 and 20% (gray color) and 20-30% (pink) of the total number of hours in the agricultural cycle (Figure 5a).
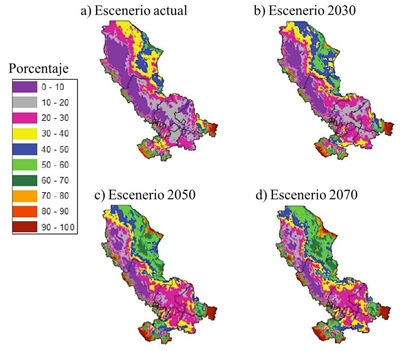
Figure 5 Percentage of the number of hours with night temperatures over 18 °C (upper threshold for chili development) in the April-October crop cycle, in the current scenario and in three future climatic scenarios of RCP 4.5, in the producing region of dry chili in Mexico.
Considering the surface of the current scenario as 100%, in Figure 5b there is a decrease of the surface with percentage of 10 to 20 and increase of the surface of 20 to 30%, mainly in the states of Zacatecas, San Luis Potosí, Aguascalientes and Guanajuato, which means there will be more hours outside the upper night temperature threshold. In the states of Chihuahua and Durango, the percentage of hours will increase (Table 8). In climatic scenarios 2050 and 2070, the increase in hours of non-optimal night temperature for the development of chili will continue (Figures 5c and 5d).
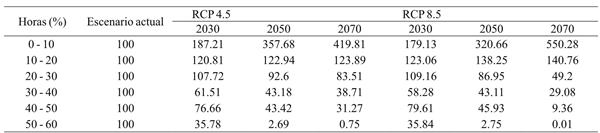
The behavior of the nocturnal temperature in the future implies that there will not be a good floral differentiation leading to a lower number of fruits per plant (Bosland and Votava, 2000). Table 4 shows the percentage of the number of hours with optimum temperature for the development of chili (18 to 28 °C) in the April-October crop cycle. The cultivation of chili is mainly planted in areas that have between 40 and 50% of the total number of hours in the agricultural cycle.
Table 4 Percentage of the number of hours with temperature from 18 to 28 °C in the April-October cycle and its percentage in future climatic scenarios in the North-Central region.
Porcentaje de los escenarios futuros con base en el escenario actual. En el rango de 40-50 se cultiva el chile.
The surface with this range will increase with respect to the current scenario in 15.88 and 15.8% in climatologies 2050 and 2070, respectively, in RCP 4.5. This increase means a greater number of hours with optimal temperature for the development of chili (Medina and Mena, 2016), since this crop originates in tropical and subtropical regions and requires warm temperature conditions for optimal development (Madhavi et al., 2016).
As for the percentage of the number of hours above the upper threshold (32 °C), chili is mainly cultivated in areas that have between 0 and 10% of the total number of hours in the growing cycle, this area will decrease to 47.12% in climatology 2070 of RCP 4.5 and increase it from 10 to 20% to 21.95% in the same climatology, i.e., higher number of hours with high temperature stress (Table 5). There are reports that temperatures above 30 °C have a great effect on pollen formation and their viability leading to sterility (Cochran, 1938, Gunawardena and De Silva, 2014).
Table 5 Percentage of the number of hours with temperature >32 °C in the April-October cycle and its percentage in future climatic scenarios in the North-Central region.
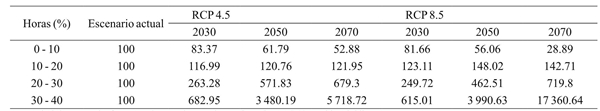
Porcentaje de los escenarios futuros con base en el escenario actual. En el rango 0-10 se cultiva el chile.
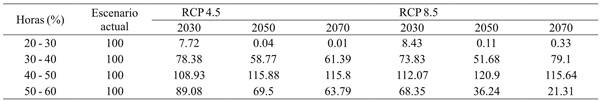
As regards the lower temperature threshold (15 °C), this crop is mainly grown in regions with 20 to 40% of the total number of hours in the growing cycle. It will decrease the area from 20 to 30 and 30 to 40% to 61.29% in climatology 2070 of RCP 4.5 and increase from 10 to 20%, this indicates that there will be fewer hours below this threshold (Table 6), this will be favorable for chili cultivation, since temperatures below 15 °C affect a variety of physiological functions, growth is normally delayed and yield is reduced (Mercado et al., 1997; Gunawardena and De Silva, 2014).
Table 6 Percentage of the number of hours with temperature <15 °C in the April-October cycle and its percentage in future climatic scenarios in the North-Central region.
Porcentaje de los escenarios futuros con base en el escenario actual. En el rango de 20-30 y 30-40 se cultiva el chile.
In terms of night temperature, chili is cultivated mainly in regions with a percentage between 10 and 30% of hours with night temperatures within the optimum range (15 to 17.5 °C), it will decrease the surface area from 10 to 20% to 59.92 % in the climatology 2070 and its place will take the range of 20 to 30% that, although it will decrease 8.21% in the climatology 2070 in RCP 4.5, will be in the areas where chili is currently cultivated, this means that those areas will have a greater number of hours with optimal night temperature (Table 7).
Table 7. Percentage of the number of hours with a night temperature of 15 to 17.5 °C in the April-October cycle and its percentaje in future climatic scenarios in the North-Central region.
Porcentaje de los escenarios futuros con base en el escenario actual. En el rango 10-20 y 20-30 se cultiva el chile.
For the upper threshold of night temperature (18 °C), it was found that where chili is grown it has between 10 and 30% of hours with temperature above the threshold, in the future, the area of the range of 10 to 20% will decrease until in 58.53% in climatology 2070 and increase in the range of 20 to 30%, up to 10.23% in climatology 2070, in RCP 4.5 (Table 8), the behavior of the night temperature in the future implies that there will be no good floral differentiation leading to a lower number of fruits per plant (Bosland and Votava, 2000).
Table 8 Percentage of the number of hours with night temperatures over 18 °C in the April-October cycle and their percentage in future climatic scenarios in the North-Central region.
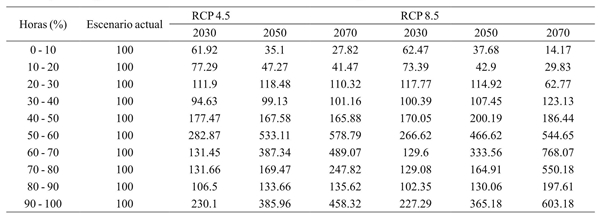
Porcentaje de los escenarios futuros con base en el escenario actual. En el rango 10-20 y 20-30 se cultiva el chile
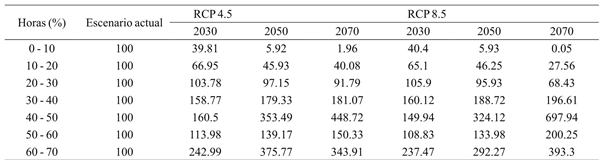
Finally, where chili is grown, it has between 10 and 30% of hours with night temperature below the lower threshold (10 °C); according to future climatic scenarios, will decrease the surface with the number of hours of the range of 10 to 20% and will mainly decrease the surface of the range of 20 to 30% to 55.16% in the climatology 2070 of RCP 4.5, which indicates that in areas where chili is cultivated there will be fewer hours with nocturnal temperature below the lower threshold (Table 9), which indicates that there will be fewer hours at night below the lower threshold, which implies that the crop will have greater pollen production and viability (Shaked et al., 2004).
Table 9 Percentage of the number of hours with a night temperature less than 10 °C in the April-October cycle and its percentage in the future climatic scenarios in the North-Central region.
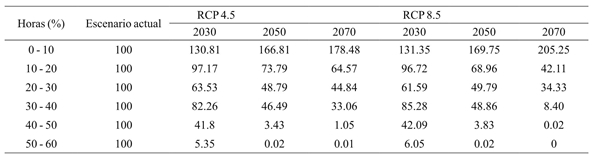
Porcentaje de los escenarios futuros con base en el escenario actual. En el rango 10-20 y 20-30 se cultiva el chile.
The observed trends of increasing or decreasing surfaces of different temperature ranges in RCP 4.5 are also observed in RCP 8.5 but in a more pronounced manner. This is because RCP 4.5 is a scenario with intermediate GHG emissions, while RCP 8.5 is a scenario with high GHG emissions, which will lead to a further rise in global temperature (van Vuuren et al., 2011).
The effect of global warming in the three future climatic scenarios studied is observed in two different ways, on the one hand it will favor the cultivation of chili with an increase in surface area (22.6%) with hourly temperature within the development thresholds (15 to 32 °C) and growth (15.8%) within the optimum temperature range (18 to 28 C), but limited by the increase (20.8%) of the surface with hourly temperature higher than the upper threshold (32 °C) and higher a (18.5%) of the surface with hourly nighttime temperature greater than the upper threshold of night temperature (18 °C).
All this in RCP 4.5 and in the 2050 climatology, high temperature stress is an important environmental stress that limits plant growth, metabolism and productivity (Hasanuzzaman et al., 2013), which will affect the decrease of the yield due to the negative effect on the processes of pollination and fruit binding (Bradley et al., 1999; Peñuelas and Filella, 2001). This last effect is undoubtedly the one that will predominate, since even though there are more hours with favorable temperatures, the damage caused by the increase in hours with high temperature stress is irreversible once it has occurred (Taiz and Zeiger, 2006).
Conclussions
A favorable effect of the atmospheric warming in the historical period 1981-2010 in the central-north of Mexico is observed, as the number of hours within the range of cardinal temperatures increases, which are favorable for the development of chili, in the same way a decrease in the number hours below the lower temperature threshold and night temperature.
In the same historical period, there has been an unfavorable effect of increasing the number of hours with temperature above the upper temperature threshold and above the upper threshold of nocturnal temperature, which reduces pollination and increases the abortion of flowers and small fruits.
Considering the effects of global warming on future climatic scenarios in RCP 4.5 and 8.5, the area with percentage of hours with temperature within the optimum ranges of development is increasing towards the future, but limited by the increase of the surface with temperature hour higher than the optimal upper thresholds in the same scenarios, which will affect the yield decrease due to the negative effect on the pollination and fruit tie-down processes.
Areas with high chili yield potential in the states of Zacatecas, San Luis Potosí, Aguascalientes and Guanajuato will be more affected than those in the states of Durango and Chihuahua.
Literatura citada
AAloni, B.; Pressman, E. and Karni, L. 1999. The effect of fruit load, defoliation and night temperature on the morphology of pepper flowers and on fruit shape. Ann. Bot. 83:529-534. [ Links ]
Bakker, J. C. and van Uffelen, J. A. M. 1988. The effects of diurnal temperature regimes on growth and yield of sweet pepper. Netherlands J. Agric. Sci. 36:201-208. [ Links ]
Bosland, P. W. and Votava, E. J. 2000. Peppers: vegetable and spice Capsicums Crop Production Science in Horticulture 12 ..CAB International Publishing, Wallingford, England, UK. 204 p. [ Links ]
Bradley, N. L.; Leopold, A. C.; Ross, J. and Huffaker, W. 1999. Phenological changes reflect climate change in Wisconsin. Proceedings of the National Academy of Sciences of the United States of America 96:9701-9704. [ Links ]
Cochran, H. L. 1938. A morphological study of flower and seed development in pepper. J. Cochran Agric. Res. 56:395-417. [ Links ]
Erickson, A. N. and Markhart, A. H. 2001. Flower production, fruit set, and physiology of bell pepper during elevated temperature and vapor pressure deficit. J. Am. Soc. Hortic. Sci. 126(6):697-702. [ Links ]
Evans, L. T. 1993. Crop evolution, adaptation and yield. Cambridge. University Press. 71 p. [ Links ]
Fritz, J. O.; Vanderlip, R. L.; Heiniger, R. W. and Abelhalim, A. Z. 1997. Simulating forage sorghum yields with SORKAM. Agron. J. 89:64-68. [ Links ]
Gunawardena, M. D. M. and De Silva, C. S. 2015. Identifying the impact of temperature and water stress on growth and yield parameters of chilli (Capsicum annuum L.). OUSL J. 7:25-42. [ Links ]
Hasanuzzaman, M.; Nahar, K.; Alam, M. M.; Roychowdhury, R. and Fujita, M. 2013. Int. J. Mol. Sci. 14:9643-9684. [ Links ]
IPCC (Intergovernmental Panel on Climate Change). 2014. Climate Change 2014: synthesis report. Contribution of Working Groups I, II and III to the Fifth Assessment Report of the Intergovernmental Panel on Climate Change [Core Writing Team, R.; Pachauri, K. and Meyer, L. A. (Eds.)]. IPCC, Geneva, Switzerland, 151 p. [ Links ]
Laborde, C. J. A. y Pozo, C. O. 1984. Presente y pasado del chile en México. Instituto Nacional de Investigaciones Agrícolas (INIA). México. Publicación especial núm. 85. 80 p. [ Links ]
Long, S. J. 1982. Presente y pasado del chile en México. SARH-INIA. México, D. F. 8(8):48- 49. [ Links ]
Madhavi, R. K.; Shivashankara, K. S.; Geetha, G. A. and Pavithra, K. C. 2016. Capsicum (hot pepper and bell pepper). In: Srinivasa, N. K.; Shivashankara, K. S. and Laxman, R. H. (Eds.) Abiotic stress physiology of horticultural crops. Springer India. 151-166 pp. [ Links ]
Medina, G. G. y Mena C. J. 2016. Cambio climático y sus efectos en la producción de chile en el norte-centro de México. In: Sexto foro para productores de chile. Zacatecas, México. 1-15 pp. [ Links ]
Mercado, J. A.; Reid, M. S.; Valpuesta, V. and Quesada, M. A. 1997. Metabolic changes and susceptibility to chilling stress in Capsicum annuum plants grown at suboptimal temperature. Functional Plant Biol. 24(6):759-767. [ Links ]
Muñoz, F. I. y Pinto, C. B. 1970. Taxonomía y distribución geográfica de los chiles cultivados en México. Revista el Campo Núm. 15. INIA-SAG. México. 3-12 pp. [ Links ]
Olareweju, J. D. 1988. Effect of night temperature on fruit set and development in sweet pepper (Capsicum annuum L.). Haryana J. Hortic. Sci. 18:285-288. [ Links ]
Peñuelas, J. and Filella, I. 2001. Phenology: responses to a warming world. Science. 294(5543):793-795. [ Links ]
Pozo, C. O. 1981. Descripción de tipos y cultivares de chile (Capsicum spp.) en México. Folleto técnico número 77. INIA-SARH. 40 p. [ Links ]
Rylski, I. and Spigelman, M. 1982. Effects of different diurnal temperature combinations on fruit-set of sweet pepper. Sci. Hortic. 17:101-106. [ Links ]
Ruiz-Corral, J. A.; Medina-García, G.; Rodríguez-Moreno, V. M.; Sánchez-González, J. J.; Villavicencio, G. R.; Durán, P. N.; Grageda, G. J. y García, R. J. E. 2016. Regionalización del cambio climático en México. Rev. Mex. Cienc. Agríc. Pub. Esp. Núm. 13:2451-2464. [ Links ]
Saha, S. R.; Hossain, M. M.; Rahman, M. M.; Kuo, C. G. and Abdullah, S. 2010. Effect of high temperature stress on the performance of twelve sweet pepper genotypes. Bangladesh J. Agric. Res. 35(3):525-534. [ Links ]
Sanders, D. C.; Kirk, H. J. and Van der Brink, C. 1980. Growing degree days in North Carolina. AG-236. North Carolina Agricultural Extension Service, Raleigh. [ Links ]
Shaked, R.; Rosenfeld, K. and Pressman, E. 2004. The effect of low night temperatures on carbohydrates metabolism in developing pollen grains of pepper in relation to their number and functioning. Sci. Hortic. 102:29-36. [ Links ]
SIACON (Sistema de Información Agropecuaria de Consulta) 1980-2014. SAGARPA. 2015. México, D. F. http://www.siap.gob.mx/siacon. [ Links ]
Snyder, R. L. 1985. Hand calculating degree-days. Agric. For. Meteorol. 35:353-358. [ Links ]
Taiz, L. and Zeiger, E. 2006 Plant physiology. Fourth edition. Sinauer Associates. Sunderland, MA. 764 p. [ Links ]
Van Vuuren, D. P.; Edmonds, J.; Kainuma, M.; Riahi, K.; Thomson, A.; Hibbard, K.; Hurtt, G. C.; Kram, T.; Krey, V.; Lamarque, J. F. and Masui, T. 2011. The representative concentration pathways: an overview. Climatic Change. 109(1):5-31. [ Links ]
Walton, D.; Meyerson J. and Neelin J. D. 2013. Accessing, Downloading, and Viewing CMIP5 Data. Earth System Grid Federation. 25 p. [ Links ]
Received: October 2017; Accepted: December 2017
 Este es un artículo publicado en acceso abierto bajo una licencia Creative Commons
