


Serviços Personalizados
Journal
Artigo
 texto em
  Inglês (pdf)
 Artigo em XML
 Referências do artigo
 Enviar este artigo por email
Indicadores
-
 Citado por SciELO
 -
 Acessos
Links relacionados
-
 Similares em
SciELO
Similares em
SciELO
Compartilhar

 Permalink
Revista mexicana de ciencias agrícolas
versão impressa ISSN 2007-0934
Rev. Mex. Cienc. Agríc vol.8 no.7 Texcoco Set./Nov. 2017
Articles
Application of remote sensing technologies for estimating sugarcane yield
1Posgrado en Hidrociencias-Colegio de Postgraduados. Campus Montecillo, Texcoco. Estado de México, México. CP. 56230. Tel. 01 (595) 9520200, ext. 1172. (epalacio@colpos.mx; tijerina@colpos.mx; mhector@colpos.mx).
The sugarcane producers are constantly looking to reduce costs, increase productivity and yield. On the other hand, the prediction of the yield of the crops for a better planning of agricultural policies and food security in a globalized market economy is very important. The present investigation was carried out in the area of supply of Sugarmill Emiliano Zapata, in the state of Morelos, in an area of 10 664 ha, during the agricultural cycle 2009-2010. The objective of the study was to calibrate a methodology to estimate the yield of sugarcane (Saccharum officinarum) based on the temporal analysis of vegetation indices of normalized differences (NDVI) and moisture stress indexes (MSI) obtained from Landsat- 7 ETM+ and crop evapotranspiration (ETc) estimated by calculating the variable Kc as a function of NDVI indexes and using reference evapotranspiration (ETo) obtained from meteorological stations. As a result of the study, relationships between the average values of the indices and the ETc were obtained, with the yield measured in the field in 23 control plots; with an R2 being 0.92, 0.77 and 0.85, respectively. From the best fit model, we estimated the average yield for the study area of 114.3 t ha-1. The Secretariat of Agriculture Fisheries and Food; through the Agro-Food and Fisheries Information Service (SIAP), reported an average yield in Morelos for the year 2009 of 115.4 t ha-1. This allows to know the effectiveness of the estimates made.
Keywords: evapotranspiration; Landsat-7 ETM+; vegetation index; water stress
Los productores de caña de azúcar buscan en forma constante reducir costos, aumentar la productividad y el rendimiento. Por otra parte, toma gran importancia la predicción del rendimiento de los cultivos para una mejor planificación de políticas agrícolas y de seguridad alimentaria en una economía de mercado globalizado. La presente investigación se llevó a cabo en la zona de abasto del Ingenio Emiliano Zapata, en el estado de Morelos, en una superficie de 10 664 ha, durante el ciclo agrícola 2009-2010. El objetivo del estudio fue calibrar una metodología para estimar el rendimiento de caña de azúcar (Saccharum officinarum) con base en el análisis temporal de índices de vegetación de diferencias normalizadas (NDVI) e índices de estrés de humedad (MSI) obtenidos de imágenes Landsat-7 ETM+ y la evapotranspiración del cultivo (ETc) estimada calculando la variable Kc en función de índices NDVI y utilizando la evapotranspiración de referencia (ETo) obtenida de estaciones meteorológicas. Como resultado del estudio se obtuvieron relaciones entre los valores promedio de los índices y la ETc, con el rendimiento medido en campo en 23 parcelas de control; observándose una R2 de 0.92, 0.77 y 0.85, respectivamente. A partir del modelo de mejor ajuste, se estimó el rendimiento promedio para la zona de estudio de 114.3 t ha-1. La Secretaría de Agricultura Pesca y Alimentación; a través, del Servicio de Información Agroalimentaria y Pesquera (SIAP), reportó un rendimiento promedio en Morelos para el año 2009 de 115.4 t ha-1. Lo que permite conocer la efectividad de las estimaciones realizadas.
Palabras claves: estrés hídrico; evapotranspiración; índices de vegetación; Landsat-7 ETM+
Introduction
The sugarcane, Saccharum officinarum, is a perennial stem-shaped plant that is cultivated in the tropical and subtropical regions of the world (currently cultivated in 105 countries) between latitudes 37° N and 31° S, mainly because of its capacity to store large quantities of sucrose (10-18%) in the internodes, depending on the variety and the agroclimatic conditions as limiting factors for their growth, besides the stage of development (plant, soca or resoca), soil, fertilization, and other factors such as climate, temperature, pests, weeds, diseases and water availability, are directly related to crop productivity (Inman et al., 2005; Abdel et al., 2008).
Currently, the evaluation of the production level of sugar cane is done after each harvest and by performance estimates prior to harvesting, based on experience of technical -through field observations and data using statistical sampling previous yearswithout considering the spatial distribution of the planted area and its variability to various environmental factors, which results in errors in the production estimates, mainly in agricultural areas of great heterogeneity (Aguilar et al., 2010).
The first step in estimating, optimizing the production, transport and use of biomass resources is to know the potential of agricultural land to produce sugar cane. However, measurements on the ground are not made with enough detail for the spatial distribution, being preferred to make estimates of production by statistical analysis (Krishna, 2002; Fortes, 2006).
Recent advances in precision agriculture (AP, for its acronym in Spanish) and land cover mapping may make it possible to monitor and estimate the status of sugarcane cultivation in a region determined at the farm or production unit level, due to the low acquisition cost of images, their spatial coverage and the possibility of generating indices of their spectral bands (Zhang and Anderson, 2005).
In this sense, geographic information systems (SIG, for its acronym in Spanish) and remote sensing (PR, for its acronym in Spanish) provide the possibility of spatially linking different sources of information, and from the analysis of the images generated by remote sensors, it is possible to obtain information about the characteristics of the vegetal coverings, using different techniques of image processing; including the calculation of vegetation indices based on reflectivity values at different wavelengths, which allow the estimation of the behavior of several biophysical parameters of the crops (Hatfield, 2008).
Therefore, the PR presents a synoptic view of the agricultural zones and allows a temporal monitoring of the phenological development of the crops, especially in the processes related to the identification and monitoring of large agricultural areas, estimation of production, detection of diseases and stress, through the analysis of the spatial distribution, the mapping of the diverse productive zones, sampling direction and observation in the field, promoting a greater evaluation of the productive potential of the planted areas (Rudorff and Batista, 1990; Soria, 2004; Ueno et al., 2005).
There are several methodologies for estimating water stress, irrigation uniformity and crop yields, using satellite images, such as the Moisture Stress Index (MSI), Rock et al. (1986), and the normalized difference vegetation index (NDVI), Rouse et al. (1974).
The objective of the present study was to calibrate a methodology to measure physiological variables of the cultivation of sugar cane; such as the NDVI, MSI and ETc index, to estimate yield using Landsat 7 ETM+ image information analysis techniques in sugarcane cultivation.
Materials and methods
The study was carried out in the supply area of the sugarmill Emiliano Zapata, in the state of Morelos. The reason lies in the fact that this state is located within the first places as producer of sugar cane, under irrigation and temporary conditions. According to SIG data from the mill, a total of 10 664 ha was established during the 2009-2010 agricultural cycle; however, its area of influence covers around 19 735 ha, distributed mainly in the municipalities of Tlaltizapan, Jojutla, Ayala, Tlaquiltenango, Puente of Ixtla, Xochitepec and Zacatepec. This zone is located at an average height of 1 480 msnm and its extreme geographical coordinates are: 18º 20’ to 19º 08’ north latitude and 98º 38’ to 99º 30’ west longitude.
The predominant types of soils are: Vertisols, Castañozem and Litosols. The climate is of the type BS1(h’)w warm semi-dry, with rains in summer and winter not defined, with the greatest drought at the end of autumn, winter and early spring, García (1988). The mean annual precipitation and temperature is 900 mm and 24 °C, respectively (Figure 1).

Figure 1 Monthly distribution of temperature and precipitation at the INIFAP station, Zacatepec de Hidalgo, Morelos.
The materials used were: a GPS (global positioning system), desktop computers and camera. We used 30 images of Landsat 7 ETM + satellite from October 21, 2008 to June 21, 2010, which were obtained from the website: Global View of USGS Viewer of http://glovis.usgs.gov/. The images consist of eight bands with a spatial resolution of 30 m for the six reflective bands (1 to 5 and 7), 15 m for the panchromatic band (8) and 60 m for the thermal band (6); which were corrected geographically using the WGS84 coordinate system and the mercury transverse projection (UTM zone 14 North). The software used for image processing was IDRISI® by Clark Labs (2006) and ERDAS® by Leica Geosystems (2008), as well as the software for atmospheric correction developed by Palacios (2007) and for the calculation of average values of indices of vegetation in plots called EStadParcelas.exe. For the trial, 23 control plots with sugarcane cultivation were chosen, which are located in the supply area of sugarmill (Figure 2).

In addition, daily agrometeorological information (the same period in which the satellite images were acquired) was available from the INIFAP station available on the Web at: (www.clima.inifap.gob.mx), which is part of the network of agroclimatic stations in Morelos and is located at a height of 910 meters at the coordinates 18º 39’ north latitude and 99º 12’ west longitude, at the INIFAP Experimental Field, in Zacatepec, Hidalgo, Morelos.
Methodology
In order to relate biophysical parameters to the development of sugarcane cultivation and its productivity, 23 control plots were selected in the supply area of sugarmill Emiliano Zapata, where monitoring of the crop was carried out by the field supervisors of wit; information was also obtained (from the GIS area of the sugarmill) on the date of sowing, variety, yield, etc (Table 1).

It is noteworthy that performance is often measured in terms of the heavy amount of sugar cane delivered to the mill scale. Measurements were made in the 2009-2010 agricultural cycle; usually cane is harvested from mid-november to the beginning of may.
For this study 30 Landsat satellite images 7ETM+ dated 06 November 2008 at May 4, 2010 (period covered by the different stages of crop development) were obtained, which were processed as already mentioned.
Using the IDRISI® program, the values of NDVI, Rouse et al. (1974), as well as those of MSI, Rock et al. (ρr) (0.6 to 0.7 μm), near infrared (ρi) (0.7 to 1.8 μm) and medium infrared (ρim) (1.8 to 8 μm), whose values are obtained from the reflectances. Formulas for their calculation are:
Subsequently, the average value of both indices was calculated within the 23 control plots. For this, the software “EstadParcelas.exe” was used, which allows to calculate the average value of all the pixels located within the limits of a particular plot, defined by its vectors or “shapes”).
Likewise, the evapotranspiration of the ETc crop, according to what was proposed by Allen et al. (2006), including the estimate of Kc (development coefficient of the crop) as a function of NDVI, as proposed by Calera and González (2007), whose formula for estimation, valid mainly for annual crops, is:
The ETo reference evapotranspiration was obtained from the INIFAP agrometeorological station, which is estimated using the Penman-Monteith formula, which corresponds to the accumulated daily value in the period between Landsat dates. As a result, it was possible to calculate the ETc variable roughly, with:
Results and discussion
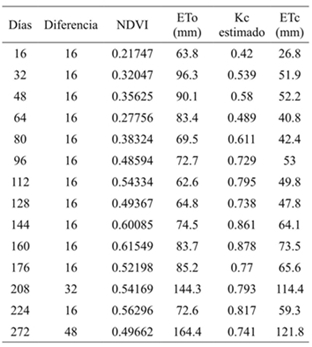
From the relations between Kc and NDVI in the 2009-2010 crop cycle, the water requirement of sugarcane in the study plots was estimated by ecuation 3 and 4. As a reference in Table 2, the results of the estimates made in the plot with account number 12 026 are shown. From this, a cumulative value for the ETc of 863.5 mm is obtained. It should be mentioned that these functions were validated in Mexico by Palacios et al. (2011), in the Río Mayo irrigation district.
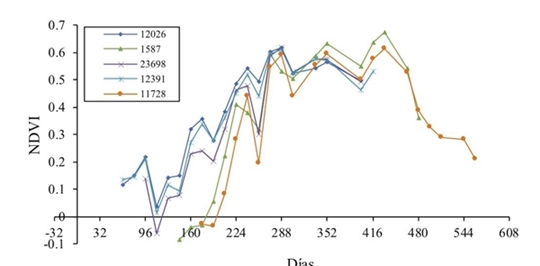
In the Figure 3, the variation of NDVI values obtained on average in five study plots is observed. NDVI values are recorded between -0.1 and 0.7, similar to those reported by authors such as Knop (2007); Rahman et al. (2004), for a green and fully developed canopy of sugar cane. It should be mentioned that the negative value is due to the condition of bare soil, when the plant does not yet emerge.
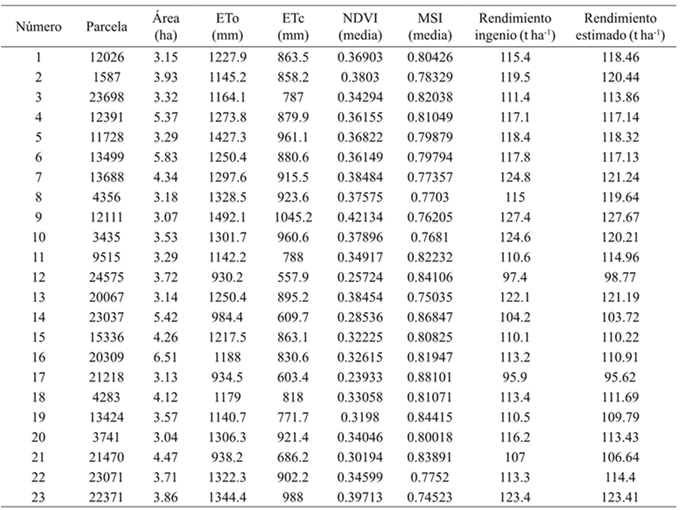
In each of the 23 control plots the average values of NDVI and MSI were calculated as indicators of productivity and irrigation effectiveness, in order to correlate the average values of the indices with the yields reported by the sugarmill. The results are shown in Table 3, which also includes crop evapotranspiration.
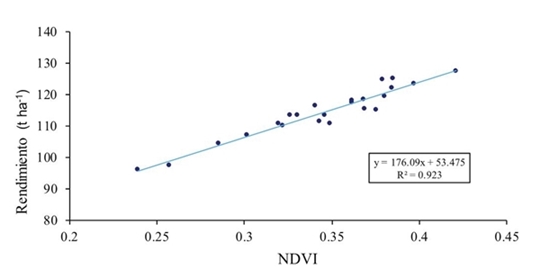
Using data from Table 3, the mean values of NDVI, MSI and ETc were obtained with the yield reported in each control plot, with an acceptable correlation between these variables. A study related to the estimation of productivity and biomass was carried out in Brazil by Simões et al. (2005), using field spectrometry, simulated equivalent bands of Landsat ETM+, demonstrating the high correlation between productivity and biomass with NDVI, reaching an R2 value of 0.88. In the case of Mexico have also obtained relationships of the same type for the cultivation of sugar cane in the Huasteca Potosina, Aguilar et al. (2010), reported that NDVI is useful as a diagnostic tool at a given time, and in a time series, to characterize the yield and productivity of the sugarcane crop.
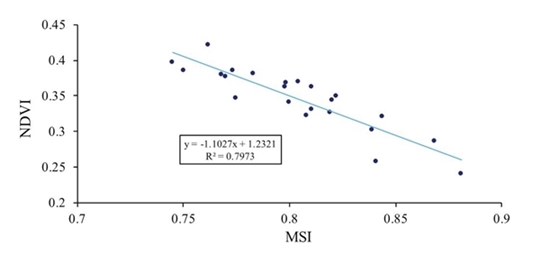
These relationships are shown in Figures 4 and 5 where it is seen that there is a direct relationship between the NDVI values and the yield values. Also, it is observed that the relationship between the MSI and the yield is not linear, as water stress increases, yield decreases.

Also follows that a reason for the variation of NDVI values is largely due to the effect of moisture stress, motivated by poor irrigation in the plots analyzed. For this, the MSI has been correlated with the NDVI and, as can be observed in Figure 6, there is a high correlation between these indexes.
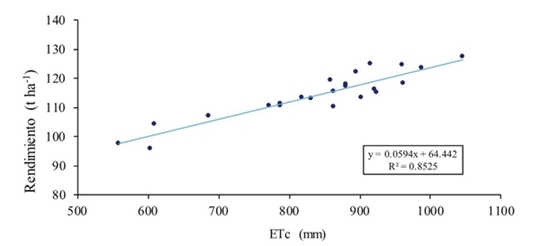
In the Figure 7 shows a direct linear relationship between ETc and yield, since as evapotranspiration increases, more photosynthesis and, consequently, more biomass and yield of sugarcane are expected. It was also found that the relationship between the MSI and the ETc is not linear, since the higher water stress less evapotranspiration of the crop, as shown in Figure 8.

Once the best fit model was obtained, it was estimated that the average yield in the study area was 114.3 t ha-1. The SAGARPA; (SIAP, 2009) indicated that the average yield of sugarcane reported in the field in the state of Morelos in the period 1998-2008 was 113.5 t ha-1 and particularly in the year 2009, of 115.4 t ha-1, reason why the results obtained are considered within a good range of estimation.
It should be mentioned that the value of the area harvested from sugar cane in the 2009-2010 cycle was 10 664 ha (sugarmill SIG database). They report for this area a production volume of 1 154 035 t, at the close of the harvest. This value, when compared to the estimate of the prediction model of 1 219 047 t, indicates that there was an overestimation of 5.3%, equivalent to 65 012 t, which allows to know the effectiveness of the estimates made in this study.
Conclusions
In the present work an estimation of yield of sugar cane has been obtained from linear models that require values of input data as NDVI vegetation index, moisture stress index (MSI) and crop evapotranspiration (ETc). A direct relationship between sugarcane yield and these indexes (estimated from Landsat 7 ETM + images) has been observed. Variations in the indices adequately reproduce changes in yield of sugarcane.
The combined use of satellite images with meteorological information and Geographic Information Systems (SIG), allows users of irrigation systems to estimate the water consumption of their crops, monitor vegetative development and estimate yields.
Finally, it is considered that the prediction of crop yields should be the beginning of a series of techniques to be developed, with great potential of application in the six sugarcane regions of the country. In this way, basic information is generated that can be applied in the planning and management of agricultural production in order to give answers to productivity and competitiveness
Literatura citada
Abdel-Rahman, E. M. and Ahmed, F. B. 2008. The application of remote sensing techniques to sugarcane (Saccharum spp. hybrid) production: a review of the literature. International Journal of Remote Sensing. 29(13): 3753-3767. [ Links ]
Aguilar, N.; Galindo, G.; Fortanelli, J. y Contreras, C. 2010. Índice normalizado de vegetación en caña de azúcar en la Huasteca Potosina . Avances en Investigación Agropecuaria. 14(2):49-65. [ Links ]
Allen, R. G.; Pereira, L. S.; Raes, D. y Smith, M. 2006. Evapotranspiración del cultivo: guía para la determinación de los requerimientos de agua de los cultivos. Estudio FAO, Riego y Drenaje. 56. Roma, Italia. 298 p. [ Links ]
Calera, B. A. y González, J. 2007. Parámetros biofísicos de la cubierta vegetal. Relaciones operativas para la obtención de mapas de estos parámetros de las imágenes de satélite. Grupo de Teledetección y SIG, IDR, UCLM. Documento de PLEIADeS. 194 p. [ Links ]
Fortes, C. 2006. Discrimination of sugarcane varieties using Landsat 7 ETM+ spectral data. International Journal of Remote Sensing. 27 (7): 395-412. [ Links ]
García, E. 1988. Modificaciones al sistema de clasificación climática de Köppen, para adaptarlo a las condiciones de la República Mexicana. 4ª ed. Instituto de Geografía. Universidad Nacional Autónoma de México (UNAM). México, D. F. 217 p. [ Links ]
Hatfield, J. L.; Gitelson, A. A.; Schepers, J. S. and Walthall, C. L. 2008. Application of spectral remote sensing for agronomic decisions. Agron. J. 100(3):117-131. [ Links ]
Inman-Bamber, N. G. and Smith, D. M. 2005. Water relations in sugarcane and response to waters deficits. Fields Crops Research. Australia. 92(2):185-202. [ Links ]
Knop, I. 2007. Precision agriculture options for the Australian sugarcane industry. AM SRDC Technical Report 3/2007, Sugar Research and Development Corporation. 124 p. [ Links ]
Krishna, R. P. V. 2002. Remote sensing: a technology for assessment of sugarcane crop acreage and yield. Sugar Tech. 4(3):97-101. [ Links ]
Palacios, S. L. A.; Paz, P. F.; Oropeza, M. J. L.; Figueroa, S. B.; Martínez, M. M.; Ortiz, S. C. A. y Exebio, G. A. 2006. Clasificador genérico de objetos en imágenes ETM+. Agrociencia. 40(5):613-626. [ Links ]
Palacios, V. E.; Palacios, S. J. E. y Palacios, S. L. A. 2011. Agricultura de riego asistida con satélites. Tecnología y Ciencias del Agua, antes Ingeniería Hidráulica en México. 2(2):69-81. [ Links ]
Rahman, M. R.; Islam, A. H. M. H. and Rahman, M. A. 2004. NDVI derived sugarcane area identification and crop condition assessment. Planplus. 1(2):1-12. [ Links ]
Rock, B. N.; Vogelmann, J. E.; Williams, D. L., Voglemann, A. F. and Hoshisaki, T. 1986. Remote Detection of Forest Damage. Bio Science. 36(7):439-445. [ Links ]
Rouse, J. W.; Haas, R. H.; Schell, J. A. and Deering, D. W. 1974. Monitoring vegetation systems in the great plains with ERTS. Third ERTS Symposium, NASA SP-351. Washington, D. C. 1:309-317. [ Links ]
Rudorff, B. F. T. and Batista, G. T. 1990. Yield estimation of sugarcane based on agrometeorological-spectral models. Remote Sensing Environ. 33(3):183-192. [ Links ]
SIAP (Servicio de Información Agroalimentaria y Pesquera). 2010. Descripción de la cadena agroalimentaria de caña de azúcar.SIAP-SAGARPA. http://www.siap.sagarpa.gob.mx. [ Links ]
Simões, M. D. S.; Rocha, J. V. and Lamparelli, R. A. 2005. Spectral variables, growth analysis and yield of sugarcane. Scientia Agricola (Piracicaba, Brazil). 62(3):199-207. [ Links ]
Soria, R. J. 2004. Methodology for prediction of corn yield using remote sensing satellite data in Central Mexico. Investigaciones Geog. 55:61-78. [ Links ]
Ueno, M.; Kawamitsu, Y.; Sun, L. and Maeda, K. 2005. Combined applications of NIR, RS, and GIS for sustainable sugarcane production. Sugarcane Inter. 23(4):8-11. [ Links ]
Zhang, P. and Anderson, B. 2005. Potential monitoring of crop production using a satellite-based Climate-Variability Impact Index. Agric. Forest Meteorol. 132(3):344-358. [ Links ]
Received: July 01, 2017; Accepted: September 01, 2017
 Este es un artículo publicado en acceso abierto bajo una licencia Creative Commons
