


Serviços Personalizados
Journal
Artigo
 texto em
  Inglês (pdf)
 Artigo em XML
 Referências do artigo
 Enviar este artigo por email
Indicadores
-
 Citado por SciELO
 -
 Acessos
Links relacionados
-
 Similares em
SciELO
Similares em
SciELO
Compartilhar

 Permalink
Revista mexicana de ciencias agrícolas
versão impressa ISSN 2007-0934
Rev. Mex. Cienc. Agríc vol.8 no.7 Texcoco Set./Nov. 2017
Articles
Response of 10 maize cultivars to population density in three localities of the mexiquense center
1Posgrado en Ciencias Agropecuarias y Recursos Naturales. Universidad Autónoma del Estado de México (UAEMéx). Campus Universitario “El Cerrillo”. El Cerrillo Piedras Blancas, municipio de Toluca, Estado de México (CPB-TEM). AP 435. Tel. 01 (722) 2965574.
2Centro de Investigación y Estudios Avanzados en Fitomejoramiento. Facultad de Ciencias Agrícolas de la UAEMéx. CPB-TEM. AP. Tel. 01(722) 2965518, ext. 148. (denomox@yahoo.com; agonzalezh@uaemex.mx; mrubia@uaemex.mx; fgutierrezr@uaemex.mx; jframirezd@uaemex.mx).
The population density is one of the main factors that contribute to increase grain yield in maize. The present work was established in 2013 in three localities of the center of the State of Mexico, Mexico to evaluate the yield of grain and its main components in ten maize cultivars in three population densities. The three trials were established in the field in an experimental design of complete random blocks with three replicates in a divided plot arrangement: in the large plots the population densities were distributed and in the girls the cultivars. There were significant differences (p= 0.01) between cultivars in the 13 variables recorded, in population density, as were ear length, ear diameter, “olote” weight, grain weight per plant, and grain yield. An increase in population density decreased the number and weight of grain per plant but at 104 167 plants ha-1 the yield was 10.03 t ha-1. The highest grain yield (10 t ha-1) was obtained with P204W, but this did not differ statistically from IC 2010, ASMJ9082, H-40 and AS-723 The main components analysis explained 65.94% of the original total variation, in which a high correlation was observed between grain yield, grains per plant, prolificacy index and “olote” weight.
Keywords: Zea mays L. multivariate analysis; outstanding variests; plants ha-1; High Valleys of Central Mexico
La densidad de población es uno de los principales factores que contribuyen a incrementar el rendimiento de grano en maíz. El presente trabajo se estableció en 2013 en tres localidades del centro del Estado de México, México para evaluar el rendimiento de grano y sus componentes principales en diez cultivares de maíz en tres densidades de población. Los tres ensayos se establecieron en campo en un diseño experimental de bloques completos al azar con tres repeticiones en un arreglo de parcelas divididas: en las parcelas grandes se distribuyeron las densidades de población y en las chicas los cultivares. Hubo diferencias significativas (p= 0.01) entre cultivares en las 13 variables registradas, en densidad de población éstas lo fueron en longitud de mazorca, diámetro de mazorca, peso de olote, peso de grano por planta, y rendimiento de grano. Un incremento en la densidad de población disminuyó el número y el peso de grano por planta pero a 104 167 plantas ha-1 el rendimiento fue de10.03 t ha-1. Con P204W se obtuvo la mayor producción de grano (10 t ha-1), pero éste no difirió estadísticamente de IC 2010, AS-MJ9082, H-40 y AS-723. El análisis de componentes principales explicó 65.94% de la variación total original, en éste se observó una alta correlación entre rendimiento de grano, granos por planta, índice de prolificidad y peso de olote.
Palabras clave: Zea mays L. análisis multivariado; plantas ha-1; variedades sobresalientes; Valles Altos de México
Introduction
Maize cultivation is one of the most important crops in The maize (Zea mays L.) is the most important crop in México, its grain is produced in spring-summer and autumn-winter in temporary, irrigation tip and irrigation (SIAP, 2007). Almost 7.5 million ha are sown, representing 33% of the national agricultural area; the state of Mexico contributes with 7.1% of this and is one of the seven main entities that concentrate 64.5% of the total production. It has been estimated that its production potential is 52 million t, of which 28 million would be feasible to achieve in the short term with the use of suitable production technology, varieties and cultivation practices (Turrent, 2009).
The population density (D) is the most important management factor to achieve higher maize yields (Tollenar and Lee, 2011); an increase in D increases grain yield quadratically (Hashemi et al., 2005; Stanger and Lauer, 2006; Novacek et al., 2013; Novacek et al., 2014), but beyond the optimum it decreases due to higher sterility, fewer grains per ear and lower grain weight (Daynard and Muldoon, 1983; Tetio and Gardner, 1988; Hashemi and Herbert, 1992). The effect of D on yield depends on the potential of the genetic material (Sarlangue et al., 2007). The high-D maize hybrids have been reported to produce more grain (Bavec and Bavec, 2002; Sangoi et al., 2002; Tollenaar and Lee, 2011). Due to the above, it is desirable to identify materials with outstanding agronomic characteristics in the High Valleys of the State of Mexico.
Material and methods
Description of the study área
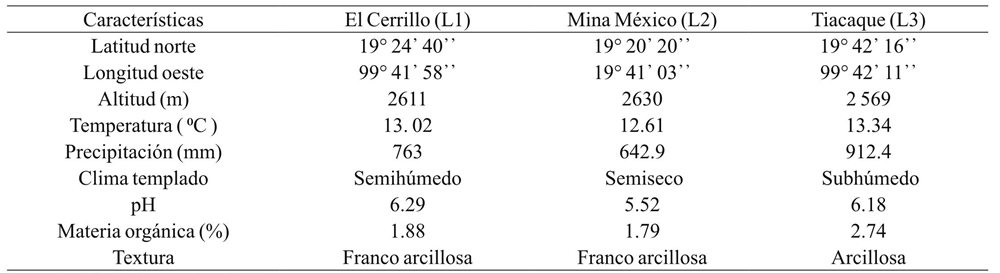
This work was established in spring-summer of 2013 in El Cerrillo Piedras Blancas (L1), Mina Mexico (L2) and Rancho Tiacaque (L3), belonging to the municipalities of Toluca, Almoloya of Juarez and Jocotitlan, respectively (Table 1).
Genetic material
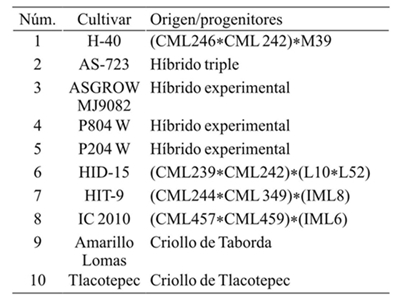
Ten maize cultivars recommended for commercial seeding were evaluated in the High Valleys of central Mexico; eight hybrids and two criollos collected in the Toluca- Atlacomulco region, in the state of Mexico. Only the genetic origin of four of the eight hybrids and of both creoles is known (Table 2).
Planting density
We considered 104 167 (D1), 78 125 (D2) and 62 500 (D3) plants ha-1, corresponding to spacings between plants 12, 16 and 20 cm, respectively.
Experimental design and plot size
A series of space experiments were used in a randomized complete block experimental design with three replicates per trial in a split plot arrangement; in the large plot the population densities (D) were assigned and in the girl the cultivars (C); the latter consisted of three rows of 6 m in length, separated by 0.8 m (14.4 m2).
Work description
The mechanical preparation of the soil consisted of fallow and two steps of drag. Manual seeding was performed on April 16, 18 and 30, 2013 in El Cerrillo (L1), Mina México (L2) and Tiacaque (L3), respectively. In L1 and L2 two irrigations were applied: 10 days before sowing and 13 April; in L3 was made on May 4. The 140N-90P-50K was used in the three localities. Phosphorus and potassium were applied when sowing, and nitrogen was fractionated: 50% at planting and 50% at second weeding. Urea (46%), triple calcium superphosphate (46%) and potassium chloride (60%) were used.
The weed was monitored with Gesaprin C90 (Atrazine: 6-Chloro-N 2 -ethyl-N 4 -isopropyl-1,3,5-triazine-2,4- diamine, 1.6 kg ha-1) and Hierbamine (2,4-D: Dimethylamine salt of 2,4-dichlorophenoxyacetic acid; 1.5 L ha-1), in L1 it was applied on may 22 and june 12, in L2 it was sprinkled on june 12 and in L3 it was made on june 2. Harvesting took place in january 2014 (L1) and 29 (L2) and 22 (L3) in December 2013.
Registered variables
At six plants selected with complete competition in the central furrow of the useful plot, heights of cob and plant were recorded (AM and AP, measured in cm from the soil to the insertion of the main ear or the ligule of the flag leaf), length (LM, measured in cm, in the middle), number of rows (NH), weights of “olote” and grain per plant (PO and PGP in g), grains per plant (NGP), grain volumetric weight (PVG, g L-1), prolificacy index (IP, corn-plant ratio recorded on the plot), and grain yield (RG, t ha-1). Both blooms (DFM and DFF) were determined with all plants of the useful plot. The procedures and measurement units used in data recording are described in CIMMYT (1995); González et al. (2008).
Statistical analysis
The analysis of variance, the comparison of means with the Tukey’s test (p= 0.05) and simple linear correlation analyzes were performed, the latter being a prerequisite for the use of the multivariate technique. The outputs were obtained with the system for statistical analysis (SAS, version for Windows 6.01).
The algebraic procedures were described by Martínez (1988). With the 10 cultivars and with the 13 variables, a principal components analysis was made. Before obtaining the biplot with SAS, the data were standardized and subjected to the decomposition of singular values in the manner suggested by Sánchez (1995). The biplot graph was compiled in Microsoft Excel ver. 1997-2003, with the scores of the first two major components (González et al., 2010).
Results and discussion
Variance analysis
The three localities caused significant phenotypic variability (p= 0.01) in both blooms (DFM and DFF), in both heights (AP and AM), in most dimensions of the cob (LM, NHM, PGP, NGP) and in grain yield (RG). In other studies, it has been documented that the Toluca-Atlacomulco Valley, in the state of México, is very heterogeneous in soils, temperatures, precipitation and incidence of frost and hail (Reynoso et al., 2014; Rodríguez et al., 2015; Franco et al., 2015).
These and other environmental components make it difficult to identify outstanding cultivars and experimental materials and cause confusion in the generation, application, validation and transfer of technology programs in producer fields. In this sense it is desirable to explore through years and localities for the selection of sites where it is possible to obtain higher grain yields per unit area, since most of the tests have been carried out in a few localities of a single year and have not it has been possible to identify materials that present minimal genotype*environment interaction and that show phenotypic stability (González et al., 2007; González et al., 2008; González et al., 2010).
The population density (D) is one of the technological factors that has contributed most to the increase of maize productivity; for each production system there is one that maximizes grain yield (Sangoi et al., 2002; Tollenaar and Lee, 2011). In a number of researches, the interrelation between PGP (Rossini et al., 2012; Van Roekel and Coulter, 2012; Manfield and Mumm, 2013; Antonieta et al., 2014), LM or PVG (Cervantes et al., 2015).
Currently in the center of the state of Mexico the commercial D for criollos and hybrids destined to the production of grain varies from 50 000 to 75 000 plants ha-1. In the previous context, D caused significant phenotypic variability in LM, cob diameter (DM), “olote” weight (PO), grain volumetric weight, PGP, NGP and RG (Table 3). The search for economically optimal D is desirable in order to optimize inputs and to reduce production costs in maize cultivation, but this type of work is scarce in this region (; Reynoso et al., 2014; Rodríguez et al., 2015). In other regions, it has been observed that the highest grain yield is obtained by sowing between 30 000 and 90 000 plants ha-1 (Sangoi et al., 2002; Tollenaar and Lee, 2002).
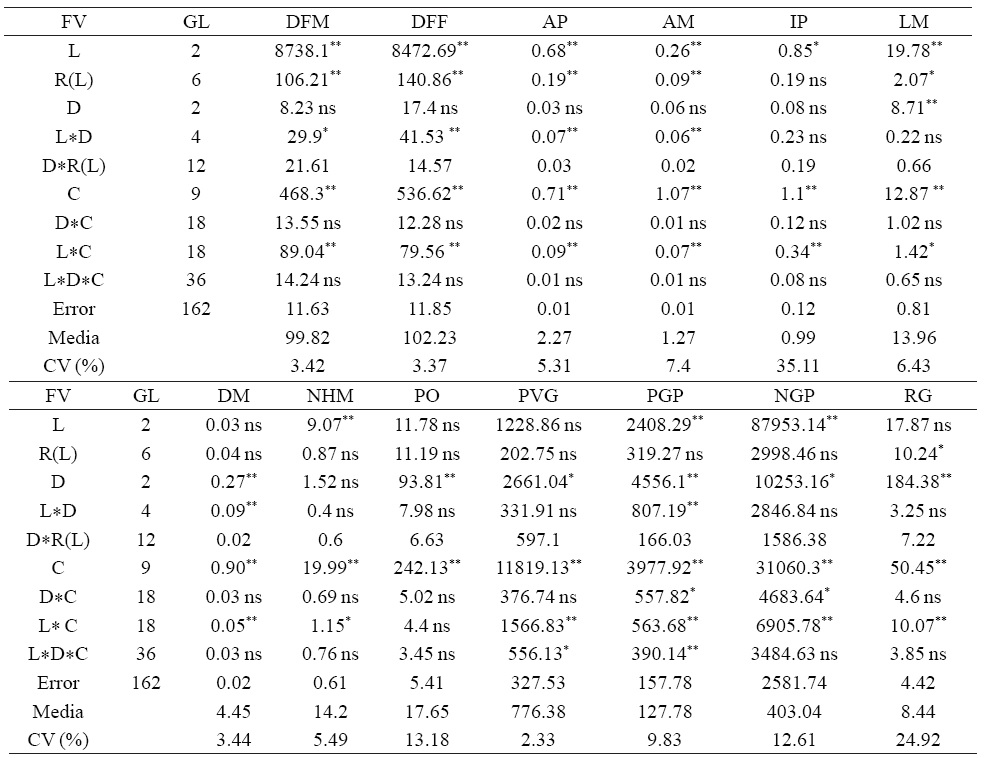
LM= longitud de mazorca; DM= diámetro de mazorca; NHM= número de hileras de la mazorca; PO= peso de olote; PVG= peso volumétrico del grano; PGP= peso de grano por planta; NGP= número de granos por planta; RG= rendimiento de grano; ns = no significativo; * y **= significativo al 0.05 y 0.01, respectivamente; L= localidad; R= repeticiones dentro de L; D= densidad de población, C= cultivares; FV= fuente de variación; GL= grados de libertad; CV= coeficiente de variación; DFM= floración masculina; DFF= floración femenina; AP= altura de planta; AM= altura de mazorca; IP= índice de prolificidad.
Table 3 Average squares and statistical significance of the values of F (continuación).
The maize cultivars showed highly significant differences (p= 0.01) in the 13 evaluated variables. This fact underlines the existence of wide diversity in the genetic material considered here (Table 3). In this region of High Valleys of Central Mexico, the diversity and genetic divergence that exists in the native and introduced maize of other geographic regions is related mainly to five races: Amarillo Arrocillo, Cacahuacintle, Cónico, Chalqueño and Toluqueño Palomero, although of these only Conical and Chalqueño predominate extensively.
Most hybrids from private companies or from some national research centers use CIMMYT germplasm, particularly from heterotopic groups A and B that include other types of breeds, which have contributed to increased genetic variability in maize (González et al., 2007; González et al., 2008; Reynoso et al., 2014).
Regarding the interactions between the three factors in the study, the most important were localities*cultivars (Table 3), since this caused significant phenotypic variability in 12 of the 13 variables analyzed. This type of variability is closely linked to genotype*environment interaction and to phenotypic stability studies. Rodríguez et al. (2005); González et al. (2010); Reynoso et al. (2014); Franco et al. (2015); Rodríguez et al. (2015), among others, commented that this interaction causes confusion in the estimation of genetic parameters, reduces the response to selection and makes it difficult to identify outstanding biological material
When there is interaction between localities*cultivars, it is desirable to give greater importance to maize with better adaptation to a specific environment for the purpose of increasing productivity (González et al., 2010; Rodríguez et al., 2015). Tollenaar and Lee (2011) commented that the increase in maize productivity in the United States, from 1.5 to 9.5 t ha-1 from 1930 to 2008.
This is attributed mainly to the improvements that have been achieved with plant breeding and in agronomic practices, release of hybrids with greater tolerance to stress, increased population density, increased use of inorganic fertilizers, practical improvements in weed control and earlier planting dates, among others, have been the main factors which have caused greater genetic gain.
The above facts suggest the replication of this type of studies in time and in space, because the environmental heterogeneity that affects the performance tests is one of the non-technological factors that also originate important phenotypic variability in the maize of the High Valleys of the Central Mexico.
Effect of localities
The grain production in the three localities was statistically similar: the averages for Cerrillo (L1), Tiacaque (L2) and Mina Mexico (L3) were 8.91, 8.38 and 8.02 t ha-1 (mean of 8.43 t ha-1). However, in L1, the highest values for both blooms and prolificacy index were recorded; in L2, the highest plant and ear height, ear length, number of rows of cob and weight of “olote” were recorded; in L3, the phenotypic expression of ear diameter, grain weight, grain weight per plant and number of grains per plant were more favored (Table 4).

Las medias con la misma letra dentro de cada columna son estadísticamente iguales (Tukey, p= 0.05). DFM= floración masculina; DFF= floración femenina; AP= altura de planta AM= altura a la mazorca; IP= índice de prolificidad; LM= longitud de mazorca; DM= diámetro de mazorca; NHM= número de hileras por mazorca; PO= peso de olote; PVG= peso volumétrico del grano; PGP= peso de grano por planta; NGP= número de granos por planta; RG= rendimiento de grano.
Table 4 Comparison between locations
However, this did not compensate for the differentiation in grain yield per hectare, perhaps because the moisture problems were compensated with risk of distress. In the year 2013 were registered 535, 827 and 455 mm of rain in L1, L2 and L3, respectively; 50, 39 and 34% occurred in pre-flowering and the rest in post-flowering.
The average temperatures for L1, L2 and L3 (13.9, 13.3 and 13.8 °C) and their maximums during the crop cycle were similar (28.2, 27.7 and 27.6 °C) (Figure 1). Although these values differ significantly from those shown in Table 1, rainfall deficits in two of the three localities were compensated with two rescue irrigations, so there were no moisture problems during the critical stages of growth and development of maize that contributed to a significant differentiation between test sites.
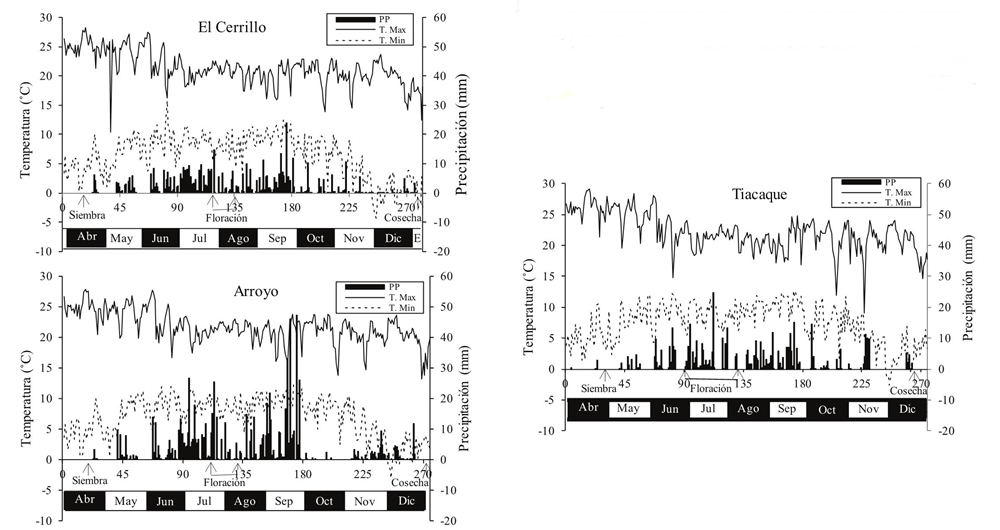
Figure 1 Precipitation and daily maximum and minimum temperatures during the crop growth cycle in El Cerrillo, Mina Mexico and Tiacaque. Arrows represent dates sowing, flowering and harvesting.
In the Table 1 also shows that the three localities differ in their geographic location, altitude, climate type, pH, texture and organic matter content, as confirmed by other authors (Torres et al., 2011; Franco et al., 2015) but its effect on grain yield at all three sites was not significant.
In other studies conducted in the Toluca-Atlacomulco Valley, in the State of Mexico, average grain yields were obtained for localities of 6.36, 5.96 and 8.23 t ha-1 (González et al., 2008; Reynoso et al., 2014; Rodríguez et al., 2015).
Density of population (D)
The increase in D did not lead to significant phenotypic variability in male and female blooms, in plant and ear heights, prolificacy index and number of rows of the ear, but in the rest of the variables, if there was one. The yields of grain at 62 500 (D1), 78 125 (D2), 104 161 (D3) plants ha-1 were 7.25, 8.03 and 10.03 t ha-1, the first two (difference of 15 625) differed significantly from third. Oyervides et al. (1990); Cervantes et al. (2015) observed that plant density modifies the phenotypic expression of flowering and plant height in maize lines.
Lashkari et al. (2011); Cervantes et al. (2015) found that ear length and ear diameter decrease as population density increases; differences were also reported in rows of the ear (Hashemi et al., 2005).
Cervantes et al. (2015) found no statistical differences at 90 000, 100 000 and 110 000 ha-1 plants. The number and weight of grain per plant decreased (Hasemi and Herbert, 1992; Sangoi et al., 2002; Rossini et al., 2012) and grain yield increased when population density increased (Van Roekel andCoulter, 2011; Antonietta et al., 2014; Cervantes et al. 2015). This is explained by the fact that over time, genetic improvement in maize has been able to increase the yield of grain per surface at high densities without changes or even reductions in NGP (Duvick, 1997). Recently released hybrids are highly dependent on population density and respond in a parabolic form when it increases beyond the optimum (Echarte et al., 2000; Sangoi et al., 2002; Sarlangue et al., 2007; Tollenaar y Lee, 2011). The RG increases to a maximum at which likely increases in plant numbers can markedly reduce yield (Andrade et al., 1996).
The highest averages in length, diameter, rows and weight of “olote” per cob, as well as in grain weights per plant (PGP) and volumetric and number of grains per plant were observed in D1 and this differs significantly from D3, except in PGP. However, this superiority was not reflected in higher grain yield (Table 5). The difference between D1 and D3 (2.78 t ha-1) is mainly explained by the greater number of plants (41 661).

Las medias con la misma letra dentro de cada columna son estadísticamente iguales (Tukey, p= 0.05). DFM= floración masculina; DFF= floración femenina; AP= altura de planta AM= altura a la mazorca; IP= índice de prolificidad; LM= longitud de mazorca; DM= diámetro de mazorca; NHM= número de hileras por mazorca; PO= peso de olote; PVG= peso volumétrico del grano; PGP= peso de grano por planta; NGP= número de granos por planta; RG= rendimiento de grano.
Table 5 Comparison between population densities.
This value compensated for the decrease in the primary components of yield caused by increased competition for light, water, space and nutrients, which was manifested to 104 161 plants ha-1. The use of high plant densities causes a decrease in grain yield per plant and in the dimensions of the cob because it stimulates apical dominance, induces female sterility and decreases the number of grains per cob and cobs ha-1 (Sangoi et al., 2002).
Rodríguez et al. (2015) evaluated the effects that caused five population densities in eight maize cultivars planted in three locations in the Toluca Valley in the State of Mexico and observed that there was an increase of 1.06 t ha-1 when it was changed from 52 083 to 104 167 plants ha-1. The response to the increase in population density depends on the type of cultivar, the evaluation sites and their interaction, among others (Sangoi, 2002; Tollenaar and Lee, 2011).
Rodríguez et al. (2015) chose El Cerillo, San Andrés and San Mateo as evaluation sites and the only common material was H-40. In other studies it was concluded that the optimal population density varied from 10.3 to 13.7 plants m-2 (Sangoi et al., 2002), values higher than those evaluated in the present study.
Cultivars maize
IC 2010 was the latest (106 and 108 days) and HIT-9 the earliest (91 and 93 days). The average floral synchrony interval for hybrids and criollos was four days. In other studies, it has been concluded that genetic improvement has contributed to an improvement in the floral synchrony of new maize materials, which has strong implications for greater tolerance to high population densities (Andrade et al., 1996); a short interval in this one in high densities could be a reliable indicator that the hybrids will present tolerance to several types of stress (Anaus et al., 2011).
Tollenaar (1992) reported an increase in the prolificacy of hybrids due to genetic improvement, based on an increase in the rate of accumulation of dry matter per plant in flowering stage and a higher rate of growth per plant. For PO and PVG hybrids had higher values compared to criollos, HID-15 had greater “olote” weight (22.32 g) and P204 W plus grain volumetric weight (802.39 g).
Tlacotepec and HID-15 stood out by weight of grain per plant (147.5 and 140.66 g). The NGP was higher in HIT 9 (449) and HID-15 (446) and both differed from the other cultivars. The response of the hybrids evaluated in this study in relation to grain yield, is in accordance with the tendency that the hybrids surpass in grain yield to the criollos, like Amarillo Lomas and Tlacotepec (Vafias et al., 2006; González et al., 2008).
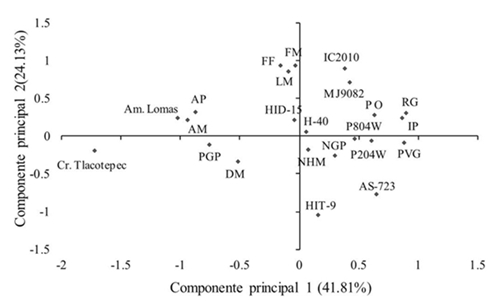
The 10 cultivars were grouped into two levels of productivity: P204W was the most outstanding (10 t ha-1) but this and H-40, AS-723, AS-MJ9082, P804W, HID-15 and IC-2010 had yields of grain ratio (between 8.4 and 9.66 t ha-1). Amarillo Lomas, Tlacotepec and HIT-9 had lower grain yields statistically than those of the previous group (Table 6, Figure 2). The above results are also related to the genetic and geographic origin of the biological material. H-40, HID-15, HIT-9 and IC-2010 are made up of lines from the International Maize and Wheat Improvement Center (CIMMYT) and others from the Conic race belonging to Mexican research institutions, such as the National Institute (INIFAP) and the Institute of Research and Training in Agriculture, Aquaculture and Forestry of the State of Mexico (ICAMEX).
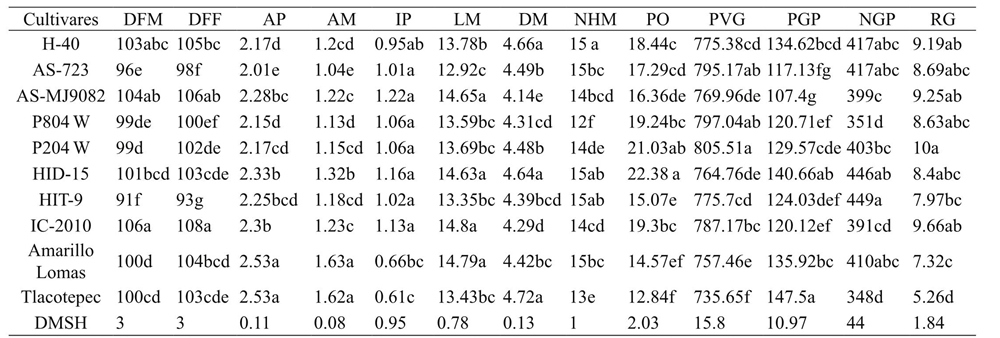
Las medias con la misma letra dentro de cada columna son estadísticamente iguales (Tukey, p= 0.05). DFM= floración masculina; DFF= floración femenina; AP= altura de planta AM= altura a la mazorca; IP= índice de prolificidad; LM= longitud de mazorca; DM= diámetro de mazorca; NHM= número de hileras por mazorca; PO= peso de olote; PVG= peso volumétrico del grano; PGP= peso de grano por planta; NGP= número de granos por planta; RG= rendimiento de grano.
Table 6 Arithmetic means for 10 corn cultivars.
Other studies conducted in the central region of Mexico have shown improvement in grain yield increase and other plant and ear characteristics of the new hybrids, which has contributed to improve their adaptability, particularly when crossing lines of CIMMYT with lines from Conic or Chalqueño (González et al., 2008; Torres et al., 2011; Reynoso et al., 2014; Rodríguez et al., 2015).
Although the genetic and geographical origin of ASMJ9082, AS-723, P804W and P204W is unknown, they may be formed by CIMMYT lines, because they were grouped with the other subset of hybrids that have at least one common to one of their parents (Figure 2).
Amarillo Lomas and Tlacotepec, collected in the Toluca- Atlacomulco region, México, were evaluated as forage materials by Franco et al. (2015), both were classified as Cónico or Cónico-Chalqueño, respectively. The yields of grain in some criollos of both races, planted in the Mexican center, vary from 6.55 to 7.5 t ha-1 (González et al., 2008) or 7.77 9.25 t ha-1 (Rodríguez et al., 2015).
Wellhausen et al. (1951) pointed out that in the Toluca- Atlacomulco region there are cultivars that belong to Cacahuacintle, Conic, Chalqueño and Palomero Toluqueño, but the second and third are those that predominate in more than 85% of their planted area.
The superiority of the hybrids belonging to group 1 is mainly attributed to the positive and significant correlation that these presented with both blooms, rows and length of cob, with volumetric weights of the grain and “olote”, with number of grains per plant, index prolificacy and grain yield. In contrast, both criollos presented only superiority in both heights and weight of grain per plant and ear diameter (Figure 2).
The high correlation between grain yield and number of grains per plant (NGP), prolificacy index (IP), number of rows (NH) and cob weight (PO) has been reported in other studies (Sangoi et al., 2002; Maddonni et al., 2006; Van Roekel and Coulter, 2011; Antonieta et al., 2014).
In other studies carried out in the center of the state of Mexico, H-40 produced 7.78 and 8.59 t ha-1 (González et al., 2008; Rodríguez et al., 2015), averages lower than those recorded in the present study (9.19 t ha-1). Velázquez et al. (2005) reported yields between 3.6 and 11.1 t ha-1 in several localities in central Mexico, with a mean of 7.17 t ha-1; they also commented that H-40 is recommended for commercial sowing in irrigation and good weather in the states of Hidalgo, Puebla, Queretaro, Tlaxcala and State of Mexico (between 2 200 and 2 500 meters above sea level).
Conclusions
In the three localities, statistically equal grain yields were recorded. The difference between the highest and the lowest of the three population densities, with the same fertilization formula, was 2.78 t ha-1 in 104 161 plants ha-1 was recorded 10.03 t ha-1. With P204W 10 t ha-1 was obtained, but this did not differ statistically from IC 2010, AS-MJ9082, H-40 and AS-723. The principal component analysis explained 65.94% of the original total variation; the higher grain yield per unit area in the genetic material above is explained by the high correlation between RG, IP, PO and NGP. This work can be considered as a basis for characterizing other hybrids in high population densities.
Literatura citada
Anaus, J. L.; Sanchez, C. and Edmeades, G. O. 2011. Phenotyping maize for adaptation to drought. In: Monnexveux, P. and Ribaut, J. M. (Ed.). Drought phenotyping in crops: from theory to practice. Consultative Group on International Agricultural Research (CIGAR) Generation Challenge Programme-CIMMYT. Mexico. 263-283 p. [ Links ]
Andrade, F. H.; Cirilo, A. G.; Uhart, S. and Otegui, M. E. 1996. Ecofisiología del cultivo de maíz. Dekalpress, Buenos Aires, Argentina. 292 p. [ Links ]
Antonietta, M.; Fanello, D. D.; Acciaresi, H. A. and Guiamet, J. J. 2014. Senescence and yield responses to plant density in stay green andearlier-senescing maize hybrids from Argentina. Field Crops Res. 155:111-119. [ Links ]
Bavec, F. and Bavec, M. 2002. Effects of plant population on leaf area index, cob characteristics and grain yield of early maturing maize cultivars. (FAO 100-400). Eur. J. Agron. 16(1):151-159. [ Links ]
Cervantes, O. F.; Cadenas, T. J. L.; Raya, P. J. C.; Andrio, E. E.; Rangel, L. J. A.; Guevara, A. L. P.; Rodríguez, H. R. S. y Mendoza, E. M. 2015. Respuesta del Silk Balling a humedad edáfica y densidad de población en líneas de maíz. Rev. Mex. Cienc. Agríc. 6 (1):231-241. [ Links ]
CIMMYT.1995. Manejo de los ensayos e informe de los datos para el programa de ensayos internacionales de maíz del CIMMYT. 5ta reimpresión, México , D. F. 20 p. [ Links ]
CONAGUA. 2013. Comisión Nacional del Agua. Coordinación General del Servicio Meteorológico Nacional. Área Técnica Departamento de Aguas Superficiales. Ingeniería de Ríos. [ Links ]
Daynard, T. B. and Muldoon, J. F. 1983. Plant-to-plant variability of maize plants grown at different densities. Canadian Journal of Plant Science 63(1):45-59. [ Links ]
Duvick, D. N. 1997. What is yield?. In developing drought and low N-tolerant maize, (eds.) G. O. Edmeades, B. Banziger, H. R. Mickelson and C. B. Pema-Valdivia.México: CIMMYT. 3-15 p. [ Links ]
Echarte, L.; Luque, S.; Andrade, F. H.; Sadras, V. O.; Cirilo, A. G.; Otegui, M. E. and Vega C. R. C. , 2000. Response of maize kernel number to plant density in Argentinean hybrids released between 1965 and 1993. Field Crops Res. 68: 1-8. [ Links ]
Franco M., J. R. P.; González H., A.; Pérez L., D. J. y González R., M. 2015. Caracterización fenotípica de híbridos y variedades de maíz forrajero en Valles Altos del Estado de México, México. Rev. Mex. Cienc. Agric. 6(8):1915-1926. [ Links ]
González, H. A.; Vázquez, G. L. M.; Sahagún, C. J.; Rodríguez, P. J. E. y Pérez, L. D. J. 2007. Rendimiento del maíz de temporal y su relación con la pudrición de mazorca. Agric. Téc. Méx. 33(1):33-42. [ Links ]
González, H. A.; Vázquez, G. L. M.; Sahagún, C. J. y Rodríguez, P. J. E.2008. Diversidad fenotípica de variedades e híbridos de maíz en el Valle de Toluca- Atlacomulco, México. Rev. Fitotec. Mex. 31(01):67-76. [ Links ]
González, A.; Pérez, D. J.; Sahagún, J.; Franco, O.; Morales, E.; Rubí, M.; Gutiérrez, F. y Balbuena, A. 2010. Aplicación y comparación de métodos univariados para evaluar la estabilidad en maíces del Valle Toluca- Atlacomulco, México. Rev. Agron. Costarric. 34(2):129-143. [ Links ]
Hashemi, A. M.; Herbert, S. J. and Putnam, D. H. 2005. Yield response of corn to crowding stress. Agron. J. 97(3):839-846. [ Links ]
Hashemi, A. M and Herbert, S. J. 1992. Intensifying plant density response of corn with artificial shade. Agron. J. 84: 547-551. [ Links ]
Lashkari, M.; Madani, H.; Ardakani, M. R; Golzardi, F. and Zargari, K. 2011. Effect of plant density on yield and yield components of different corn (Zea mays L.) hybrids. Am. Eur. J. Agron. Envirom. Sci. 10(3):450-457. [ Links ]
Maddonni, G. A.; Cirilo, A. G. and Otegui, M. E. 2006. Row width and maize grain yield. Agron. J. 98(6):1532-1543. [ Links ]
Martínez, G. A. 1988. Diseños experimentales. Métodos y elementos de teoría. Trillas, México. 756 p. [ Links ]
Novacek, M. J.; Mason, S. C.; Galusha, T. D. and Yaseen, M. 2013. Twin rows minimally impact irrigated maize yield, morphology, and lodging. Agron. J. 105(1):268-276. [ Links ]
Novacek, M. J.; Mason, S. C.; Galusha, T. D. and Yaseen, M. 2014. Bt transgenes minimally influence maize grain yields and lodging across plant populations. Maydica. 59(1-4):90-95. [ Links ]
Oyervides, G. A.; Ortiz, C. J.; Gonzáles, H. V. A y Carballo, C. A. 1990. El número de mazorcas por planta y la formación de arquetipos de maíz. Agrociencia. 1(4):103-117. [ Links ]
Rodríguez, F. I.; González, H. A.; Pérez L. D. J. y Rubí, A. M. 2015. Efecto de cinco densidades de población en ocho cultivares de maíz sembrados en tres localidades del Valle de Toluca, México. Rev. Mex. Cienc. Agríc. 6(8):1943-1955. [ Links ]
Rodríguez, P. J. E.; Sahagún, C. J.; Villaseñor, M. H. E.; Molina, G. J. D. y Martínez, G. A. 2005. La interacción genotipo*ambiente en la caracterización de áreas de temporaleras en la producción de trigo. Agrociencia. 39(1):51-64. [ Links ]
Rossini, M. A.; Maddonni, G. A. and Otegui, M. E. 2012. Inter-plant variability in maize crops grown under contrasting Nstand density combinations: Links between development, growth and kernel set. Field Crop Res. 133:90-100 [ Links ]
Reynoso, Q. C. A.; González, H. A.; Pérez, L. D. J.; Franco, M. O.; Torres, F. J. L.; Velázquez, C. G. A.; Breton, L. C.; Balbuena, M. A. y Mercado, V. O. 2014. Análisis de 17 híbridos de maíz sembrados en 17 ambientes de los Valles Altos del centro de México. Rev. Mex. Cienc. Agríc. 5(5):871-882. [ Links ]
Sánchez G, J. J. 1995. El análisis biplot en clasificación. Rev. Fitotec. Mex. 18(2):188-203. [ Links ]
Sangoi, L.; Gracietti, M. A.; Rampazzo, C. and Bianchetti, P. 2002. Response of Brazilian maize hybrids from different eras to changes in plant density population. Field Crops Research. 79(1):39-51. [ Links ]
Sarlangue, T.; Andrade, F. H.; Calviño, P. A. and Purcell, L. C. 2007. Why do maize hybrids respond differently to variations in plant density? Agron. J. 99(4):984-991. [ Links ]
SIAP. 2007. Servicio de Información Agroalimentaria y Pesquera. Situación actual y perspectivas del maíz en México 1996-2012. Secretaría de Agricultura, Ganadería, Desarrollo Rural, Pesca y Alimentación (SAGARPA). México, D. F. 208 p. [ Links ]
Stanger, T. F. and Lauer, J. G. 2006. Optimum plant population of Bt and non-Bt corn in Wisconsin. Agron. J. 98:914-921. [ Links ]
Tetio, K, F. and Gardner, F. P. 1988. Responses of maize to plant population density. II. Reproductive development, yield, and yield adjustments. Agron. J. 80(6) 930-940. [ Links ]
Tollenaar, M. 1992. Is low plant density a stress in maize? Maydica. 37(4):305-311. [ Links ]
Tollenaar, M. and Lee, E. A. 2011. Strategies for enhancing grain yield in maize. Plant Breeding Reviews. 34(4):37-82. [ Links ]
Torres, F. J. L.; Morales, R. E. J.; González, H. A.; Laguna, C. A. y Córdova, O. H. 2011. Respuesta de híbridos trilíneales y probadores de maíz en Valles Altos del centro de México. Rev. Mex. Cienc. Agríc. 2(6):829-844. [ Links ]
Turrent, F. A. 2009. Potencial productivo de maíz. Rev. Cienc. 92- 93:126-129. [ Links ]
Vafias, B.; Ispalandis, C. G.; Goulas, C. and Deligeorgidis, P. N. 2006. An approach on yielding performance in maize under varying plant densities. Asian J. Plant Sci. 5(4):690-694. [ Links ]
Van Roekel, R. J. and Coulter, J. A. 2011. Agronomic responses of corn to planting date and plant density. Agron. J. 103(5): A 1414-1422. [ Links ]
Van Roekel, R. J. and Coulter, J. A. 2012. Agronomic responses of corn hybrids to row width and plant density. Agron. J. 104(3): 612-620. [ Links ]
Velázquez, C. G. A.; Tut, C. C.; Lothrop, J.; Virgen, V. J. y Salinas, M. Y. 2005. H-40. Híbrido de maíz de grano blanco para los Valles Altos de México. SAGARPA-INIFAP-CIRC. Chapingo, Estado de México. Folleto Técnico Núm. 21 p. [ Links ]
Wellhausen. E. J.; Roberts, L. M.; Hernández, X. E. and Mangelsdorf, P. C.1951. Razas de maíces en México; su origen, características y distribución. Folleto Técnico No. 5. Secretaría de Agricultura y Ganadería (SAR). México, D. F. 237 p. [ Links ]
Received: September 01, 2017; Accepted: November 01, 2017
 Este es un artículo publicado en acceso abierto bajo una licencia Creative Commons
