


Serviços Personalizados
Journal
Artigo
 texto em
  Inglês (pdf)
 Artigo em XML
 Referências do artigo
 Enviar este artigo por email
Indicadores
-
 Citado por SciELO
 -
 Acessos
Links relacionados
-
 Similares em
SciELO
Similares em
SciELO
Compartilhar

 Permalink
Revista mexicana de ciencias agrícolas
versão impressa ISSN 2007-0934
Rev. Mex. Cienc. Agríc vol.8 no.3 Texcoco Abr./Mai. 2017
https://doi.org/10.29312/remexca.v8i3.32
Articles
Genotype environment interaction in maize grown in Tamaulipas, Mexico
1Campo Experimental Rio Bravo-INIFAP. Carretera Matamoros-Mazatlán, km 100. Río Bravo, Tamaulipas, México. CP. 88900. (reyes.cesar@inifap.gob.mx; cantu.miguel@inifap.gob.mx).
2Centro de Biotecnología Genómica-IPN. Blvd. del Maestro s/n esq. Elías Piña, Col. Narciso Mendoza, Reynosa, Tamaulipas, México. CP. 88710. Tel/Fax. (899) 9243627. (hgill@ipn.mx; jggarcia@ipn.mx).
3Universidad México Americana del Norte A. C. Primera s/n, Col. El Círculo, Reynosa, Tamaulipas, México. CP. 88640. Tel. (899) 9222002.
In northern Tamaulipas, Mexico between 30 000 and 100 000 hectares with maize (Zea mays L.) are grown each year. The surface varies due to the incidence of biotic factors (insect pests, toxigenic fungi) and abiotic factors (high temperature, soil salinity, drought), as well as the availability of water for irrigation. For this reason, cultural, genetic, biological and chemical alternatives for crop management must be constantly evaluated to maximize yield and grain quality. In this paper, the agronomic behavior and genotype x environment interaction of eight maize hybrids planted at four sowing dates and three years of cultivation based on the analysis of the interaction of main and additive main effects (AMMI) and model Genotype, genotype x environment (GGA) Biplot were evaluated; as well as in sequential trail analysis (ASS). The AMMI analysis for grain yield indicated significant differences (p≤ 0.01) between hybrids and test environments. Main components analysis indicated that the first two components (CP) contributed 76% of the total variance (PC1= 20 and PC2= 56%); the GGE biplot analysis indicated that DK-697 was the hybrid with higher yield and greater stability. The biplot graphic showed that the vectors were further away from the center for year 2006A, 2006B, 2006C and 2007A (greater interaction and genotyping ability), while the nearest vectors were 2008B and 2008C (lower interaction). Among hybrids, the most remote from the origin (less stable) were H-437 and G-8222; the closest to the origin and more stable was DK-697. The ASS analysis detected moderate colinearity for all evaluated characteristics, with strong effects of the number of healthy cobs (Influence Value of Variance or FV= -1.41) and cob weight (FV= -1.19). The variables with the greatest association to grain yield were cob weight, plant height, plant height/cob ratio and number of healthy cobs explaining 86% of the variation.
Keywords: Zea mays L.; AMMI; biplot; GGE biplot analysis; grain yield stability; sequential trail analysis
En el norte de Tamaulipas, México se cultivan entre 30 mil y 100 mil hectáreas con maíz (Zea mays L.) cada año. La superficie varía debido a la incidencia de factores bióticos (plagas de insectos, hongos toxígenos) y abióticos (alta temperatura, salinidad del suelo, sequía), así como la disponibilidad de agua para riego. Por tal razón, alternativas culturales, genéticas, biológicas y químicas para el manejo del cultivo se deben evaluar constantemente para maximizar el rendimiento y la calidad de grano. En este trabajo, se evaluó el comportamiento agronómico y la interacción genotipo x ambiente de ocho híbridos de maíz sembrados en cuatro fechas de siembra y tres años de cultivo con base el análisis de la interacción de efectos principales aditivos y multiplicativos (AMMI) y el modelo genotipo, genotipo x ambiente (GGA) Biplot; así como en el análisis de sendero secuencial (ASS). El análisis AMMI para rendimiento de grano indicó diferencias significativas (p≤ 0.01) entre híbridos y ambientes de prueba. El análisis de componentes principales indicó que los dos primeros componentes (CP) contribuyeron con 76% de la varianza total (PC1= 20 y PC2= 56%); el análisis GGE biplot indicó que DK-697 fue el híbrido con mayor rendimiento y mayor estabilidad. El gráfico biplot mostró que los vectores estuvieron más alejados del centro para el año 2006A, 2006B, 2006C y 2007A (mayores interacción y capacidad de discriminación de genotipos), mientras que los vectores más cercanos fueron 2008B y 2008C (menor interacción). Entre híbridos, los más alejados del origen (menos estables) fueron H-437 y G-8222; el más cercano al origen y más estable fue DK-697. El análisis ASS detectó colinealidad moderada para todas las características evaluadas, con efectos fuertes del número de mazorcas sanas (Valor de Inflación de la Varianza o VIF= -1.41) y peso de mazorca (VIF= -1.19). Las variables con mayor asociación al rendimiento de grano fueron peso de mazorca, altura de planta, relación de altura de planta/mazorca y número de mazorcas sanas que explicaron 86% de la variación.
Palabras claves: Zea mays L.; AMMI; análisis de sendero secuencial; análisis GGE biplot; biplot; estabilidad del rendimiento de grano
Introduction
In Mexico, maize (Zea mays L.) is the most important crop, more than 7.4 million hectares are planted annually, with a global production of more than 23.2 million tons. The average unit grain yield (3.3 t ha-1) in 2014 (SIAP, 2016) indicates low yields mainly because maize is grown at about 85% of the area under temporary or dry conditions, which depends on the rainfall regime, which is often erratic and insufficient to cover the water demand of the crop. For these variable conditions, maize genetic improvement programs in Mexico have generated a wide diversity of genotypes based on the application of different selection and evaluation strategies (Ángeles-Arrieta, 2000). Specifically, in the north of Tamaulipas, the area planted with maize varies between 30 000 and 100 000 hectares each year. For example, in 2014 more than 67 000 ha were grown with global yields of more than 360 000 t (5.4 t ha-1). The surface variations depend mainly on the availability of water for irrigation or the incidence of pests and or diseases. For that reason, cultural, genetic, biological and chemical alternatives for crop management are constantly evaluated to maximize yield and grain quality (Reyes-Méndez and Cantú-Almaguer, 2006).
Substancial progress in increasing grain yield are based on achieving optimum adaptation of the genotype to each production environment, as well as the combination of desirable traits such as grain quality and resistance to abiotic and biotic stress. Another factor that supports the breeder is the evaluation of the magnitude and direction of the association between grain yield and its components as well as the relative importance of each factor involved in the contribution to grain yield (Agrama, 1996). However, it is common to observe germplasm without good adaptation to variable environments or germplasm with specific or local environmental adaptation (González-Martínez et al., 2014; Lozano-Ramírez et al., 2015). In maize, it has been determined that the number of cobs per plant has the greatest direct effect on grain yield, although there are also indirect effects like the number of grains per cob, prolificacy or grain size, characteristics that serve in breeding of maize yield (Agrama, 1996).
Márquez-Sánchez (1991) defined as a stable variety the one with the capacity to cushion or to adjust to the prevailing environmental conditions. In genetic improvement, spatial and temporal stability must be evaluated to increase the efficiency of the selection process, since the economically important characteristics are measurable, continuously distributed and are polygenic as well as affected by the environment (Lozano-Ramírez et al., 2015).
In maize, varieties and hybrids with stable behavior have been developed through the application of methodologies that consider stability parameters, particularly grain yield (Fan et al., 2007; Cargnelutti et al., 2009; García et al., 2009; Kandus et al., 2010; Lozano-Ramírez et al., 2015). Also, several studies have emphasized that, through sequential trail analysis, the selection of superior germplasm in yield is based on characters such as the number of grains per cob, grain size or number of cobs per plant, closely and positively associated with maize yield (Agrama, 1996; Mohammadi et al., 2003; Nemati et al., 2009).
Among the alternatives of IGA analysis are the AMMI model (Analysis of the interaction of main and additive multiplicative effects) based on a linear-bilinear model that estimates stability, evaluates environments and classifies them (Crossa et al., 1990); as well as model regression analysis at sites (SREG), also known as GGE biplot graphic (Yan et al., 2000). On the other hand, the evaluation of the genotypes behavior and the effects of the components on grain yield expression can be determined based on the sequential trail analysis (ASS), where the correlations between characters with direct effects and indirect responses in a variable response (Whittaker et al., 2009). In order to select genotypes, the correlations of variables are broken down into causal effects, identifying chains of causality between them. Thus, SSA distinguishes between the real effects of predictor variables and the adjustment of several data groups, offering advantages over conventional trail analysis (Kozak and Antunes-Azevedo, 2014).
The objective of this paper was to evaluate the productive behavior and the adaptation of maize hybrids to different sowing dates and test years (environments) in the north of Tamaulipas, for which AMMI, GGE biplot and trail analysis Sequential (ASS) were applied.
Materials and methods
The study was conducted during three crop cycles (2006, 2007 and 2008) at the Río Bravo Experimental Field of the National Institute of Forestry, Agriculture and Livestock Research (INIFAP) in Río Bravo, Tamaulipas, Mexico (25º 57’ north latitude, 98º 01’ west longitude, 30 meters above sea level). Soils of the experimental site are of clay texture, pH= 7.5 and low content of organic matter (1.1%). Each experiment included five hybrids of white maize (H-437, H-439, H-440, P-3025, Tigre) and three hybrids with yellow grain (G-8222, P-31G98, DK- 697 (Table 1), which were planted at four planting dates every seven days during January and February of each year, all within the optimum range for maize at the test site (Table 2) (Reyes-Méndez and Cantú-Almaguer, 2006).
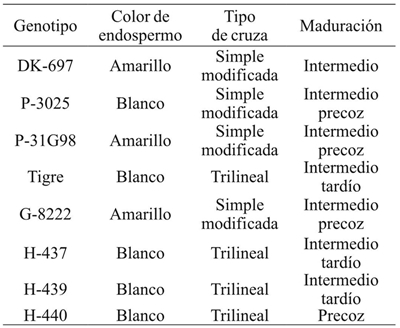
Table 2 Environmental conditions in the experiments with maize hybrids planted in different years and dates of sowing. Rio Bravo, Tamaulipas.
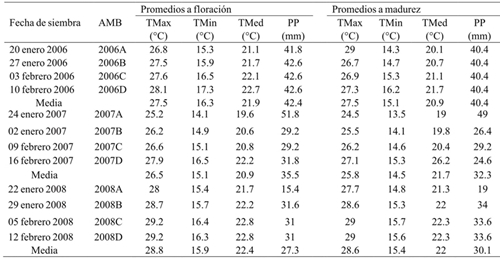
AMB= ambiente; TMax= temperatura media máxima; TMin= temperatura media mínima; TMed= temperatura media; PP= precipitación pluvial total.
Each experiment was established in a randomized complete block experimental design with a split plot arrangement, where the large plot corresponded to the dates of planting and the small plot to the maize hybrids. Each treatment had four replicates; the experimental plot consisted of four furrows 5 m long spaced 0.8 m apart. Soils and experiments were prepared and conducted in accordance with the INIFAP maize technology package for the region (Reyes-Méndez and Cantú-Almaguer, 2006).
In each experimental plot there were estimated: the ʻfield weight’ of cobs (PT, which included grain and olote without moisture adjustment), weight of cobs (PM, with grain and olote adjusted to 14% moisture), grain yield (RG, adjusted to 14% moisture), days to male flowering (DFM) and days to female flowering (DFF), number of healthy cobs (NMS) and number of sick cobs (NME), plant height (AP) and cob height (AM), plant height-cob ratio (RAPM).
The analysis of the genotype-environment interaction was carried out with the AMMI model in the SAS version 9.0 program (Crossa et al., 1990), in addition to the GGE Biplot analysis (Vargas and Crossa, 2000; Burgueño et al., 2002). 12 ‘environments’ were generated as a result of the combination of four dates of planting and three years of testing. Subsequently, the sequential trail analysis (ASS) was performed based on the estimation of the Influence Values of the Variance (VIFs) and the tolerance values. In this case, the variables cob weight (PM), plant height (AP), height plant-cob ratio (RAPM) and number of healthy ecobsars (NMS) were considered first order variables. In order to identify the first order variables, the procedure was repeated considering the variables mentioned above as second order dependent variables. The coefficients of partial determination (analogous to R2 of the linear regression analysis) were calculated from the path coefficient for all variables (Williams et al., 1990).
Results
The variance analysis of the AMMI model for grain yield (GR) showed significant differences (p≤ 0.05) between environments, indicating that differences between the averages of this variation source contributed to differences in grain yield between maize genotypes . The contribution of the IGA effect to the sum of squares was greater than that of genotypes, demonstrating genotypic differences in response to test environments (Table 3). The analysis of the main components indicated that the first two main components were significant (p≤ 0.01) and, together, explained 76.6% (CP1 56.2% and CP2 20.4%) of the total variation due to the interaction (data not included). The most stable hybrid with lower IGA showed values between -0.3 to 0.3 in the first major component (CP1) of the AMMI and it was DK-697 (Figure 1).
Table 3 Average squares of the analysis of variance of grain yield of maize hybrids planted in years and dates of planting in Río Bravo, Tamaulipas.
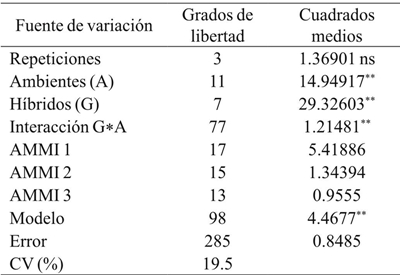
CV= coeficiente de variación; ns= no significativo; *= significativo (p≤ 0.05); **= significativo (p≤ 0.01).
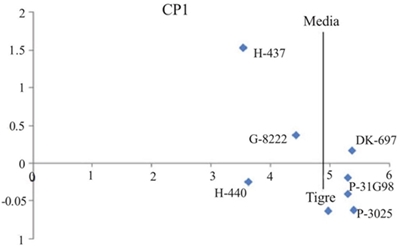
Figure 1 Dispersion of maize hybrids grown in northern Tamaulipas, Mexico (2006-2008), based on grain yield (t ha-1) on the abscissa axis and the first CP1 component of AMMI.
The environments (year*date of sowing) farther from the origin were 2006A, 2006B, 2006C and 2007A; while the vectors closest to origin corresponded to 2008B and 2008C (Table 2, Figure 2). Hybrids furthest from the center of the biplot graphic (H-437 and G-8222) had the highest grain yield (RG) and highest variability through experiments. In contrast, DK-697, H-440 and Tiger had stable RG as they were located closer to the origin of the biplot graphic (Figure 2). The ASS indicated that cob weight (PM), plant height (AP), height plant-cob ratio (RAPM) and number of healthy cobs (NMS) are first order variables for RG because they explained 86% of the total variance of the RG of the evaluated hybrids; in addition to the presence of moderate colinearity for all the variables measured, with strong effects, for example, on the number of healthy cobs (FV= 1.41) and cob weight (FV= 1.19) (Table 4).
Table 4 Direct effects of predictors of grain yield (GR) and measures of colinearity in eight maize hybrids grown in northern Tamaulipas, Mexico.
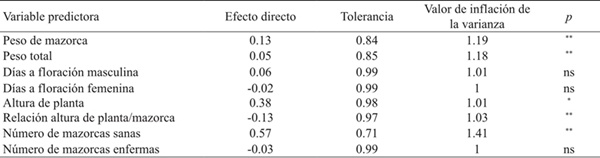
ns= no significativo; *significativo (p≤ 0.05); **= significativo (p≤ 0.01).
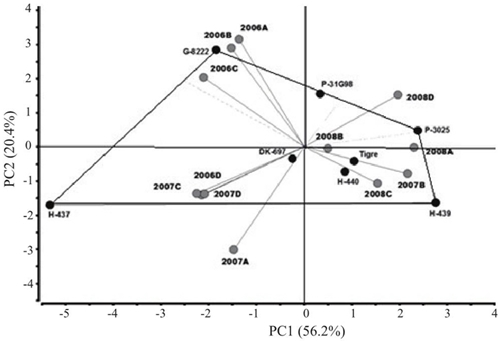
Figure 2 Biplot graphic of maize hybrids grown in northern Tamaulipas, Mexico during 2006-2008 based on grain yields (GR).
The first and second order variables showed that 32% of the total weight variation of cob (PM) is explained by the variables of days at male flowering (DFM), days at female flowering (DFF) and total weight (PT); while 64% of the variation in the number of healthy cobs (NMS) is explained by the number of sick cobs (NME) and the cob weight (PM) (Table 5, Figure 3.
Table 5 Direct effect of first and second order predictors on grain yield and colinearity in eight maize hybrids grown in northern Tamaulipas, Mexico.
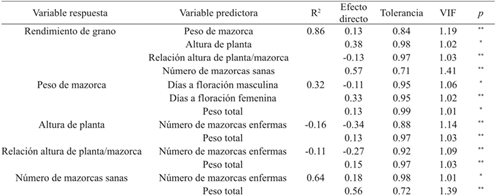
ns= no significativo; *= significativo (p≤ 0.05); **= significativo (p≤ 0.01); VIF= valor de inflación de la varianza.
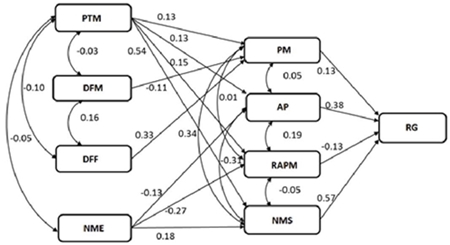
Figure 3 Sequential trail analysis that indicates the interrelations of the characteristics that contribute to grain yield of eight maize hybrids grown in northern Tamaulipas, Mexico. PM= cob weight; PTM= total cob weight; DFM= days at male flowering; DFF= days at female flowering; AP= plant height, RAPM= cob/plant height ratio; NMS= number of healthy cobs; NME = number of sick cobs; RG= grain yield.
Discussion
In this paper, differences in the agronomic behavior among the eight maize hybrids evaluated through the test environments, as a result of the combination of three years of evaluation and four planting dates, were observed, which reflects the influence of variable environmental conditions occurring during the experiments development. Significant effects between maize genotypes and test environments were previously reported (Fan et al., 2007; Cargnelutti et al., 2009; García et al., 2009; Kandus et al., 2010; Nemati et al., 2010; Selvaraj and Ngarajan, 2011; Lozano-Ramírez et al., 2015).
The most stable hybrid with lower IGA was DK-697, according to the results of the two analysis strategies, AMMI and GGE Biplot. In addition, the latter strategy indicated that three environments from 2006 and one from 2007 contributed in less proportion to genotype x environment interaction and therefore exhibited better ability to discriminate genotypes. These environments offered better environmental conditions because they recorded the highest rainfall averages. In contrast, two environments in 2008 had the lowest environmental interaction since they showed higher temperatures that equally affected the evaluated germplasm.
Although Balestre et al. (2009) and Luenzzo-De Oliveira et al. (2010) agree that the AMMI model is generally more accurate to evaluate the adaptability and stability of maize germplasm based on grain yield, in this paper it was observed that both strategies coincided in identifying the most stable hybrid, DK- 697, as also indicated by Mitrovic et al. (2012). On the contrary, Yan et al. (2007) mention that, although both methods combine the effects of genotype and genotype*environment interaction in the mega-environment analysis, GGE biplot is superior to AMMI because it better explains the genotypic and interaction effects and has the property of the biplot ‘internal product’, as well as its power of discrimination vs. the vision of representativeness. Therefore, we consider that the combination of both strategies would improve efficiency in the process of evaluating the yield stability in maize germplasm with the advantage that the biplot GGE would also provide information to characterize and stratify test environments therefore reducing the number of experiments or test sites up to 70% (Mitrovic et al., 2012) with the consequent saving of time, money and work without loss of efficiency and accuracy of the evaluation.
The variables cob weight, plant height, plant heigh /cob ratio and number of healthy cobs were identified as variables directly associated with maize grain yield (first order variables), in addition to colinearity among all measured variables, with strong effects on the number of healthy cobs and cob weight. Previous studies indicate that the selection of higher maize germplasm in grain yield is based on the consideration of characters such as the number of grains per cob, grain size or number of cobs per plant, closely and positively associated with maize yield (Agrama, 1996; Mohammadi et al., 2003; Nemati et al., 2009; Jamshidian et al., 2013). Jamshidian et al. (2013); Rashidi et al. (2013) even observed direct positive associations of protein contents with grain and cob weight.
The joint use of AMMI, GGE biplot and sequential pathway analysis strategies have been applied to evaluate the significance and magnitude of the effect of the genotype x environment interaction; as well as to identify the relationships between grain yield and yield components in crops such as soybean [Glycine max (L.) Merr.] (Ascencio-Luciano et al., 2013). Also, they have been applied in the characterization of the response to wheat drought (Triticum aestivum L.) (Farshadfar et al., 2012). These models are good statistical tools for the evaluation, characterization and selection of germplasm based on their behavior in variable environments (Tai and Tarn, 2003), so that the genetic improvement of maize by grain yield will be efficient considering the highly associated variables with grain yield for the correct design and use of selection indexes in mega-environments.
Conclusions
In this paper, the combination of AMMI model, GGE biplot and sequential trail analysis (ASS) allowed the identification of maize germplasm with grain yield stability and high average grain yield (DK-697), as well as the identification of characteristics closely associated with grain yield (cob weight, plant height, plant height/cob ratio and number of healthy cobs) of maize hybrids grown in different years and planting dates in northern Tamaulipas, Mexico.
Literatura citada
Ascencio, L. G.; Maldonado, M. N.; García, J. G. and Gill-Langarica, H. R. 2013. AMMI and sequential path analyses of soybean [Glycine max (L.) Merrill] experimental lines in a breeding program in the Mexican tropics. Aust. J. Crop Sci. 7:1772-1779. [ Links ]
Balestre, M.; García, Von P. R.; Souz, J. and Luenzzo, De O. R. 2009. Genotypic stability and adaptability in tropical maize based on AMMI and GGE biplot analysis. Gen. Mol. Res. 8:1311-1322. [ Links ]
Burgueño, J.; Crossa, J. and Vargas M. 2002. SAS programs for graphing GE and GGE biplots Biometrics and statistics Unit, . CIMMYT, México. http://www.cimmyt.org/ ru/programs-and-units/units-a-labs/crop-research-informatics-laboratory/disciplinary-groups-units/biometrics-and-statistics-unit. [ Links ]
Cargnelutti, F. A.; Storck, L.; Riboldi, L. S.; Guadagnin, J. P. 2009. Association between adaptability and stability methods in corn. Ciencia Rural. 39:340-347. [ Links ]
Crossa, J.; Gauch, H. G. and Zobel, R. W. 1990. Additive main effects and multiplicative interaction analysis of two international maize cultivar trials. Crop Sci. 30:493-500. [ Links ]
Fan, X. M.; Kang, M. S.; Chen, H.; Zhang, Y.; Tan, J. and Xu, C. 2007. Yield stability of maize hybrids evaluated in multi-environment trials in Yunnan, China. Agron. J. 99:220-228. [ Links ]
Farshadfar, E.; Rasoli, V.; Mohammadi, R. and Veisi, Z. 2012. Path analysis of phenotypic stability and drought tolerance in bead wheat (Triticum aestivum L.). Int. J. Plant Breed. 6:106-112. [ Links ]
García, P. J.; Cabrera, S. R.; Pérez, A. A.; Silva, R. J.; Álvarez, R. M.; Marín, C. A.; Monasterio, P. P. y Santella, M. D. 2009. Estabilidad del rendimiento y potencial agronómico de cultivares de maíz de endospermo normal y QPM en zonas agroecológicas de Venezuela. Agron. Trop. 59:433-443. [ Links ]
González, M. J.; López, S. J. A.; Briones, E. F.; Varela, F. S. E.; Reyes, M. C. A. y Pecina, M. J. A. 2014. Programa de manejo, conservación y mejoramiento de maíz nativo de la Facultad de Ingeniería y Ciencias de la Universidad Autónoma de Tamaulipas. Investigación y Ciencia. 62:76-83. [ Links ]
Jamshidian, P.; Reza, G. A.; Reza, N. M. and Darkhal, H. 2013. Phenotypic correlations and path analysis between ear yield and other associated characters in corn hybrids (Zea mays L.). Int. J. Farming Allied Sci. 2:1273-1276. [ Links ]
Kandus, M.; Almorza, D.; Boggio, R. R. and Salerno, J. C. 2010. Statistical models for evaluating the genotype-environment interaction in maize (Zea mays L.). Phyton. Int. J. Exp. Bot. 79:39-46. [ Links ]
Kozak, M. and Antunes, A. R. 2014. Sequential path analysis: what does ‘sequential’ mean? Scientia Agricola. 71:525-527. [ Links ]
Lozano, R. A.; Santacruz, V. A.; San Vicente, G. F.; Crossa, J.; Burgueño, J. and Molina, G. J. D. 2015. Modelación de la interacción genotipo*ambiente en rendimiento de híbridos de maíz blanco en ambientes múltiples. Rev. Fitotec. Mex. 38:337-347. [ Links ]
Luenzzo, De O. R.; García, Von, P. R.; Balestre, M. and Ferreira, D. V. 2010. Evaluation of maize hybrids and environmental stratification by the methods AMMI and GGE biplot. Crop Breed. Appl. Biotechnol. 10:247-253. [ Links ]
CIBCEC (Cédulas de Información Básica para Centros Estratégicos Comunitarios). 2006. Microrregión 3 Cintalapa, Chiapas, SEDESOL. http://www.microrregiones.gob.mx. [ Links ]
Agrama, H. A. S. 1996. Sequential path analysis of grain yield and its components in maize. Plant Breed. 115:343-346. [ Links ]
Ángeles, A. H. H. 2000. Mejoramiento genético del maíz en México: el INIA, sus antecesores y un vistazo a su sucesor, el INIFAP. Agric. Téc. Méx. 26:31-48. [ Links ]
Márquez, S. F. 1991. Genotecnia vegetal: métodos, teoría, resultados. AGT Editor. México. Vol. 3. 500 p. [ Links ]
Mitrovic, B.; Stanisavijevi, D.; S. Treski, S.; Stojakovic, M.; Ivanovic, M.; Bekavac, B. and Rajkovic, M. 2012. Evaluation of experimental maize hybrids tested in multi-location trials using AMMI and GGE biplot analyses. Turk. J. Field Crops. 17:35-40. [ Links ]
Mohammadi, S. A.; Prasanna, B. M. and Singh, N. N. 2003. Sequential path model for determining interrelationships among grain yield and related characters in maize. Crop Sci. 43:1690-1697. [ Links ]
Nemati, A.; Sedghi, M.; Sharifi, R. F. and Seidi, M. M. 2009. Investigation of correlation between traits and path analysis of corn (Zea mays L.) grain yield at the climate of Ardabil region (northwest Iran). Notulae Botanicae Horti Agrobotanici Cluj-Napoca. 37:194-198. [ Links ]
Rashidi, N.; Reza, G. A.; Reza, N. M. and Darkhal, H. 2013. Evaluation of attributes association and path coefficients for ear yield in maize hybrids (Zea mays L.). Int. J. Farming Allied Sci. 2:1033-1036. [ Links ]
Reyes, M. C. A. y Cantú, A. M. A. 2006. Maíz. In: Rodríguez-del Bosque, L. A. (Ed.). 50 Años de Investigación Agropecuaria en el Norte de Tamaulipas, historia, logros y retos. INIFAP. Campo Experimental Río Bravo. Tamaulipas, México. Libro técnico núm. 1. 325 p. [ Links ]
Selvaraj, C. I. and Nagarajam, P. 2011. Interrelationship and path-coefficient studies for qualitative traits, grain yield and other attributes among maize (Zea mays L.). Int. J. Plant Breed. Gen. 5:209-223. [ Links ]
SIAP. 2016. Estadísticas de producción para el año agrícola 2014. Secretaría de Agricultura, Ganadería, Desarrollo Rural, Pesca y Alimentación. http://www.siap.gob.mx/index. [ Links ]
Tai, G. C. C. and Tarn, T. R. 2003. Evaluation of varieties: genotypes, environments and genotype-environment interactions. Acta Hortic. 619:31-34. [ Links ]
Vargas, H. M. y Crossa, J. 2000. El análisis AMMI y la gráfica del biplot en SAS. Unidad de biometría. CIMMYT, México. http://www.cimmyt.cgiar.org/biometrics. [ Links ]
Williams, W. A.; Demment, M. W. and Jones, J. N. 1990. Concise table for path analysis statistics. Agron. J. 82:1022-1024. [ Links ]
Whittaker, A.; Vazzana, C.; Vecchio, V. and Benedettelli, S. 2009. Evaluation of direct and indirect effects of flavonoids, mineral elements and dry weight on antiradical scavenging activity in leaf material of field-grown Trifolium pratense cultivars using path analysis. Field Crops Res. 113:1-11. [ Links ]
Yan, W.; Hunt, L. A.; Sheng, Q. and Szlavnics, Z. 2000. Cultivar evaluation and mega-environment investigation based on GGE biplot. Crop Sci. 40:597-605. [ Links ]
Yan, W.; Kang, M. S.; Ma, B.; Woods, S. and Cornelius, P. L. 2007. GGE Biplot vs. AMMI analysis of genotype-by-environment data. Crop Sci. 47:641-653. [ Links ]
Received: January 2017; Accepted: March 2017
 Este es un artículo publicado en acceso abierto bajo una licencia Creative Commons
