


Serviços Personalizados
Journal
Artigo
 texto em
  Inglês (pdf)
 Artigo em XML
 Referências do artigo
 Enviar este artigo por email
Indicadores
-
 Citado por SciELO
 -
 Acessos
Links relacionados
-
 Similares em
SciELO
Similares em
SciELO
Compartilhar

 Permalink
Revista mexicana de ciencias agrícolas
versão impressa ISSN 2007-0934
Rev. Mex. Cienc. Agríc vol.8 no.3 Texcoco Abr./Mai. 2017
https://doi.org/10.29312/remexca.v8i3.28
Articles
Size and number of wheat grains analyzed by digital image processing
1Colegio de Ciencias Agropecuarias-Facultad de Agricultura del Valle del Fuerte. Universidad Autónoma de Sinaloa. Calle 16 Av. Japaraqui, Juan José Ríos, Ahome, Sinaloa, México. CP. 81110. Tel. (687) 8960908. (saucedap@gmail.com; gabriel-lugo9010@hotmail.com; alreo.uas@gmail.com).
2Campo Experimental Valle de México- NIFAP. Carretera Los Reyes-Texcoco, km 13.5. Coatlinchán, Texcoco, Estado de México. CP. 56250. Tel. (595) 9212715, ext. 161.
3Universidad Tecnológica de Culiacán.Carretera Culiacán-Imala, km 2. Col. Los Ángeles, Ciudad Educadora del Saber, Culiacán Rosales, Sinaloa. CP. 80014. Tel. (667) 1041599. (parpolo@yahoo.com.mx).
4Colegio de Postgraduados Campus Montecillo. Carretera México-Texcoco, km 36.5. Montecillo, Texcoco, Estado de México. CP. 56230. Tel. (595) 9520200, ext. 1591. (vagh@colpos.mx).
The visual record of grain number and size uses limited samples, causing fatigue and increase of error; disadvantages that can be solved with the processing and analysis of digital images (PAID) as proposed in this paper. In this regard, seeds of five durum wheat cultivars (Triticum durum Desf.) and five of common wheat (Triticum aestivum L.) were used. Scanned images were obtained. The PAID was performed with ImageJ 1.49b, length, width, size and number of grains were measured in 317 samples. The time for grain registration was compared between visual counting, PAID and electromechanical counter. Correlation analyzes, X2, ANDEVA, and comparison of means were performed. The grain size of common wheat was from 15.41 to 18.37 mm2, in durum it went from 17.82 to 19.6 mm2 (DMS = 0.385, p≤ 0.01), these were longer (>7.1 mm; p≤ 0.01) but thinner (DMS = 0.043, p≤ 0.05). The number of grains observed and calculated showed concordance (X2= 2.73, p= 1) and close correlation (rs=1, p≤ 0.01). The counter and visual record of grains number showed linear increase of time as the sample size increased, while the PAID required approximately 55 s. Image processing facilitates the individual dimensions of pooled grains and is an accurate and fast tool for analyzing the size and number of wheat grains.
Keywords: Triticum aestivum; Triticum durum; grain counting; ImageJ; scanner
El registro visual del número y tamaño de grano utiliza muestras limitadas, provoca cansancio e incremento de error; inconvenientes que pueden solventarse con el procesamiento y análisis de imágenes digitales (PAID) propuesto en esta investigación. Para ello, se utilizaron semillas de cinco cultivares de trigo duro (Triticum durum Desf.) y cinco harineros (Triticum aestivum L.). Se obtuvieron imágenes con escáner. El PAID se realizó con ImageJ 1.49b, se midió largo, ancho, tamaño y número de granos en 317 muestras. El tiempo para el registro de granos se comparó entre conteo visual, PAID y contador electromecánico. Se efectuaron análisis de correlación, X2, ANDEVA, y comparación de medias. El tamaño de grano harinero fue de 15.41 a 18.37 mm2, en duros de 17.82 a 19.6 mm2 (DMS= 0.385, p≤ 0.01), éstos son más largo (>7.1 mm; p≤ 0.01), pero de menor ancho (DMS= 0.043, p≤ 0.05). El número de granos observados y los calculados presentaron concordancia (X2= 2.73, p= 1) y estrecha correlación (rs= 1, p≤ 0.01). El contador y el registro visual del número de granos mostraron incremento lineal de tiempo conforme aumentó el tamaño de muestra, mientras que el PAID requiere aproximadamente 55 s. El procesamiento de imágenes facilita las dimensiones individuales de granos agrupados y es una herramienta precisa y rápida para analizar el tamaño y número de granos de trigo.
Palabras clave: Triticum aestivum; Triticum durum; conteo de grano; escáner; ImageJ
Introduction
In the researches of physiology and genetic improvement of crops, samples are taken to record the number of grains per m2, per spike and the weight of one thousand grains, which are important variables to evaluate the interaction of the genotypes with the environment and to identify the outstanding ones (Pietragalla and Pask, 2013) and to know the mechanisms involved in grain production (Severini et al., 2011). In addition, hundreds of thousands of samples are counted and prepared to be sent to other screening and genotype selection sites; although the number of grains can be calculated with specialized computer systems or electromechanical counters, its cost make that in Mexico they have to be counted manually.
Samples of wheat grains are also used to evaluate size and shape, which are important objectives in the genetic improvement, but due to the difficulty of their measurement it has not been widely studied (Gegas et al., 2010). Size is a significant component of yield (Tanabata et al., 2012; Williams and Sorrells, 2014) and contributes to germination vigor (Whan et al., 2014); also, it is related to grinding quality (Williams et al., 2013). Manual quantification is usually accurate, but labor-intensive, tedious, and due to the time required, limited samples are used (Maloney et al., 2014).
Registering a thousand grains of wheat to obtain its weight can be speeded up by using trays with grates to separate 100 grains. Another option is to record (by hand or counter) and weigh only 200 grains, or, the number of grains in 10 g and the respective conversion is performed (Pietragalla and Pask, 2013), even so when counting is carried out continuously it causes fatigue and increased errors (Zhang et al., 2005). Mebatsion et al. (2013) indicate that the visual analysis of grains is subjective, influenced by human factors and working conditions.
The traditional recording of length and width of grains requires more labor-intensive techniques and individual measurement (Whan et al., 2014), with greater time consumption, even when digital calipers are used. Tanabata et al. (2005) suggest that these analyzes are more efficient, faster and more accurate through digital image processing and analysis (PAID) because it provides consistent, effective and objective information (Mebatsion et al., 2013). Advances in computational processors, in image acquisition systems and its price reduction, favor the implementation of PAID (Cleva et al., 2013).
The images with grains grouped or in contact with each other, make difficult the analysis (Mebatsion et al., 2013), ignoring or omitting such situation causes erroneous measurements (Lin et al., 2014). In order to avoid difficulties, in several papers on wheat grain measurement by PAID, these were placed separately (Mebatsion et al., 2013; Rasheed et al., 2014, Williams and Sorrells, 2014; Mussadiq et al., 2015). The physical separation of the grains by any means is impractical (Mebatsion et al., 2013), for the time required, but can be solved with the development of efficient algorithms to separate the grains in contact in the image (Lin et al., 2014). Another risk is sub or overestimate the number of grains; however, it can be reduced with restriction of size and circularity or shape of the objects of interest, if it is not among the specified values they are ignored (Ferreira and Rasband, 2012).
Due to the drawbacks of obtaining dimensions and manual recording of wheat grains, the objective in this paper was to analyze the size and number of wheat grains by digital image processing.
Materials and methods
The varieties used were Cirno C-2008, Roelfs F-2007, Kronstad F-2003 plus four lines of durum wheat and three of common wheat (Table 1), from the wheat breeding program of the Instituto Nacional de Investigaciones Forestales Agricolas y Pecuarias (INIFAP), which were harvested at the Valle del Fuerte Experimental Field (Guasave, Sinaloa) during the Fall-Winter 2012-2013 cycle.
Table 1 Identification of used genotypes.
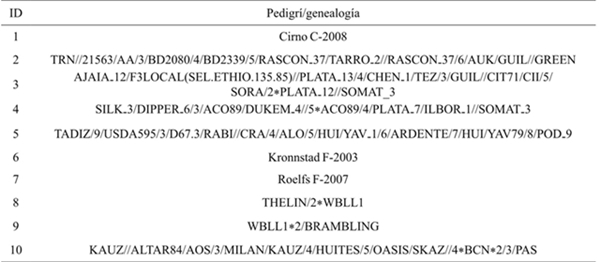
ID= identificación del genotipo; Triticum durum Desef. (1 al 5); Triticum aestivum L. (6 al 10).
The images were acquired with flatbed scanner (Epson Stylus model CX4700), the grain samples were quickly distributed on the glass, without being careful to separate them. Black foamy (ethylvinylacetate) paper was placed at the bottom of the scanner lid to prevent noise from projecting shadows caused by ambient light and allowing better grain contrast.
The images were saved in jpeg format, RGB color (Red, Green, Blue) with 24 bits per pixel and resolution of 300 dpi, of 2 444*3 508 pixels (width*height); the average file size was 760 KB. The time to digitize was 14.2 s and the total from placing the grain sample to the end was 55 s, on a computer with Windows 7 Ultimate (64 bits), AMD Phenom™ X3 B73 2.8 GHz processor and 3 GB of RAM.
The methodology was developed with four samples of 200 whole and clean grains of each variety and its weight were obtained. The method was validated with 277 samples of variable size of whole and broken grains, in total 317 images with 155 637 grains were used.
The PAID was performed with the ImageJ Ver. 1.49b program, which supports different image formats; it allows to establish and calibrate the scale in any spatial unit, allows to restrict objects by size and shape from 0 (elongated polygon) to 1 (spherical), provides descriptive statistics of the results (Rasband, 2014). It includes the option of creating routines or add-ons to automate repetitive tasks (Ferreira and Rasband, 2012) and is available free of charge from the National Institutes of Health website, Bethesda, Maryland, USA (http://rsbweb.nih.gov/ij /download.html).
The color segmentation of the images was done by thresholding of (Image/Adjust/Color Threshold), with the default method, which is a variation of the Isodata algorithm (Ferreira and Rasband, 2012); the original RGB color space was transformed into the HSB space, because it facilitated image analysis; that is, the identification and location of wheat grains. The differentiation between the background of the image and the grains was obtained by adjusting the minimum and maximum thresholds, for tone were 0 and 255, for saturation 0 and 255, and for brightness 75 and 255. Subsequently the image was converted to binary; that is, to black and white (Process/Binary /Convert to Mask). The separation of the grains in contact in the image was done with the algorithm of dividing transformation (Watershed), with tolerance of 1 (Process/Binary/Watershed).
The total number of whole and broken grains (NGC) was obtained with the Analyze/Analyze particles function and the projected size or area of grains (mm2), length (mm), width (mm) and shape (circularity). The overestimation of the grains total, caused by impurities or foreign objects, was reduced with size restriction (4 to 30 mm2) and by circularity, because the whole grain had the smallest circularity because it was elongated and ranged from 0.4 to 1, this would also include broken grains.
The steps described above were recorded and stored in a routine (macro), which allows to automatically calculate the scale of any image size by the width (getWidth) divided by the resolution, which in a scanned image with a scanner is 8.5 inches (215.9 mm) as a result of dividing 2 550 into 300 (pixels/inches per pixel). The routine automatically analyzes all the images contained within a folder, calculates the time spent in the processing and analysis with the instruction (getTime ()), the results are saved separately or in a single comma-delimited file, tagged with the file’s name (jpeg) in order to facilitate its identification.
An electromechanical, semiautomatic counter (NUMIGRAL SEED COUNTER EPL) was used to record 100, 200, 300, 400, 400, 500 and 600 grains in five replicates, these samples were counted by the PAID and in visual form (NGO). The total time (seconds) required by each method was recorded.
The data were analyzed with InfoStat 2014 (Di Rienzo et al., 2014) by means of tests of normality and homogeneity of variances, ANDEVA was performed for weight of 200 grains, grain length and grain width and Tukey mean comparison (p≤ 0.01; 0.05). The length grain variable did not show normality and a Kruskal-Wallis non-parametric analysis of variance was performed; the test statistic (H) was an approximation to the Pearson X2 at 1% (K-W≈X2), a comparison of pairs between the means of the treatment ranges was performed. Non-parametric Spearman correlations (rs) were performed between NGO and NGC, locally weighted regression (LOWESS), with smoothing parameter of 0.5 and goodness of fit test (X2). Descriptive statistics were obtained for the time required by the methods to record the number of grains.
Results and discussion
The mean grain size was 15.41 mm2 in the Kronnstad F2003 variety up to 19.6 mm2 in genotype 4 (DMS= 1.274, p≤ 0.0001), lines 5 and 8 excel in mean grain size, suggesting the effectiveness of the selection towards this characteristic; the size was higher in durum wheat grains with 17.82 to 19.6 mm2, while in common wheat it was from 15.41 to 18.37 mm2 (DMS= 0.3850, p≤ 0.0001), similar to those obtained by Visen et al. (2001) by analyzing digital photographs they obtained 22.5 mm2 of amber crystalline wheat from Western Canada (CWAD) and 17.59 mm2 in spring red wheats (HRS). Likewise, are within the range of 11.68 to 24.52 mm2 reported by Whan et al. (2014); but are larger than those obtained by Konopka et al. (2007) in the Nawra variety (12.6 to 15.91 mm2) grown in spring, and Sukces (13.28 to 14.74 mm2) and Tonacja (12.94 to 15.75 mm2) winter wheats. The variation in grain sizes between and within durum and common wheat analyzed in this research, as well as those reported by other authors, are due to the effect of the genotype, the environment and the interaction between them (Breseghello and Sorrels, 2006).
Genotype 10 showed a shorter grain length (6.1 to 6.2 mm) and the longest (7.6 to 7.8 mm) were shown by genotype 4 (H= 37.81, p≤ 0.0001); all durum wheats were over 7.1 mm long, while in common wheats the lengths were less than 7.06 mm (H= 29.27, p≤ 0.001). The length of durum wheat grain was from 7.1 to 7.8 mm, similar length than that obtained by Konopka et al. (2007) in the Nawra variety (7.03 to 7.25 mm), Sukces (6.55 mm) and Tonacja (6.86 mm); although they are longer than those reported by Ramya et al. (2010) in two locations in India (Ludhiana, Punjab and Pune, Maharashtra), and five cycles of common wheat production ranged from 5.1 mm to 5.37 mm. But they are shorter than those reported by Okamoto et al. (2013) in four hexaploid wheat lines, with the Smartgrain software obtained from 8.40 to 9.48 mm; the grain length of common wheat in this research (6.14 - 7.06 mm) were lower than those reported by Visen et al. (2001) in CWAD wheat (8.03 mm) and HRS wheat (6.99 mm).
The mean grain width in common wheat was 3.37 mm and in durum wheat of 3.33 mm (DMS= 0.043, p≤ 0.05). Genotypes 8 and 10 showed wider grain (3.47 mm); while the thinner grain (3.19 mm) was show by the Kronnstad F2003 variety (DMS= 0.191, p≤ 0.1). Mean values of grain width were from 3.19 to 3.47 mm and were consistent with those obtained by Rasheed et al. (2014), from 2.8 to 3.8 mm in AUS30288 and AUS34239 genotypes, respectively. Although they are slightly wider than those reported by Visen et al. (2001) in wheat grains CWAD (3.27 mm) and HRS (2.91 mm); as well as those obtained in the Nawra variety (2.41 mm) and Tonacja (3.04 mm) through digital photographs and the use of the LUCIA G ver. 4.8 software (Konopka et al., 2007); Ramya et al. (2010) have reported the thinnest (2010) in Pune, Maharashtra, India, where in 2007 it was 2.17 mm and in Ludhiana, Punjab in 2003 was 2.97 mm. Also, Okamoto et al. (2013) obtained less wide grains that were from 2.86 to 3.16 mm.
The grain size in emmer or farro wheat varieties (Triticum dicoccum Schübl) of 12.4 mm2 and the width of 2.37 mm (Braadbaart and van Bergen, 2005), are smaller in comparison with those obtained in this paper and those reported by others, it is possible that this is because those are ancestral wheats and the increase in grain size is due in part to the evolutionary process (Eckardt, 2010) and genetic enhancement (Gegas et al., 2010). Shouche et al. (2001) also obtained a narrower grain (2.02 mm), shorter (4.48 mm) and a smaller grain size (14.15 mm2) in the Kalyansona semi-dwarf variety (Triticum aestivum L.) in studies by Shouche et al. (2001) and Braadbaart and van Bergen (2005) the grain was placed on the scanner with the ventral side downwards, which is narrower and projects smaller area, however the grain length is not affected by this situation, since the dimensions are related to each other, the side of the grain should be considered for the measurement of the width. This aspect was not considered in this paper, because of the sharp form of the dorsal part of the grain of the genotypes used, the probability of this being on its side view is 2:3 (two sides and ventral part).
The grain length in emmer wheat varieties was 7.14 mm (Braadbaart and van Bergen, 2005), similar to those obtained in this research and those reported by other authors (Visen et al., 2001; Konopka et al., 2007), according to Sadras and Egli (2008), the grain length takes less time to define itself with respect to the width, reason why it is less exposed to the influence of the environment; which is confirmed by Konopka et al. (2007), who point out that the length of wheat grain is less affected by water stress; in several studies, the greater variation in grain width, with respect to length, is evident (Visert et al., 2001; Breseghello and Sorrels, 2006; Ramya et al., 2010; Wiwart et al., 2012; Williams et al., 2013). The shape or circularity of the grain was higher in common wheat (0.7) and lower in durum wheat (0.66); genotype 10 presented the highest grain circularity with 0.74.
The weight of 200 grains in durum wheats was of 8.42 to 11.25 g and they differ to the common that ranged from 6.19 to 9.79 g (DMS= 0.411, p≤ 0.01). The Kronnstad F-2003 variety showed the lowest mean grain weight (7 g), while the genotype four stood out with 10.42 g (DMS= 1.362, p≤ 0.01). The weight of 200 grains had positive linear correlation with size (r= 0.94, p≤ 0.01), with length (rs = 0.79, ≤ 0.01) and the grain width (r= 0.63, ≤ 0.01), these agrees with Gegas et al. (2010) and Okamoto et al. (2013), as well as Ramya et al. (2010), who point out that the weight of wheat grain has a close relation with the length and width of the grain. The grain size correlated with length (rs= 0.85, p≤ 0.01) and grain width (r= 0.47, p≤ 0.01), but there was no relationship between grain length and width (p= 0.76). The absence of relation between length and width of the grain in this paper can be attributed to the arbitrary placement of the grains on the scanner glass, because it is contrary to what was reported when the grain width was obtained in a systematic way, as in the comparison between the length and width of wheat grain obtained with vernier (Ramya et al., 2010) and when digital photographs of the dorsal part of separately placed grains were used (Rasheed et al., 2014).
The difference between the number of grains observed and calculated was from -1.5 to 1.68% ( X= 0.13 ± DE= 0.52%) and presented concordance (X2= 2.73, p= 1.0), with a close correlation between both variables (rs= 1.0, p≤ 0.01, Figura 1). 32.2% of the cases were ties, 60.2% with percentages smaller than one, although in 42.6% of cases the number of grains was overestimated; the sub and overestimations greater than one were shown in 6% of the cases (Figure 2). The underestimation of the number of grains obtained through the PAID occurred because the watershed algorithm did not separate a pair of grains in contact, so it counted them as one, or excluded them due to the restriction by size; on the other hand, the overestimation was due to the fact that the whole grain was divided in two, due to the shape of the grain, since this situation happened in isolated grains or in contact, so in no case influenced the size of the sample, contrary to that indicated by Severini et al. (2011) (Zea mays L. var. Everta) using digital photographs (between 100 and 700 grains per image) and the use of ImageJ, observed that in small samples there was underestimation and overestimation in large samples.
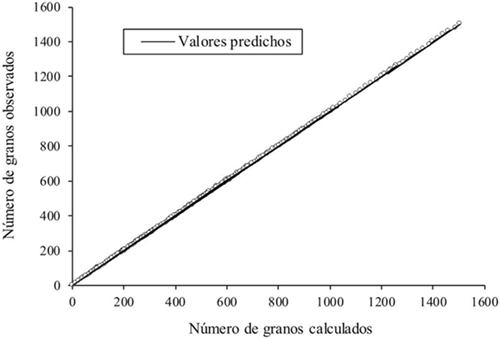
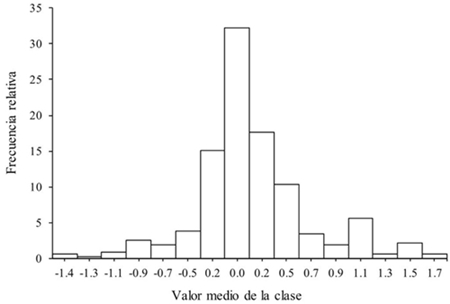
Figure 2 Frequency distribution of the relative error between number of grains observed and calculated.
The percentage differences are larger when the number of grains contained in the sample is less than 500, when this quantity is exceeded, the relative error is less than one (Figure 3). The reduction of the mean relative error between the number of grains observed and those calculated as the sample size increases indicates that the number of under and overestimated grains is maintained, according to Maloney et al. (2014), accuracy increases to a larger sample size and indicate that a limiting factor is the amount of grains that can be captured in an image, which depends on the digital camera and its configuration, on the capacity of the container where the samples are placed. This amount also depends on the size of the grain, in the observations of this research with the flatbed scanner used, about 2 000 grains fit randomly distributed without touching the edges of the glass.

The method based on PAID is able to separate the grains in contact with a minimum effectiveness of 98.32%, a result superior to 25 and 90% reported by Faessel and Courtois (2009) in rice (Oryza sativa L), with the use of Watershed algorithms and y Gap-Filling respectively, implemented in ImageJ, is slightly higher than 97.3% in western Canadian red wheat (CWRS) and 96.1% in CWAD wheat, obtained by Zhang et al. (2005) using segmented image analysis with the ellipses fitting algorithm, programmed in Visual C++® (Microsoft Corporation, Redmond, Washington, USA). It is within the precision values indicated by Mebatsion and Paliwal (2011), who obtained 99.5% in CWAD, 97.5% in CWRS, oats and rye 97% and 96.5% in barley, using digital photographs and contour plotting algorithms (Elliptic Fourier) in Matlab 7.9® (The Math Works, Natick, USA). The effectiveness in the separation of the grains in contact also depends on the contrast between the color of the grain and the background, the quality of the image and the process prior to the application of the separation algorithm used. Lin et al. (2014) indicate that the errors in the segmentation of the image are mainly due to the noise during the obtaining of the image.
The time to process the images was 1.71 to 4.59 s, with samples of up to 1 500 grains, and showed a positive linear response with the sample size (R2= 0.94, p≤ 0.01). The average time for processing was 2.62 s, and for the entire process including the scanning was 55 s for any amount of grain that contains the scanner surface, while visually and with the electromechanical counter there is a linear increase according to the increases in the sample size (Table 2). The processing time also depends on the size or resolution of the image, the number of grains and the number of contact between them, program and computer equipment used. Grayscale images or resolutions less than 300 dpi require less time for scanning and processing. Lin et al. (2014) reported 4.3 s in the Matlab R2009a® program to process images (1200 ppi) of samples of 100 grains of rice, with different grains in contact. Faessel and Courtois (2009) indicate 8 s to process samples with around 200 grains of rice, in images of 300 dpi and grayscale. Severini et al. (2011) indicate approximately 120 s per sample, from taking digital photographs to PAID with ImageJ to account for maize grains (Zea mays L. var. Everta).
Table 2 Descriptive statistics of the time (s) required by the electromechanical meter, with PAID and in visual form (individual 1 and 2).
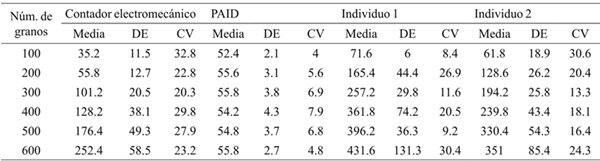
n= 5; DE= desviación estándar; CV= coeficiente de variación.
The visual method requires more time to register 100 grains or more, the electromechanical counter is faster counting 100 grains and the same as the PAID to record 200, but increases to almost double from 300 grains and presented the showed the biggest coefficient of variation (Table 2), because the grain movement in the counter is not constant, it is reduced as the sample in the container decreases, also occurs when the button is not pressed firmly or when it is unintentionally stopped. It also requires completely clean grain samples, because the sensor registers small impurities. The standard deviation of the time required for visual and counter recording of the number of grains increased to a larger sample size, which is indicative of fatigue, according to Mascord and Heath (1992), the standard deviation and the time it takes for individuals to react, increases as time performing a monotonous and repetitive task increases.
The size restriction allowed to classify the grains, the completes were from 14.2 to 30 mm2, the brokens and small were from 4 to 14.1 mm2, so that the criterion to consider all of them was from 4 to 30 mm2 and circularity from 0.4 to 1, the circularity and the length of the grain allows to separate between small and broken grains, these last have smaller length and circularity above 0.8, this last characteristic is useful to reinforce the analysis of physical quality of the grain, since a criterion used to classify the wheat grain as broken, is when it measures less than – parts of the average length of complete grains (Punn and Bhalla, 2013).
Conclusions
Digital image processing and analysis (AID) accurately records the number of wheat grains and allows to obtain their individual dimensions even though these in the image are in contact with each other. The difference between the number of grains observed and calculated decreases with the increase in sample size; the speed is also higher with respect to the manual counting when the samples have a hundred grains or more, and from two hundred it surpasses the electromechanical counter, which represents an advantage in saving time.
Literatura citada
Braadbaart, F. and van Bergen, P. F. 2005. Digital imaging analysis of size and shape of wheat and pea upon heating under anoxic conditions as a function of the temperature. Vegetation History and Archaeobotany. 14:67-75. [ Links ]
Breseghello, F. and Sorrells, M. E. 2006. Association mapping of kernel size and milling quality in wheat (Triticum aestivum L.) cultivars. Genetics Society of America. 172:1165-1177 [ Links ]
Cleva, M. S.; Sampallo, G. M.; González, T. y Acosta, C. A. 2013. Método para la determinación del volumen de una muestra de granos de arroz mediante el procesamiento digital de imágenes. Rev.Investig. Agrop. 39(2):185-190. [ Links ]
Di Rienzo, J. A.; Casanoves, F.; Balzarini, M. G.; González, L.; Tablada,M. y Robledo, C. W. 2014. Grupo InfoStat, FCA. Universidad Nacional de Córdoba, Argentina. 431 pp. [ Links ]
Eckardt, N. A. 2010. Evolution of domesticated bread wheat. Plant Cell.22(4):993. [ Links ]
Faessel, M. and Courtois, F. 2009. Touching grain kernels separation by gap-filling. Image Analysis and Stereology. 28:195-203. [ Links ]
Ferreira, T. and Rasband, W. S. 2012. ImageJ user guide: IJ 1.46 r.Bethesda, MD: National Institutes of Health. 185 p. [ Links ]
Gegas, V. C.; Nazari, A.; Griffiths, S.; Simmonds, J.; Fish, L.; Orford,S.; Sayers, L.; Doonan, J. H. and Snape, J. W. 2010. A genetic framework for grain size and shape variation in wheat. Plant Cell. 22:1046-1056. [ Links ]
Konopka, I.; Tanska, M.; Pszczołkowska, A.; Fordonski, G.; Kozirok,W. and Olszewski, J. 2007. The effect of water stress on wheat kernel size, color, and protein composition. Polish J. Natural Sci. 22:157-171. [ Links ]
Lin, P.; Chen, Y. M.; He, Y. and Hu, G. W. 2014. A novel matching algorithm for splitting touching rice kernels based on contour curvature analysis. Computers and Electronics in Agriculture Journal. 109:124-133. [ Links ]
Maloney, P. V.; Petersen, S.; Navarro, R. A.; Marshall, D.; McKendry, A.L.; Costa, J. M. and Murphy, J. P. 2014. Digital image analysis method for estimation of fusarium-damaged kernels in wheat.Crop Sci. Soc. Am. 54:2077-2083. [ Links ]
Mascord, D. J. and Heath, R. A. 1992. Behavioral and physiological índices of fatigue in a visual tracking task. J. Safety Res. 23:19-25. [ Links ]
Mebatsion, H. K.; Paliwal, J. and Jayas, D. S. 2013. Automatic classification of non-touching cereal grains in digital images using limited morphological and color features. Computers and Electronics in Agriculture Journal. 90:99-105. [ Links ]
Mebatsion, H. K. and Paliwal, J. 2011. A Fourier analysis based algorithm to separate touching kernels in digital images. J. Bio. Eng. 108:66-74. [ Links ]
Okamoto, Y.; Nguyen, A. T.; Yoshioka, M.; Iehisa, J. C. and Takumi, S.2013. Identification of quantitative trait loci controlling grain size and shape in the D genome of synthetic hexaploid wheat lines. Breed. Sci. 63:423-429. [ Links ]
Pietragalla, J. and Pask, A. J. D. 2013. Rendimiento de grano y componentes del rendimiento. In: fitomejoramiento fisiológico II: una guía de campo para la caracterización fenotípica de trigo. Pask, A. J. D.; Pietragalla, J.; Mullan, D. M.; Chávez-Dulanto, P. N. y Reynolds, M. P. (Eds.). Centro Internacional de Mejoramiento de Maíz y Trigo (CIMMYT). México, D. F.95-103 pp. [ Links ]
Punn, M. and Bhalla, N. 2013. Classification of wheat grains using machine algorithms. Int. J. Sci. Res. 2(8):363-365. [ Links ]
Ramya, P.; Chaubal, A.; Kulkarni, K.; Gupta, L.; Kadoo, N.; Dhaliwal, H.S.; Chhuneja, P.; Lagu, M. and Gupta, V. 2010. QTL mapping of 1000-kernel weight, kernel length, and kernel width in bread wheat (Triticum aestivum L.). J. Appl. Gen. 51(4):421-429. [ Links ]
Rasband, W. S. 2014. ImageJ; U. S. National institutes of health. Bethesda.Maryland, USA. http://ImageJ.nih.gov/ij/ 1997-2014. [ Links ]
Rasheed, A.; Xia, X.; Ogbonnaya, F.; Mahmood, T.; Zhang, Z.; Mujeeb-Kazi, A. and He, Z. 2014. Genome-wide association for grain morphology in synthetic hexaploid wheats using digital imaging analysis. BMC Plant Biol. 14(1):128. [ Links ]
Sadras, V. O. and Egli, D. B. 2008. Seed size variation in grain crops:allometric relationships between rate and duration of seed growth. Crop Sci. Soc. Am. 48:408-416. [ Links ]
Severini, A. D.; Borrás, L. and Cirilo, A. G. 2011. Counting maize kernels through digital image analysis. Crop Sci. Soc. Am.51:2796-2800. [ Links ]
Shouche, S. P.; Rastogi, R.; Bhagwat, S. G. and Sainis, J. K. 2001. Shape analysis of grains of Indiana wheat varieties. Computers and Electronics in Agriculture Journal. 33:55-76. [ Links ]
Tanabata, T.; Shibaya, T.; Hori, K.; Ebana, K. and Yano, M. 2012.SmartGrain: highthroughput phenotyping software for measuring seed shape through image analysis. Plant Physiol.160:1871-1880. [ Links ]
Visen, N. S.; Shashidhar, N. S.; Paliwal, J. and Jayas, D. S. 2001.Identification and segmentation of occluding groups of grain kernels in a grain sample image. J. Agric. Eng. Res. 79(2):159-166. [ Links ]
Whan, A. P.; Smith, A. B.; Cavanagh, C. R.; Ral, J.-P. F.; Shaw, L. M.;Howitt, C. A. and Bischof, L. 2014. GrainScan: a low cost; fast method for grain size and colour measurements. Plant Methods. 10:23. [ Links ]
Williams, K. and Sorrells, M. E. 2014. Three-dimensional seed size and shape QTL in hexaploid wheat (Triticum aestivum L.)populations. Crop Sci. Soc. Am. 54:98-110. [ Links ]
Williams, K.; Munkvold, J. and Sorrells, M. E. 2013. Comparison of digital image analysis using elliptic Fourier descriptors and major dimensions to phenotype seed shape in hexaploid wheat (Triticum aestivum L.). Euphytica. 190:99-116. [ Links ]
Wiwart, M.; Suchowilska, E.; Lajszner, W. and Graban, Ł. 2012.Identification of hybrids of spelt and wheat and their parental forms using shape and color descriptors. Computers and Electronics in Agriculture. 83:68-76. [ Links ]
Zhang, G.; Jayas, D. S. and White, N. D. G. 2005. Separation of touching grain kernels in an image by ellipse fitting algorithm. J. Bio. Eng. 92(2):135-142. [ Links ]
Received: January 2017; Accepted: March 2017
 Este es un artículo publicado en acceso abierto bajo una licencia Creative Commons
