


Serviços Personalizados
Journal
Artigo
 texto em
  Inglês (pdf)
 Artigo em XML
 Referências do artigo
 Enviar este artigo por email
Indicadores
-
 Citado por SciELO
 -
 Acessos
Links relacionados
-
 Similares em
SciELO
Similares em
SciELO
Compartilhar

 Permalink
Revista mexicana de ciencias agrícolas
versão impressa ISSN 2007-0934
Rev. Mex. Cienc. Agríc vol.8 no.2 Texcoco Fev./Mar. 2017
https://doi.org/10.29312/remexca.v8i2.62
Investigation notes
Resistance to drought in soybean genotypes considering morphological, physiological and agronomic characters
1Campo Experimental Las Huastecas-INIFAP. Carretera Tampico-Mante, km 55. Villa Cuauhtémoc, Altamira, Tamaulipas. CP. 89610. Tel. (01) 800 0882222, ext. 83319 y (01) 55 38718700.
2Colegio de Postgraduados en Ciencias Agrícolas. Carretera México-Texcoco, km 36.5. Montecillo, Texcoco, Edo. de México. CP. 56230. Tel. (01) 595 9520200, ext. 1559.
To characterize the resistance to drought in 25 soybean genotypes considering the yield, its components and other morphological and physiological characteristics, a test was established during the autumn-winter cycle 2012-2013 in Altamira, Tamaulipas. Two drought levels were compared: with and without drought; the moisture deficiencies were applied during the reproductive stage of the crop. The experimental design was divided plots with two replicates, large plots for drought levels and subplots for genotypes. There were 12 related variables with soil moisture and the phenological behavior, morphological, physiological and agronomic of plants. The stress response was evaluated using the drought resistance model 2, which separates the effects by classifying precocity groups. The genotypes presented different responses to face the drought. The drought significantly affects the rate of chlorophyll, stomatal conductance, pods m-1 and 100 seed weight, which together decreased performance. The decreased yield was more intense in late genotypes. The most resistant genotypes to drought according to the model used were H02-2295, H98-1240 and H10-0556.
Keywords: Glycine max L. (Merr.); phenotypic characterization; yield and its components; model 2 drought resistance
Para caracterizar la resistencia a sequía en 25 genotipos de soya considerando el rendimiento, sus componentes y otras características morfológicas y fisiológicas, se estableció un ensayo durante el ciclo otoño-invierno 2012-2013 en Altamira, Tamaulipas. Se compararon dos niveles de sequía: con y sin sequía; las deficiencias de humedad se aplicaron durante la etapa reproductiva del cultivo. El diseño experimental fue parcelas divididas con dos repeticiones, las parcelas grandes para los niveles de sequía y las subparcelas para los genotipos. Se registraron 12 variables relacionadas con la humedad del suelo y el comportamiento fenológico, morfológico, fisiológico y agronómico de las plantas. La respuesta al estrés se evaluó con el modelo 2 de resistencia a sequía, que separa los efectos clasificando grupos de precocidad. Los genotipos presentaron respuestas diferentes para la sequía. La sequía afectó significativamente el índice de clorofila, la conductancia estomática, las vainas m-1 y el peso de 100 semillas, que en conjunto disminuyeron el rendimiento. El decremento del rendimiento fue más intenso en genotipos tardíos. Los genotipos más resistentes a sequía fueron H02-2295, H98-1240 y H10-0556.
Palabras clave: Glycine max L. (Merr.); caracterización fenotípica; modelo 2 de resistencia a sequía; rendimiento y sus componentes
The soybeans are grown mainly in North America, South America and Asia; The United States of America and Brazil are the most producing and exporting countries (Kumudini, 2010). In Mexico, production is concentrated in the south of Tamaulipas with an average yield above 1.5 t ha-1. However, Maldonado et al. (2013) mentioned that during 2011, the average yield was 0.96 t ha-1 due to the drought that prevailed during the reproductive stage of the crop. Since according to Liu et al. (2003) Liu et al. (2003), flowering, pod formation and grain filling are the most susceptible phases of this adverse factor.
The drought is the main limitation in food production worldwide, so resistance to this factor has been studied extensively in different crops. Muñoz (1992) stated that drought resistance is the ability of the plant to accumulate energy against the adverse factor, which can be measured by model 1, which states that the resistance is a function of the generic effects estimated by the component G (genotype) and the specific effects to drought estimated by the G*S component (genotype*drought).
Therefore, the most resistant varieties will be those with the highest proportion of the two. The model 2 was then established (Muñoz, 1997), considering that resistance to drought is not constant throughout the plant cycle, since if early, intermediate and late genotypes are sown at a given date, a drought occurs when Precocious variety is flourishing, its response will not be comparable with the intermediate or the late, because the phenomenon did not affect the same ontogenetic development.
In Mexico, Gill et al. (2008) identified under greenhouse conditions soybean genotypes to derive lines with combined resistance characteristics: a water deficit and Macrophomina phaseolina. However, the selection of drought resistant genotypes under field conditions has not been explored. Therefore, the objective of this research was to characterize the resistance to drought in 25 national soybean genotypes, considering the yield, its components and other morphological and physiological characteristics.
The experiment was established in Altamira, Tamaulipas. The precipitation was 20 mm during the evaluation cycle: December 2012 To April 2013. The averages of maximum and minimum temperatures were 26.8 and 15.2 °C respectively. An experimental design was used with two replications divided (Sloane et al., 1990) plots. The drought levels corresponded to the large plots and to the subplots the genotypes. The experimental unit was two rows of 5 m. The germplasm used were four varieties generated by INIFAP for the humid tropics of Mexico and 21 advanced lines of the soybean breeding program of the same Institute.
Two drought levels were compared: without drought (S0) and with drought (S1). In S1 five drip irrigations were applied at 30 days after sowing (DDS), irrigation was suspended (beginning of the reproductive period). In S0 it continued to be irrigated to 100 DDS. In each experimental unit, the volumetric water content (CVA) was measured at 60 DDS and expressed in%. Full bloom (DR2) and physiological maturity (DR7) days were also recorded; height of plant to full bloom (AR2) and beginning of physiological maturity (AR7); chlorophyll index (CL90) and stomatal conductance (CE90), both at 90 DDS; harvested plants (PLC); plants (PxM) and pods m-1 (VxM); weight of 100 seeds (P100S) and yield (REND). It should be noted that CL90 and CE90 were measured only in the intermediate and late genotypes, since at 90 DDS the precocious had total wilt or leaf senescence; PxM and VxM were not counted in the late group.
The stress response was evaluated with model 2 drought resistance (Muñoz, 1997):
The differences humidity at 60 DDS is only presented between levels of S and were highly significant (p≤ 0.01): in S0 the CVA averaged 49.9% and S1 29.6%. In contrast, the CVA between the experimental units assigned to the genotypes was not significant.
The effect of S in early genotypes showed highly significant differences (p≤ 0.01) in four of the seven variables evaluated: S1 reduced by 41.5% the REND, the above as a result of decreased PLC, VxM and P100S. Accordingly, Desclaux et al. (2000) indicated that the number of pods per unit of vegetative dry matter was significantly affected by drought also noted that stress in early stage of grain filling reduced the number of seeds plant-1, while stress in late stage caused a decrease in the weight of the grain.
As for the effect of G, the differences were highly significant (p≤ 0.01) for AR2, AR7 and PLC, and significant (p≤ 0.05) for VxM and P100S, although VxM Tukey test did not separate groups. The H02-1991 genotype reached the highest REND which was 1145.2 kg ha-1, but it was not statistically different from the others. The Figure 1 shows the interaction S*G, reflecting the specific effects to drought of the early genotypes selected by greater proportion of generic effects in REND. According to model 1 to evaluate drought resistance (Muñoz, 1992), H02-2295 was the genotype that decreased less its REND when passing from S0 to S1, so it is inferred that it has a greater proportion of genetic effects specific to drought than allows you greater stability with or without moisture deficit.
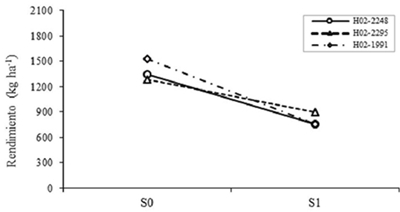
Figure 1 Effect of the levels interaction of drought for genotypes on the performance of early, selected based on generic effects. S0= no drought; S1= with drought.
Between levels of S in the intermediate genotypes, differences in CL90, CE90, VxM, P100S and REND were highly significant (p≤ 0.01). The characters that showed the most noticeable reductions due to S1 were VxM, CL90, P100S and CE90, thus reducing the REND by 48.7%. Studies Makbul et al. (2011) determined that chlorophyll content and stomatal conductance were reduced by 42% in drought-stressed soybean. Meanwhile, Sadeghipour and Abbasi (2012) confirmed that drought decreases, between 24 and 50%, the yield of soybeans both in the field and in the greenhouse. Considering the effect of G, it was highly significant (p≤ 0.01) in most of the variables, except for CE90 and VxM. The genotypes with the highest REND were H02-1656, H98-1240, Huasteca 400 and H06-0560. Of these, H98-1240 was the one of greater stability when passing from S0 to S1, whereas H02-1656 presented specific effects for favorable conditions (Figure 2); that is, for environments where most of the years are good in terms of rainfall.
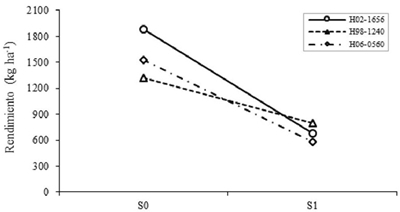
Figure 2 Effect of the levels interaction of drought for genotypes on the performance of intermediate selected based on generic effects. S0= no drought; S1= with drought.
For late, the effect of S was highly significant (p≤ 0.01) in CL90, CE90 and REND, and significant (p≤ 0.05) in P100S. As with the intermediates, S1 reduced the level of CL90 and CE90, in this case by 21% and 51.1%, respectively. It also affected the P100S by 34.6% and together they decreased the REND by 60.9%. According Ku et al. (2013), the stages most sensitive to soybean drought vary according to latitudes and cultivars; so Eck et al. (1987) found in the Douglas cultivar that drought reduced REND by 45% and 88% when stress was applied at R5 (start of seed formation) and R7 (start of ripening) respectively. The effect of G in the late group was significant (p≤ 0.05) only for CE90 and AR7. The REND biggest was for H10-0556 with 1267.3 kg ha-1, although the analysis of variance and Tukey test indicated that was no different from other genotypes.
Unlike this study Chinchilla et al. (1990) concluded that soybean varieties differed in the ability to maintain REND under limited moisture conditions, and could be selected for their tolerance to drought. However, the separation of effects proposed by Muñoz (1997) was not done. In the case of stomatal conductance, they have been widely reported genotypic differences to keep stomata open despite drought stress (Vignes et al., 1986). In this case the REND interaction in the total of the genotypes was plotted, because the group was composed of few members.
No specific effects to drought were observed, which can be seen by the parallelism of the lines of H10-0556 with that of the remaining genotypes (Figure 3). This suggests, according to Muñoz (1974), that this behavior is due to the additive action of the effect of S and the effect of G and not by the multiplicative action of the two factors. So in this case, it is better to select by generic effects. The genotype H10-0556 was superior in both S0 and S1 (Figure 3), being able to be selected as resistant considering the generic effects; While in the other genotypes, H10-0242 decreased less the REND from S0 to S1 (Figure 3), due to a higher efficiency of CL90, CE90 and P100S.
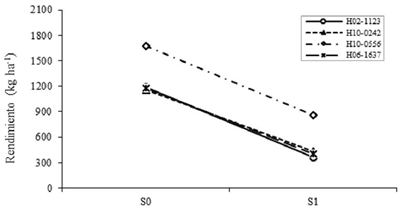
Figure 3 Effect of the levels interaction of drought for genotypes on the performance of late yield. S0= no drought; S1= with drought.
When comparing the effect of S between precocious groups (Table 1), P100S and REND decreased more drastically in the three: the second decreased less in the early and more in the late ones, considering the application of model 2 (Muñoz, 1997).
Table 1 Effect of drought in percentage [(S0 - S1)/S0)*100] on each of the variables evaluated genotypes early, intermediate and late soybeans.
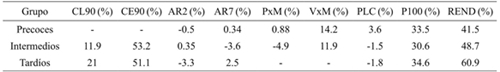
CL90= clorofila a los 90 DDS; CE90= conductancia estomática a los 90 DDS; AR2= altura a R2; AR7= altura a R7; PxM= plantas m-1; VxM= vainas m-1; PLC= plantas cosechadas; P100S= peso de 100 semillas; REND= rendimiento.
In the case of CL90 and CE90 they showed important reductions in the intermediate and late, indicating that they are very sensitive characteristics to the water deficit in soybean: CL90 decreased almost twice in the late ones than in the intermediates, whereas the reduction of CE90 was similar in both groups, showing that the effect on perspiration is not determined by differences in phenological development. The decrease in P100S was more or less stable in three groups, probably because the grain density depended rather on the effect of G and S and not on the phenotype cycle of the genotypes. It should be noted that in some variables, S1 caused a positive effect (negative values), but the increase is not appreciable.
Conclusions
The genotypes presented different responses to face the drought. The most sensitive to stress characteristics were chlorophyll index, stomatal conductance, pods m-1, 100 seed weight and performance. The decrease in yield from drought was more intense in late genotypes. The separation of effects by precocity groups proposed by the drought resistance model 2 identified H02-2295 (early), H98-1240 (intermediate) and H10-0556 (late) as the most stress resistant genotypes.
Literatura citada
Chinchilla, R. G. 1990. Tolerancia de la soya [Glycine max (L.) Merr] a la sequía. Rev. ICA. 25: 283-292. [ Links ]
Desclaux, D.; Huynh T. T. and Roumet P. 2000. Identification of soybean plant characteristics that indicate the timing of drought stress. Crop Sci. 40: 716-722. [ Links ]
Eck, H. V.; Mathers A. C. and Musick J. T. 1987. Plant water stress at various growth stages and growth and yield of soybeans. Field Crop Res. 17:1-16. [ Links ]
Gill, L. H. R.; Maldonado M. N.; Pecina Q. V. y Mayek P. N. 2008. Reacción de germoplasma mejorado de soya [Glycine max (L.) Merr.] a Macrophomina phaseolina (Tassi) goidanich y déficit hídrico. Rev. Mex. Fitopatol. 26:105-113. [ Links ]
Ku, Y. S.; Au, Y. W. K.; Yung, Y. L.; Li, M. W.; Wen, C. Q.; Liu, X. and Lam, H. M. 2013. Drought stress and tolerance in soybean. In: Board J. E. (editores). A comprehensive survey of international soybean research - Genetics, physiology, agronomy and nitrogen relationships. InTech, Croatia. 209-237 pp. [ Links ]
Kumudini, S. 2010. Soybean growth and development. In: Singh, B. (ed.). The soybean: botany, production and uses. CAB International. Oxfordshire, U. K. 48-73 pp. [ Links ]
Liu, F.; Andersen M. N. and Jensen C. R. 2003. Loss of pod set caused by drought stress is associated with water status and ABA content of reproductive structures in soybean. Funct. Plant Biol. 30: 271-280. [ Links ]
Maldonado, M. N.; Ascencio L. G.; Espinosa V. G. y Peña del R. M. A. 2013. Estrategias tecnológicas para contrarrestar la sequía en la producción de soya en el sur de Tamaulipas. INIFAP. México. 65 p. [ Links ]
Makbul, S.; Saruhan G. N.; Durmuş N. and Güven S. 2011. Changes in anatomical and physiological parameters of soybean under drought stress. Turk. J. Bot. 35: 369-377. [ Links ]
Muñoz, O. A. 1974. Tamaño de la parcela, diseño y usos de los factoriales en la experimentación agrícola. Folleto Misceláneo No. 25. Instituto Nacional de Investigaciones Agrícolas, SAG. México. 38 p. [ Links ]
Muñoz, O. A. 1992. Modelo uno o de interacción genotipo por niveles de sequía y resistencia a factores adversos. In: Memoria del Simposio Interacción Genotipo-Ambiente en Genotecnia Vegetal. 22-27 de marzo. Sociedad Mexicana de Fitogenética, Guadalajara Jalisco, México. 261-266 pp. [ Links ]
Muñoz, O. A. 1997. Model 2 to select for drought tolerance. In: Edmeades, G. O, M. Bäzinger, H. R. Mickelson, and C. B. Peña V. (eds). Developing drought - and low N - tolerant maize. Proceedings of a symposium. CIMMYT. México, D. F. 541-543 pp. [ Links ]
Sadeghipour, O. and Abbasi S. 2012. Soybean response to drought and seed inoculation. World Appl. Sci. J. 17:55-60. [ Links ]
Sloane , R. J.; Patterson R. P. and Carter T. E. 1990. Field drought tolerance of a soybean plant introduction. Crop Sci. 30:118-123. [ Links ]
Vignes, D.; Djekoun, A. and Planchon, C. 1986. Reponses de differents genotypes de soja au deficit hydrique. Can. J. Plant Sci. 66:247-255. [ Links ]
Received: January 2017; Accepted: March 2017
 Este es un artículo publicado en acceso abierto bajo una licencia Creative Commons
