


Serviços Personalizados
Journal
Artigo
 texto em
  Inglês (pdf)
 Artigo em XML
 Referências do artigo
 Enviar este artigo por email
Indicadores
-
 Citado por SciELO
 -
 Acessos
Links relacionados
-
 Similares em
SciELO
Similares em
SciELO
Compartilhar

 Permalink
Revista mexicana de ciencias agrícolas
versão impressa ISSN 2007-0934
Rev. Mex. Cienc. Agríc vol.8 no.2 Texcoco Fev./Mar. 2017
https://doi.org/10.29312/remexca.v8i2.48
Articles
Geomatic models based in the transition for spatial analysis in Villahermosa, Tabasco
1Ciencias en Ecología y Manejo de Sistemas Tropicales-Universidad Juárez Autónoma de Tabasco. Carretera Villahermosa-Cárdenas, km 0.5. Villahermosa, Tabasco, México. CP. 86040. Tel. (01) 993 1369052. (migueldacbiol@hotmail.com).
2Universidad Juárez Autónoma de Tabasco-División de Académica de Ciencias Biológicas.Carretera Villahermosa-Cárdenas, km 0.5. Villahermosa, Tabasco, México. CP. 86040. Tel. (01) 993 3581500, ext. 6400. (eukha98@hotmail.com; alberthoj.sanchez@gmail.com).
3Postgrado en Desarrollo Rural-Colegio de Postgraduados. Carretera México-Texcoco, km 36.5. Montecillo, Estado de México. CP. 56230. Tel. (01) 595 9520200, ext. 1843 (mescalona@colpos.mx).
The excessive periurbanization of the city of Villahermosa, located in the lower basin of the Grijalva River, has impacts do the natural system since the last 40 years. To analyze the spatial dynamics of Villahermosa and its effects and alternatives, were constructed probability matrices and scenarios of change in land use by the modeler changes ground (MCT), chains of Markov and cellular automata. During 1984 and 2008, the MCT showed the increase in urban areas use (4 458 ha) and grassland (11 239 ha), which induced the decrease tree vegetation (1 893 ha) and wetlands (2 244 ha). The projections to 2020, 2030 and 2040 carried out with Markov and CA-Markov predicted continuation, both d increasing the area of urban use (6 058, 6 137 and 6 824 ha) and grassland (10 971, 10 922 and 10 705 ha), and the decrease of hedges tree vegetation (756, 722 andy 444 ha) and wetlands (1 965, 1 997 and 1 888 ha). This change of projections and land use in Villahermosa show the virtual disappearance of wetlands and tree vegetation, which highlights the need to create land reserves as stated in the program of ecological management.
Keywords: cellular automata; Markov chains; modeler changes on the ground
La periurbanización desmedida de Villahermosa, localizada en la cuenca baja del río Grijalva, ha impactado al sistema natural desde hace 40 años. Para analizar la dinámica espacial de Villahermosa, así como sus efectos y alternativas, se construyeron matrices de probabilidad y escenarios de cambio de uso de suelo mediante el modelador de cambios en el terreno (MCT), las cadenas de Markov y los autómatas celulares. Durante 1984 y 2008, el MCT demostró el incremento de las áreas de uso urbano (4 458 ha) y pastizal (11 239 ha), lo que indujo la disminución de la vegetación arbórea (1 893 ha) y humedales (2 244 ha). Las proyecciones a 2020, 2030 y 2040 efectuadas con Markov y CA-Markov predijeron la continuidad, tanto el aumento del área urbano (6 058, 6 137 y 6 824 ha) y pastizal (10 971, 10 922 y 10 705 ha), como la dismunición de coberturas de vegetación arbórea (756, 722 y 444 ha) y humedales (1 965, 1 997 y 1 888 ha). Estas proyecciones de cambio de uso del suelo en Villahermosa muestran la desaparición de la vegetación arbórea y humedales, que resalta la necesidad de crear las reservas territoriales como lo señala el programa de ordenamiento ecológico.
Palabras clave: autómatas celulares; cadenas de Markov; modelador de cambios en el terreno
Introduction
In the world patterns of changes in forest and aquatic coverage given by natural and anthropogenic causes (Velázquez et al., 2002), which may lead to reduced resilience of ecological systems to various destabilizing agents such as rainfall and act human activities (Restrepo and Juan, 2015). The human activities have changed the configuration of the landscape and have altered the ecosystem functionality (Burel and Braudy, 2002), among them, extensive agriculture, deforestation of tropical forests and urbanization are the most common (Fahrgi et al., 2011). The loss of biodiversity is the most obvious impact, such as landscape fragmentation has lost causes do that natural resources are irreversibly recovered (Marcantonio et al., 2013). Worldwide it has gone around 50% of wetlands (Mitsch and Gosselink, 2009) and from 1990 to 2015 decreased 129 million ha of forests on the planet (FAO, 2016).
The study of changing land use is in the center of attention of environmental research, and it estimates the distribution of natural cover change and identifies and uses artificial hedges which have the biggest environmental impacts (Velázquez et al., 2002). Therefore, the modeling of land use change in territories or urbanizes, rural or natural it is important to predict environmental and socio-economic scenarios, in order to establish policies of territorial planning (Paegelow et al., 2003).
The transition based in geomatic models simulate internal landscape dynamics and gain probabilities of land use change (Clarke and Gaydos, 1998; Eastman, 2012). The models commonly used for its simplicity in data preparation, execution and results are: the modeler changes in terrain (MCT), Markov chains and automata cellular automata (Clarke and Gaydos, 1998; Eastman, 2012).
The Markov chains simulate the prediction of the state of a system at a given from two previous states (Eastman, 2012) time. It is a discrete procedure in a discrete time, where the value at time t1 depends on the values at times t0 and t-1. The prediction is embodied in a series of maps of land use for a future time, where the digital level of each pixel expresses the probability of belonging to the analyzed category (Paegelow et al., 2003; Eastman, 2012; Reynoso et al., 2016). Exist are social, economic, physical and environmental variables that influence the modeling of changes in land use; however, the Markov chain model is linear and does not consider the effects of factors of change in land use (Pontius, 2000), but is based solely on the analysis of the internal dynamics of the system (Paegelow et al., 2003; Reynoso et al., 2016).
The cellular automata function as a set of identical elements or cells, each of which is in a discrete space (Clarke and Gaydos, 1998; Reynoso et al., 2016). Such spatial units contain a history and evolution of change over time, along with rules such as the influence of neighboring cells to a central (Clarke and Gaydos, 1998).
Villahermosa, is one of the four major urban ecosystems of the basin of the Grijalva River. It subsists 13 river lagoon ecosystems and related contact with rivers Mezcalapa Viejo, Carrizal and Grijalva-Sierra that surrounding. In the decade of the 70’s the oil boom adds to the economic impulse and the consequent urban growth in cities in the southeast of the country, including Villahermosa, Tabasco (Bazant, 2010). The periurban growth model of Villahermosa was associated with the modification of its physiography and increased vulnerability to flooding (Perevochtchikova and Lezama, 2010).
In urban areas and adjacent urban sub and the lower basin of the Grijalva River were dried and polluted, both wetlands and their areas of temporary flooding, the course of rivers changed, the hillocks are devastated and forests were deforested (Sánchez-Munguía, 2005; Kolb et al., 2013; Sánchez et al., 2015).
Therefore, geomatics models were integrated to generate a complementary, current and prospective diagnosis of change in land use the city of Villahermosa. Projections of change in land use, the period 1984-2008, were calibrated and validated by: 1) The MCT to create matrices cross tabulation, 2) The Markov chains, for calculating probability matrices transition and 3) Cellular Automata, for mapping and spacial future scenarios. This type of study benefits with additional information to future strategies and land planning policies (Clarke and Gaydos, 1998; Paegelow et al., 2003).
Materials and methods
Study area
The city of Villahermosa (92° 56’ north latitude and 17° 59’ west longitude) sits on a plateau at 10 masl, which is bordered to the west and north by the River Carrizal, southwest by the River Mezcalapa Viejo and south by the River Grijalva and is located in the lower basin of River Grijalva (CONAGUA, 2012). The geographical location of the city on a plain surrounded by rivers underpins the importance of conservation of natural vegetation and wetlands with temporary flooding areas.
Database
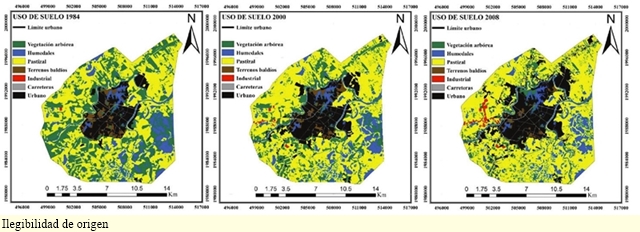
Three land use maps were collected from the years 1984, 2000 and 2008, scale 1:10 000: Datum WGS84-Proyección UTM zone 15N in vector format, developed by scanning s screen, with the program Arc Gis® 10.2.2. Subsequently, the vectors were transformed into raster format with the “Rastervector” command program IDRISI Selva 2012®. The thematic categories were: 1) timberline; 2) wetlands; 3) pasture; 4) vacant lots; 5) Industrial; 6) roads; and 7) urban (Figure 1).
Modeler changes ground (MCT)
The MCT program IDRISI Selva 2012®, was used to generate a quantitative image analysis on two dates using a matrix of cross tabulation. This period was from 1984 to 2008. The MCT allowed to locate the amount of change (persistence’s, gains, losses, net change and contributions) between categories (Eastman, 2012). The accuracy of the matrix cross-tabulation was validated with the “Crosstab” command, with gender and statistical kappa (K).
Markov chains
With the Markov module IDRISI Selva 2012® four matrices of transition probability were created. The method was to cross maps of land use in two time periods, with a margin of error of 15%, to create a matrix of probability of change in a third period (Eastman, 2012; Reynoso et al., 2016).
For each projection, the module generated an array of change probabilities, an array of change areas containing the number of pixels expected to change from one use class to another over a period of time, and a collection of area images adequacy/suitability (Eastman, 2012; Subedi et al., 2013; Reynoso et al., 2016). The first two matrices created s (calibrated) were: (1) 1984-2000 (projection 2008), (2) 2000-2008 (projection 2020), later they were created: (3) 2008-2020 (projection 2030) and (4) 2008-2020 (projection 2040).
Cells automata (CA-Markov)
With the CA-Markov module of IDRISI Selva 2012® spatial scenarios calibrated from the combination of a base map of land use were constructed, the matrix of areas of change and the collection of images of areas suitability/fitness Markov built. The model was run with 12 interactions and a contiguity filter of 5*5 pixels for predict significant cellular changes (Eastman, 2012; Reynoso et al., 2016). The first two space scenarios (calibrated) they were 2008 and 2020, which served as the basis for creating the final scenarios 2030 and 2040.
To assess the accuracy of each projection is performed a comparison of similarity between base maps and spatial scenarios constructed by the “validate” command. This module provided the Kappa (K) statistic to assess the similarity between the classification (Eastman, 2012; Reynoso et al., 2016). The base maps of land use scenarios validate for 2008 and 2020 (calibrated) were the real maps of 1984 and 2008; whereas for validate scenarios 2030 and 2040 was used the actual map of 2008.
Results and discussion
Modeler changes in terrain
The MCT generated a probability of change matrix and a statistical summary Kappa= 0.81 (Table 1). This value showed that the maps of 1984 and 2008 were precise when being crossed and generated a reliable analysis of the spatial dynamics of the territory.
Table 1 Matrix of change probabilities calculated with the change modeler in the ground, for the city of Villahermosa during 1984-2008
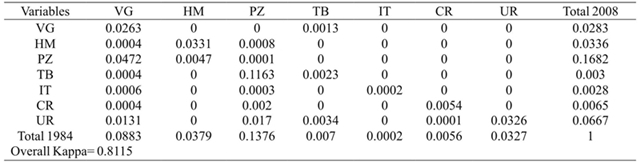
VG= vegetación arbórea; HM= humedales; PZ= pastizal; TB= terrenos baldíos; IT= industrial; CR= carreteras; y UR= uso urbano.
During 1984-2008, the matrix of changes showed that the category with the greatest persistence was pasture (53.7%) (Table 2), which has been occupied for agricultural activities, urban growth, roads and industrial areas. The urban area remained persistent with 15.1%, implying that this artificial area will hardly return to natural cover (McDonnell and Pickett, 1990).
Table 2 Estimates of the change matrix (ha) with the land shifter modeler for the city of Villahermosa during the period 1984-2008.
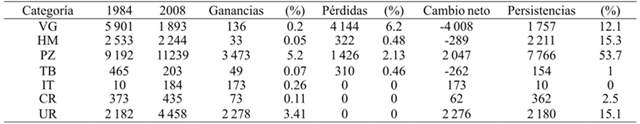
VG= vegetación arbórea; HM= humedales; PZ= pastizal; TB= terrenos baldíos; IT= industrial; CR= carreteras; y UR= uso urbano.
Tree cover and wetlands were persistent with 12.1 and 15.3% (Table 2). Persistence of pasture and urban use coincided with Zavala et al. (2009), since they recorded that the pastures for agricultural use (60%) and urban occupation (9.1%) were the dominant uses in Villahermosa during 1984 and 2005, while 74% of the landscape was transformed and 25.3 and 5.2% were occupied by arboreal vegetation and wetlands.
The losses of tree vegetation and wetlands were greater than gains (Table 2). In contrast, pasture had the highest gains in area, although it lost about 2.13% due to its transitions to urban, industrial, roads and vacant lots (Table 2). Also, urban use recorded high gains of 3.41% and zero losses (Table 2).
The uses that contributed mainly to the loss of tree vegetation were pasture with 3 103 ha, followed by the urban with 872 ha (Figure 2).
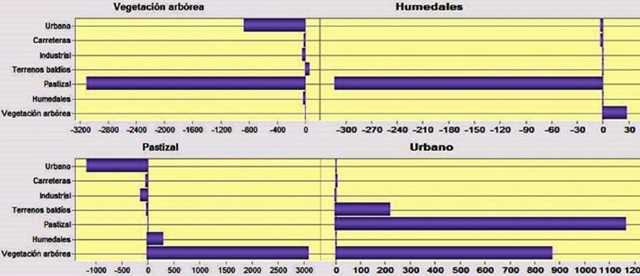
Figure 2 Net contributions among the categories of land use change in the city of Villahermosa (1984-2008).
The growth of the industrial zone and roads, with 40 and 24 ha, also contributed to deforestation. Likewise, 28 ha of tree vegetation were replaced by wetlands, attributed to the 2007 floods, in which 62% of the state was flooded (CEPAL, 2008). In contrast, 312 ha of wetlands disappeared in the city due to pasture growth (Figure 2).
The pasture grew mainly in areas where there was arboreal vegetation and wetlands. This is based on the fact that the greatest impact in Villahermosa on natural coverages was due to the growth of agricultural activities in the last four decades. However, the pasture also suffered significant losses of 1 169 ha for its transformation to urban areas, 133 ha to transform to industrial use, and to a lesser extent lost 44 ha for its replacement to roads and 22 ha for vacant land (Figure 2).
The urban use mainly displaced pasture areas, followed by tree vegetation and vacant lots (Figure 2). The analysis of the contributions showed that the urban growth in the three decades included was not directly related to the loss of wetlands, since the MCT found that between 1984 and 2008, these natural coverages were replaced in great proportions by the grassland and in smaller measured by urban growth and road construction (Figure 2).
The distribution of the transitions observed between 1984 and 2008 showed that the major transformation to urban use occurred in the urban neighborhoods previously consolidated and in the vicinity of the roads, where residential areas and other artificial zones were built away from the center and edges of the city, which has favored the process of periurbanization.
The periurban development is generally accompanied by the fragmentation and contamination of ecosystems, as well as the drastic loss or reduction of habitats and biodiversity (Benítez et al., 2012; Sánchez et al., 2012; Henny and Meutia, 2014; Hettiarachchi et al., 2014). The peripheral expansion of Villahermosa was not without modifying its hydrogeomorphology, as the practice of fragmenting and replenishing the wetlands was outstanding. In addition, deforestation and transformation of the surface river network of the rivers of the Grijalva basin (Kolb and Galicia, 2012; Sánchez et al., 2015). In the atlas of risk of the center municipality (Galindo-Alcántara et al., 2009) it was pointed out that, during 1984-2000, the city of Villahermosa increased its urban area by 38.65% due to the construction of houses and infrastructure favored by public policies and socioeconomic elements.
In spite of the environmental services that the wetlands have provided and the greater economic benefits that would be received for investing in their conservation (Maltby and Acreman, 2011; Henny and Meutia, 2014); during 1984-2008, urban development projects in Villahermosa continued with the hydraulic isolation of wetlands and the filling of their floodplain areas, which resulted in the net loss of 289 ha of wetlands (Table 2). Sánchez-Munguia (2005) quantified that the urban advance of 2 296 ha between 1990 and 2000 invaded wetlands and eliminated regulatory vessels with emerging rooted macrophytes. At the basin level, 60% of wetlands were lost in the first eight years of the 21st century (Landgrave and Moreno-Casasola, 2012).
The trends of urban growth in Villahermosa coincide, both with the degree of urbanization reached in different regions of Mexico, that have not contributed a substantial increase in the development of the country. On the contrary, much of the social problems, such as segregation and economic inequality and environmental deterioration, such as deforestation and fragmentation and contamination of wetlands in Mexico, have been caused by urban development (Garza, 2010; MacGregor-Forsy and Ortega-Álvarez, 2013).
The effects of climate change are compounded by urban sprawl and land-use change, as floods and vulnerability are magnified, especially by the low-income population living in irregular areas that are most exposed and with little or no capacity of response (Welz and Krellenberg, 2016). In Villahermosa, unplanned growth and lack of urban development policies, insufficient income for a large part of the population, and the need for housing encouraged the occupation of at least 59 irregular settlements that put pressure on wetlands with high flood risk (Galindo-Alcántara et al., 2009).
During September and October 2007, floods of great magnitude were recorded in Tabasco, which affected the city of Villahermosa (Perevochtchikova and Lezama, 2007). The change of land use in the city and in the basin showed the vulnerability of the inhabitants of Villahermosa, since in the extreme flood of October 2007 were affected 50 521 homes, 75% of the population was affected by losses that amounted to 31.8 billion pesos, at level the Grijalva basin (CEPAL, 2008). This shows that in Tabasco the settlement of urban centers leads to the construction of infrastructure in areas prone to flood, which contributes to vulnerability to climate change (Ramos et al., 2016). Despite the environmental lesson of the floods, the city continues to grow with the same practices, under periurban development.
Considering this scenario, sustainable urban development would involve planning that includes the creation of protected natural areas, working lands for the inhabitants of the primary sector and the availability of urban infrastructure and housing built in non-vulnerable areas (Benítez et al., 2012). In the state, the environmental management program of Tabasco (Galindo-Alcántara et al., 2006) has as one of its objectives “to guide and evaluate the establishment and development of productive activities, human settlements and conservation of resources natural, regulating and reducing environmental impacts”.
In response to this program, the city government designed, for the 2008-2030 period, the establishment of three areas to regulate the use and conservation of wetlands, tree vegetation and grassland areas: 5 715 ha for preservation, total conservation and hydrological regulation, 1 310 ha reserved for ecological preservation for improvement and restricted compatibility and 174 ha for Environmental Value (Institute for Urban Planning and Development, 2008). However, the application of laws and management and urban development programs in the country has been insufficient, and in the face of this problem, the growth and development of Mexican cities still represent threats to the conservation of biodiversity and human well-being (Bazant, 2010; MacGregor-Forsy and Ortega-Álvarez, 2013).
Markov chains (Markov) and cellular automata (CA-Markov)
The probability matrix of change 2020 (Table 3) indicated that tree cover would have the greatest transitions, with high probabilities to become pasture and urban use (Table 3), while wetland coverages will have a 12.5% probability of be replaced by pasture. It was also detected that the pasture will present 10.5% probability to be converted to urban use.
Table 3 Matrices of probability of change (Markov).
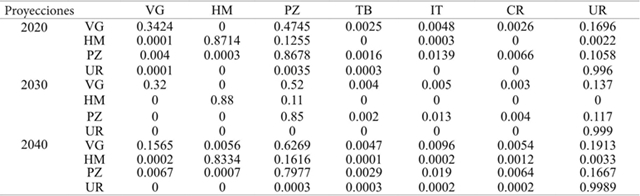
VG= vegetación arbórea; HM= humedales; PZ= pastizal; TB= terrenos baldíos; IT= industrial; CR= carreteras; y UR= uso urbano.
In the projection of 2030, tree vegetation will maintain high probabilities of 52 and 13.7% being replaced by grassland and urban use (Table 3), while wetland coverings will present 11.7% probabilities of being converted to pastureland. In 2040, the arboreal vegetation will continue to deteriorate in its area, showing a high probability of 62.6% and 19.1% to become pasture and urban areas (Table 3). Meanwhile, the wetlands will continue with the same trend of change to pasture with probability of 16.1%. The pasture will continue to be important for the growth of the urban area with a probability of 16.6%.
The calibrated CA-Markov projections 2008 and 2020, presented a global precision Kappa= (Kno= 92.2%, Klocation= 96.3%, Kstandard= 86.1%) and (Kno= 95%, Klocation= 96.4% Kstandard= 91.1%), which supports, that these two projections are reliable to represent spatial scenarios of land use change. Also, the two scenarios constructed for 2030 and 2040, at the base of projections 2008 and 2020, presented reliable statistics Kappa= (Kno= 94.8%, Klocation= 96.3%, Kstandard= 90.8%) and (Kno= 93.4%, Klocation= 96.3% Kstandard= 88.2%).
The projection of changes of 2008 2020 (Figure 3) generated a scenario, where no increase in landscape dynamics. The tree vegetation and wetlands occupy 4 137 ha of the total area; While, pasture and urban use 15 697 ha. The analysis of the net changes indicated that the tree vegetation will lose 1 917 ha, the wetlands 451 ha, and the pasture 225 ha. In contrast, urban use will increase by 2 480 ha (Table 4). From 2020 to 2030 (Figure 3) a scenario was detected where the dynamics of the landscape is of smaller magnitude by having a range of 10 years. The arboreal vegetation and the wetlands will cover 2 719 ha of the total area; while pasture and urban use will occupy 17 059 ha. The arboreal vegetation will lose 34 ha, the wetlands 32 ha, and the grassland 49 ha.
Table 4 Estimation of spatial change scenarios CA-Markov.
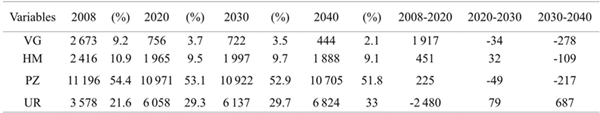
VG= vegetación arbórea; HM= humedales; PZ= pastizal; UR= urbano.
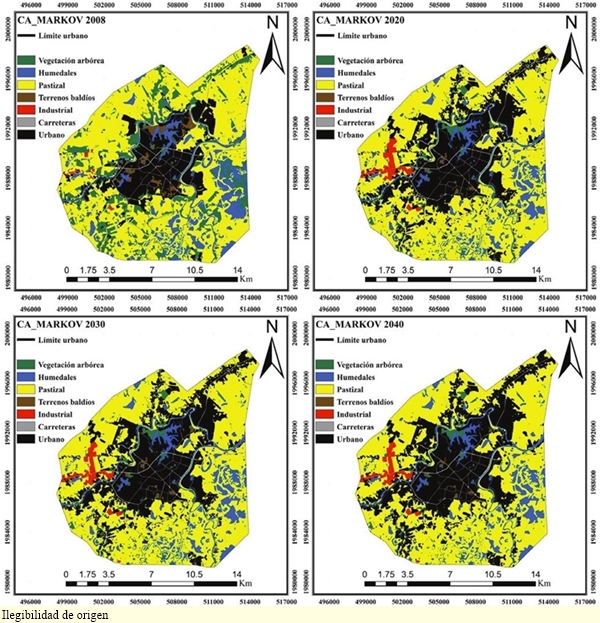
In contrast, urban use will increase by 79 ha (Table 4). However, the period 2030-2040 (Figure 3) will be catastrophic, because tree vegetation and wetlands will cover only 2 332 ha of the total area; while pasture and urban use will occupy the largest area of the entire analysis period with 17 529 ha. In relation to the net changes, the tree vegetation will lose 278 ha, the wetlands, 109 ha, and the pasture 217 ha. In contrast, urban use will increase 689 ha (Table 4).
It is noted that the process of land use change is affected by environmental factors (slope, relief, orientation, among others), socioeconomic (population density, distances to residential areas, shopping centers, and factories) environmental (protected areas, aquatic ecosystems, soil type, etc).
These factors can be analyzed in other geomatic models such as: logistic and multiple regression, neural networks and multicriteria evaluation (EMC). The spatial variables to be compared in these models must coincide in scale and method of classification to avoid errors in the results (Velázquez et al., 2002).
The resulting fitness images in these models can be integrated into CA-Markov, to create projection maps with greater adequacy of reality representation that would greatly improve the predictive capacity (Thapa and Murayama, 2011; Subedi et al., 2013).
In this study, limitations were presented in the preparation of the database, since: 1) only images of 1984, 2000 and 2008 were found in scale 1:10 000, 2) it was not possible to integrate images of social aptitude, economic or physical (such as the digital elevation model), since the information available for these subjects is in different scales of 1:50 000, 1: 250 000 and 1:1 000 000 (INEGI, 2016), and 3) have different classification methods. To solve this limitation; were used as variables, the matrix of areas of change and the collection of images of areas suitability/fitness built in Markov as variables to run the CA-Markov model in the four projections, and it was shown that the internal dynamics of the landscape itself were sufficient for the creation of spatial scenarios 2008, 2020, 2030 and 2040.
In this way, we can verify that the use of geomatic models depends on the detail, implementation costs and spatial information available at the same scale size (Romero and López, 2000). The study confirms that it is essential to integrate and combine geomatic models of land use change to better understand the scope of the changes, the risks involved and if possible to identify the agents that cause the change for the purpose of monitoring of territorial planning (Chuvieco, 2008).
Conclusions
The integration of geomatic models in transition-based is a powerful tool to simulate the internal dynamics of the landscape and obtain probabilities of change to establish environmental planning strategies. In the city of Villahermosa located in the lower Grijalva River basin, urban use (4 458 ha) and pasture (11 239 ha) increased in 1984 and 2008, causing deterioration of 1 893 ha of tree vegetation and 2 244 ha of wetlands. The projections showed very accurate scenarios for 2020, 2030 and 2040, where the increase in urban (6 058, 6 137 and 6 824 ha) and pasture land (10 971, 10 922 and 10 705 ha) will continue (756, 722 and 444 ha) and wetlands (1 965, 1 997 and 1 888 ha).
The results reaffirm that the urban growth model has generally neglected the conservation of ecosystems due to the lack of application of the land management program coupled with the loss of wetlands as regulatory vessels and their change of use for housing areas. If the anarchic process of change of land use continues due to the badly planned periurban growth in the city, the south-southeast area of Villahermosa may lose the last remaining tree and aquatic surfaces in the next two decades. Therefore, to avoid scenarios of environmental deterioration in the next two decades, the south-southeast zone should be protected as a protected natural area through a comprehensive management plan and legal decree to support it to stop periurbanization.
Literatura citada
Bazant, J. 2010. Expansión urbana incontrolada y paradigmas de la planeación urbana. Espacio abierto. 19(3). [ Links ]
Benítez, G.; Pérez, V. A.; Nava, T. M.; Equihua, M. and Álvarez, P. J. L. 2012. Urban expansion and the environmental effects of informal settlements on the outskirts of Xalapa city, Veracruz, Mexico. Environment and Urbanization. 24(1):149-166. [ Links ]
Burel, F. and Baudry, J. 2002. Ecología del paisaje: conceptos métodos y aplicaciones. Madrid, España: Ediciones Mundi Prensa. 428 p. [ Links ]
CONAGUA (Comisión Nacional del Agua). 2012. Atlas digital del agua México. http://www.conagua.gob.mx/atlas/index.html [ Links ]
Fahrig, L.; Baudry, J.; Brotons, L.; Burel, F. G.; Crist, T. O.; Fuller, R. J. and Martin, J. L. 2011. Functional landscape heterogeneity and animal biodiversity in agricultural landscapes. Ecology letters. 14(2):101-112. [ Links ]
FAO (Organización de las Naciones Unidas para la Alimentación y la Agricultura). 2016. http://www.fao.org/news/story/es/item/327382/icode/. [ Links ]
Garza, G. 2010. La transformación urbana de México, 1970-2020. In: Garza, G. y Schteingart, M. (Eds.). Los grandes problemas de México. Desarrollo urbano y regional. Ciudad de México: El Colegio de México A. C. 2:31-86. [ Links ]
Galindo, A. A.; Gama, L. M.; Salcedo, M. A.; Ruiz, A. S. D.; Morales, A. y Rullán, C. 2006. Programa de ordenamiento ecológico del estado de Tabasco. Villahermosa, México: Secretaría de Desarrollo Social y Protección al Ambiente. 44 p. [ Links ]
Galindo, A. A.; Ruiz, A. S. D.; Morales, A.; Gómez, C.; Salcedo, M. A.; Aguilar, M.; Valencia, J. y Rodríguez, C. M. 2009. Atlas de riesgos del municipio de centro, Tabasco. Villahermosa: Ayuntamiento Municipal de Centro, Secretaría de Desarrollo Social. 125 p. [ Links ]
Henny, C. and Meutia, A. A. 2014. Urban lakes in megacity Jakarta: risk and management plan for future sustainability. Procedia Environmental Sciences. 20:737- 746. [ Links ]
INEGI (Instituto Nacional de Geografía). 2016. Cartografía urbana. http://www.inegi.org.mx/geo/contenidos/urbana/default.aspx. [ Links ]
Instituto de Planeación y Desarrollo Urbano. 2008. Programa de desarrollo urbano del centro de población de la ciudad de Villahermosa y centros metropolitanos, Tabasco 2008-2030. Villahermosa: H. Ayuntamiento Constitucional de Centro. [ Links ]
Kolb, M. and Galicia, L. 2012. Challenging the linear forestation narrative in the Neo‐tropic: regional patterns and processes of deforestation and regeneration in southern Mexico. The Geographical Journal. 178(2):147-161. [ Links ]
Kolb, M.; Mas, J. F. and Galicia, L. 2013. Evaluating drivers of land-use change and transition potential models in a complex landscape in Southern Mexico. Inter. J. Geograp. Infor. Sci. 27(9):1804-1827. [ Links ]
Landgrave, R. y Moreno, C. P. 2012. Evaluación cuantitativa de la pérdida de humedales en México. Investigación ambiental. 4(1):19-35. [ Links ]
MacGregor, F. I. y Ortega, Á. R. 2013. Ecología urbana: experiencias en América Latina.Ciudad de México: INECOL. 76 p. [ Links ]
Marcantonio, M.; Rocchini, D.; Geri, F.; Bacaro, G. and Amici, V. 2013. Biodiversity, roads, and landscape fragmentation: two mediterranean cases. Applied Geography.42:63-72. [ Links ]
Maltby, E. and Acreman, M. C. 2011. Ecosystem services of wetlands: pathfinder for a new paradigm. Hydrol. Sci. J. 56(8):1341-1359. [ Links ]
McDonnell, M. J. and Pickett, S. T. 1990. Ecosystem structure and function along urban-rural gradients: 7 an unexploited opportunity for ecology. Ecology. 71(4):1232-1237. [ Links ]
Mitsch, W. J.; Goseelink, J. G. and Anderson, C. J. 2009. Wetland ecosystems. Hoboken, New Jersey: John Wiley & Sons, Inc. 50 p. [ Links ]
Paegelow, M.; Camacho, M. y Toribio, J. 2003. Cadenas de Markov, evaluación multicriterio y evaluación multiobjetivo para la modelización prospectiva del paisaje. Geofocus. 3:22-44. [ Links ]
Perevochtchikova, M. y Lezama, T. J. L. 2010. Causas de un desastre: inundaciones del 2007 en Tabasco, México. J. Latin American Geography. 9(2):73-98. [ Links ]
Pontius, R. G. 2000. Quantification error versus location error in comparison of categorical maps.Photogrammetric Engineering and Remote Sensing.66(8):1011-1016. [ Links ]
Ramos, R. R.; Gama, C. L. M.; Núñez, G. J. C.; Sánchez, H. R.; Hernández, T. H. y Ruiz, A. O. 2016. Adaptación del modelo de vulnerabilidad costera en el litoral tabasqueño ante el cambio climático. Rev. Mex. Cienc. Agríc. (13):2551-2563. [ Links ]
Restrepo, A. and Juan, D. 2015. The impact of deforestation on the erosion in the Magdalena River drainage basin (1980-2010). Revista de la Academia Colombiana de Ciencias Exactas. 39(151):250-267. [ Links ]
Reynoso, S. R.; Valdez, L. J. R.; Escalona, M. M. J.; de los Santos Posadas, H. M. y Pérez, H. M. J. 2016. Cadenas de Markov y autómatas celulares para la modelación de cambio de uso de suelo. Ingeniería Hidráulica y Ambiental.37(1):72-81. [ Links ]
Romero, H. D. y López, B. J. 2000. Producción e integración de fotomapas digitales para la evaluación del crecimiento urbano,Texcoco, Estado de México: periodo 1970-1989-1997. Investigaciones Geográficas. (42):48-66. [ Links ]
Sánchez, A. J.; Salcedo, M. A.; Macossay, C. A.; Feria, Y.; Vázquez, L.; Ovando, N. y Rosado, L. 2012. Calidad ambiental de la laguna urbana la Pólvora en la cuenca del río Grijalva. Revista Tecnología y Ciencias del Agua. 3(3):143-152. [ Links ]
Thapa, R. B. and Murayama, Y. 2011. Urban growth modeling of Kathmandu metropolitan region, Nepal. Computers, Environment and Urban Systems. 35(1):25-34. [ Links ]
Velázquez, A.; Mas, J. F.; Gallegos, R. D.; Mayorga, S. R.; Alcántara, P. C.; Castro, R. y Palacio, J. L. 2002. Patrones y tasas de cambio de uso del suelo en México.Gaceta Ecológica. (62):21-37. [ Links ]
Welz, J. and Krellenberg, K. 2016. Vulnerabilidad frente al cambio climático en la Región Metropolitana de Santiago de Chile: posiciones teóricas versus evidencias empíricas. EURE. 42(125):251-272. [ Links ]
Received: November 2016; Accepted: February 2017
 Este es un artículo publicado en acceso abierto bajo una licencia Creative Commons
