


Servicios Personalizados
Revista
Articulo
 texto en
  Inglés (pdf)
 Artículo en XML
 Referencias del artículo
 Enviar artículo por email
Indicadores
-
 Citado por SciELO
 -
 Accesos
Links relacionados
-
 Similares en
SciELO
Similares en
SciELO
Compartir

 Permalink
Revista mexicana de ciencias agrícolas
versión impresa ISSN 2007-0934
Rev. Mex. Cienc. Agríc vol.8 no.1 Texcoco ene./feb. 2017
https://doi.org/10.29312/remexca.v8i1.72
Articles
Genetic variation in guava using RAPDs and morphological descriptors in Calvillo Aguascalientes
1Laboratorio de Biotecnología Aplicada. Instituto Tecnológico El Llano. Carretera Aguascalientes-San Luis Potosí, km 18. Aguascalientes, México. CP. 20330.
The fruits and leaves of 140 randomly selected guava trees from the same number of orchards of Calvillo, Aguascalientes were sampled in the period 2012-2013 in order to obtain RAPD type molecular markers and to compare them with fruit and leaves morphological descriptors of selected individuals by phenograms. The similarity found for the morphology data ranges from 87 to 100%, while the similarity for the RAPD data ranged from 25 to 100%. To the five main clades generated with the data of fruit and leaf morphology, it was not possible to associate them with the bands generated by RAPD. Therefore, analyzes of both types of data were performed separately. Even so, it is considered that the RAPD technique can be used to characterize outstanding guava genotypes that may be useful in the assisted genetic improvement programs of this species in Mexico. The case of having orchards with an acceptable degree of uniformity is not ruled out in order to have a recognizable genetic profile that can lead to the authenticity of the origin of the fruits of the orchard.
Keywords: Psidium guajava; genetic diversity; guava; RAPD
Se muestrearon frutos y hojas de 140 árboles seleccionados al azar de guayaba procedentes de igual número de huertas de Calvillo Aguascalientes en el periodo 2012-2013 con el fin de obtener marcadores moleculares tipo RAPD y compararlos con descriptores morfológicos de fruto y hojas de los individuos seleccionados mediante fenogramas. La similitud encontrada para los datos de morfología va de 87 a 100%, en tanto, la similitud para los datos de RAPD osciló entre 25 y 100%. A las cinco clades principales generadas con los datos de morfología de fruto y hoja, no fue posible asociarles con las bandas generadas mediante RAPD. Por lo tanto, los análisis de ambos tipos de datos fueron realizados por separado. Aun así, se considera que la técnica RAPD puede ser utilizada para caracterizar genotipos de guayaba sobresalientes que pueden ser útiles en los programas de mejoramiento genético asistido de esta especie en México. No se descarta el caso de tener huertas con un aceptable grado de uniformidad para efecto de tener un perfil genético reconocible que puede llevar a dictaminar la autenticidad del origen de los frutos de dicha huerta.
Palabras clave: Psidium guajava; diversidad genética; guayaba; RAPD
Introduction
The guava (Psidium guajava, L.) is a fruit of national importance, since it is integrated into the Mexican diet as much as fresh fruit or its derivatives in the form of regional sweets, jams, biscuits and liqueurs, which are also exported to markets latinos abroad (Varela, 2010). In Mexico 20 899 ha of this fruit are cultivated, of which 30% belong to orchards located in the state of Aguascalientes. Similarly, at the national level, 302 719 tonnes are produced, of which 32% are produced in that state (SIAP, 2015). These national production data place Mexico as the third largest guava producer after India and Pakistan (Grattapaglia et al., 2012; Quesada et al., 2005) and Aguascalientes as one of the states that contribute most to Michoacán of the national production, 95% (288 670.85 tons) has been reported as “China’s average” (SIAP, 2015).
The producing area of Aguascalientes is located in the municipality of Calvillo and adjoins The Cañón of Juchipila in the state of Zacatecas. This area as a whole has been called “Calvillo-Cañones” and is a compact area with great national importance in the production of this fruit (Padilla et al., 2002). In this municipality, more than 400 orchards have been reported by the Mexican National Guava Council, of which the majority is in the range of 0 to 3 hectares (SAGARPA, 2012).
The genotypes considered to be of local origin by the producers are shared in neighboring areas of Zacatecas, forming a region known as “Calvillo-Cañones” (Padilla et al., 2002; Padilla et al., 2007; Perales et al., 2005). The fruits produced in this region have the reputation of being of the best quality at national level although it has been observed that in the field there is variability in the characters such as fruit shape, thickness of the mesocarp, color, size and organoleptic properties that have influence in the national market and recently international. However, it is precisely this perceived quality of Calvillo guava that has prompted local producers to seek a way to prevent fruits of another origin from being labeled as if produced in this region.
This consideration suggests the implementation of a method for identifying the “fingerprint” of fruits based on molecular markers such as Amplified Fragment Length Polymorphisms (AFLPs) (Randomly Amplified Polymorphic (RAPD DNAs), (Restriction Fragment Length Polymorphisms), (Single nucleotide polymorphisms (SNPs) and (Simple Sequence Repeats (SSRs). This type of markers used for the detection of polymorphisms in the DNA strand, which can help identify genotypes, to establish genetic distances between wild, improved genotypes, crosses or populations. It is also considered as a useful tool in assisted improvement (Provan et al., 1999; Chandra and Mishra, 2007; ISAAA, 2015).
In the specific case of guava, tests of Inter Simple Sequence Repeats (SSR and ISSR) were performed, yielding reliable results on monomorphic patterns in plants derived from somatic embryogenesis, from which genetic homogeneity was expected (Liu and Yang, 2012; Rai et al., 2012). Another use of SSR markers has been the evaluation of genetic diversity in brazilian wild guava, or the identification of genera Psidium, Zyzygium and Eugenia in studies of diversity of the family Myrtaceae (Nogueira et al., 2012; Valdés et al., 2012a). A new way to assess genetic diversity with markers based on conserved retrotransposon binding sites or Inter Primer Binding Sites (iPBS) has recently been used in guava (Mehmood et al., 2013).
Other techniques such as RFLP combined with Denaturing Gradient Gel Electrophoresis (DGGE) have been considered less efficient and later compared against techniques using specific rDNA sequences such as target (18S and ITS) and cpDNA (trnL intron and trnL-trnF IGS). However, using the RAPD technique which is even simpler than the above and with the use of primers OPB17, OPG6, OPY15 and OPY18 it has been possible to obtain high level polymorphism patterns which have been useful in discriminating cultivated varieties of guava (Tseng-Wei et al., 2007). RAPDs have also been useful in discriminating 33 Bangladeshi guava genotypes differentiated into two major groups that primarily reflect the morphological characteristics of the domestication levels of the present varieties (Ahmed et al., 2011).
It is clear that environmental conditions are not reliable indicators per se of genotype expression (Kujal et al., 2005). Therefore, the objective of this research was to analyze the pattern of molecular markers against the pattern of morphological variation of the plants analyzed in the different genotypes found in the gardens of Calvillo, Aguascalientes. The results are expected to be useful in guava improvement programs in Mexico.
Materials and methods
Plant material and its morphological description
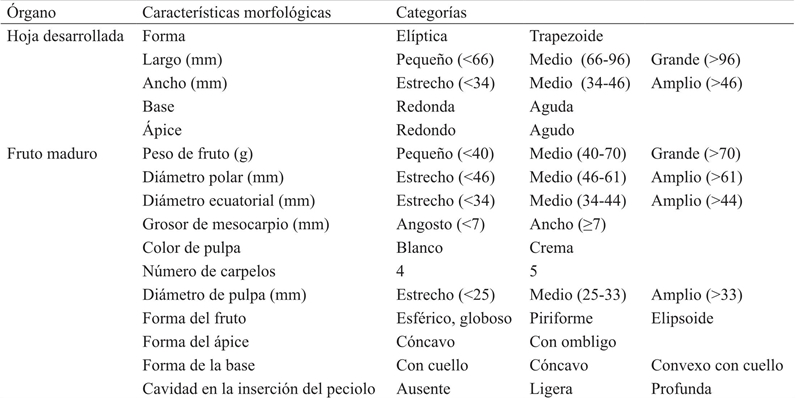
Samples and photos of fruit and leaf were collected during the period 2012-2013 by randomly selecting one tree per orchard in 140 of the 423 gardens reported for the guava production area in Calvillo, Aguascalientes (SAGARPA, 2012). The fruit and leaf morphology was described according to the classifications established by UPOV (1987) and supplemented with other descriptions (Sánchez and Peña, 2011; Sanabria, 2005). In total, eight morphological descriptors were used for fruit: weight, size, equatorial diameter, number of carpels, shape, apex shape, base shape and cavity shape. For leaf: length, width, shape (of the complete leaf), apex shape and shape of the base. For the quantitative data, classification ranks were established in descriptive categories such as “small” , “medium” and “large”; or ordinal type labels according to the case (Table 1).
Extraction of genomic DNA
The collected leaves were the source of the DNA, extracting it by the method of Doyle and Doyle (1990) with some modifications. The method consisted of grinding 100 mg of clean sheet with mortar and liquid nitrogen. The powder obtained was placed in a microcentrifuge tube containing 750 μl lysis buffer (100 mM Tris-HCl pH 8; 50 mM EDTA pH 8; 2% CTAB; 2M NaCl, 2% PVP 40; 3% β-mercaptoethanol) preheated to 65 °C and stirred for three minutes. Subsequently, a volume of chloroform-isoamyl alcohol (24:1) was added, carefully mixing for five minutes to pass a 15 min centrifugation at 13 000 rpm.
The aqueous phase was transferred to a new tube and a volume of chloroform-isoamyl alcohol was added, repeating the above procedure. Once the supernatant was taken into a new tube, 5 μL of RNase (10 mg mL-1) was added and incubated for 30 min at 37 °C.
A volume of cold isopropanol was added, incubated for 10 min at -20 °C and centrifuged for 10 min at 13 000 rpm. The supernatant was discarded and the pellet was washed with 500 μL of 70% ethanol vortexing. After centrifuging the tubes at 13 000 rpm for 10 min, the supernatant was discarded. The excess ethanol was dried by evaporation and the pellet was suspended in 50 μL of TE (10 mM Tris-HCl pH 8; 1 mM EDTA pH 8). The DNA concentration in the sample was determined by a spectrophotometer (UV-6100A UV/VIS, Metash, Shanghai) and the samples were stored at -20 °C.
Procedure for performing the RAPD
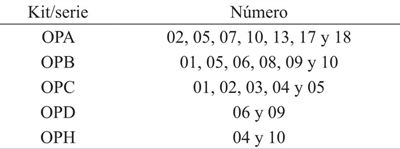
The equipment with prepared DNA amplification reagents (GoTaq® Green Master Mix, PROMEGA) was used by PCR, following the manufacturer’s instructions. After several tests to define the optimal conditions of DNA concentrations, primer concentrations and alignment temperatures, the parameters for the PCR reaction mixture (Table 2) and for the program of the thermocycler Techne TC-512 Thermal Cycler (Bibby Scientific Ltd., UK) (Table 3). A total of 22 random decamer primers designed by Operon Technologies and produced by IDT (Integrated DNA Technologies, USA) (Table 4) were tested. The amplification products were routinely run on 2.5% agarose gel with 1x TBE buffer for 2:45 h by applying 65V. Approximate molecular weight was referenced by molecular weight markers (50 bp, invitrogen).


Elaboration of dendrograms and their analysis
The categorized data of molecular or morphological origin (based on absence/presence, or at predetermined range scales) were analyzed using the software Primer 5 (version 5.2.8 for Windows). The method of analysis of similarity was the one of clusters with the algorithm of Bray-Curtis with transformation of square root. With the generated similarity matrix, dendrograms were constructed based on the group average method (Clarke and Gorley, 2001). The Spearman correlation range of the variables considered in the similarity matrix was performed in multiple runs, and the best calculated value was reported by taking five variables at a time per run for each of the dendrograms.
Results and discussion
Dendrogram analysis based on morphological data
When analyzing the 16 morphological characters of leaf and fruit guava specimens were found that were classified in two or three categories according to the descriptor. Eleven characters correspond to mature fruit and five to developed leaf (Table 1). Analysis of the morphological data set showed a similarity range of 87 to 100% (Figure 1), with a Spearman correlation range of r= 0.719, which differs substantially from the results obtained with RAPDs. However, these results are comparable to those obtained by Muñoz (2012), who used six descriptors for fruit and three for leaf of 79 guava trees belonging to an equal number of orchards. According to their results the range of similarity of morphological characters of Calvillo guavas ranges from 87 to 100% with a correlation range of r= 0.909. In the same way, we have concordance with the results of Kujal et al. (2005), since they found that the RAPD data obtained by them presented much greater divergence than the morphology data. This could be evidence that during the evolutionary process the markers of neutral DNA polymorphisms have no effect on the ability of living beings to survive in the environment, and therefore, are not subject to selection pressure as occurs with the coding sequences. The results of Domínguez et al. (2005), also indicate that changes occurring at the genome level in guava do not always correspond to those observed in the phenotype. Gomes et al. (2010) on the other hand, found partial agreement between the methods of clustering of RAPD markers and the morphological descriptors of guava. In contrast, Feria (2008) was able to associate three specific bands of a RAPD pattern with the accumulation of quercetin in guava.
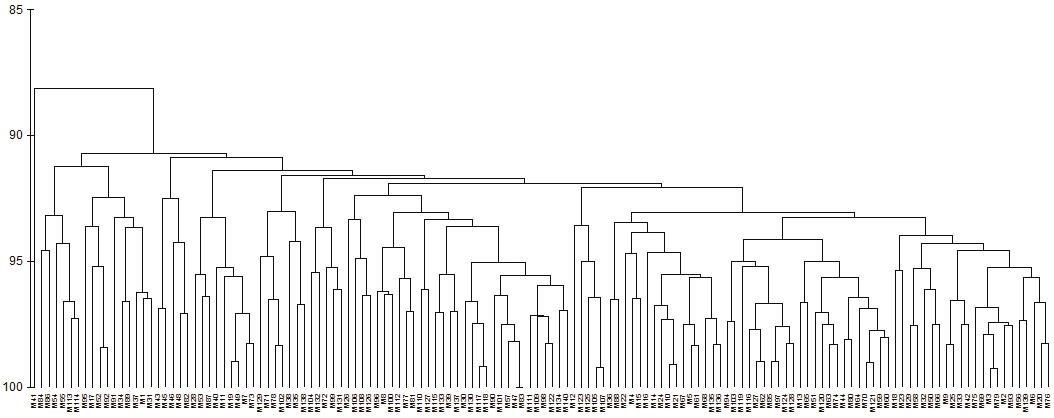
Figure 1 Cladistic analysis based on morphological data. Spearman correlation r = 0.719; A= fruits with an elliptical basis;B= genotypes with mean leaf length and width; C= round fruits with equatorial diameter >44 mm and thickness of mesocarp >7 mm; D= fruits with four carpels and weight (40-70 g); E= fruits of piriform aspect with white pulp.
Because the present work did not find a clear relation between the molecular markers and the guava descriptors, the morphological characters were analyzed separately, being found that five groups were generated in the similarity range between 91 and 94% described with their labels (Figure 1)
Dendrogram analysis based on RAPDs
From the preliminary tests with the primers polymorphic bands were found in several primers of the series OPA and OPH produced as a function of the genotype (Figure 2). The 10 polymorphic bands were used to elaborate the dendrogram based on RAPDs. The similarity values calculated for the 140 genotypes ranged from 25 to 100% and a Spearman correlation coefficient r= 0.794 (Figure 3), which coincides with that obtained by Muñoz-Rodríguez (2012), who found a range of 30 to 100% similarity with a correlation range of r= 0.927 using RAPDs of only 26 genotypes from the Calvillo producing zone with series primers OPA (10, 05 and 07) and OPB (01 and 09).
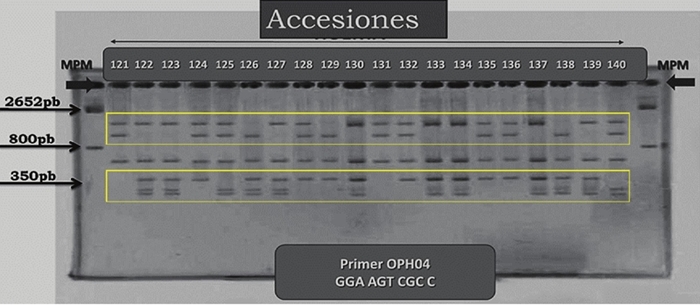
Figure 2 Example of gel showing polymorphic bands (within the yellow rectangles) by RAPD in guava using the OPH-04 primer. At the top of the gel the codes assigned to the samples were recorded in the order in which they were sampled.MPM= molecular weight marker.
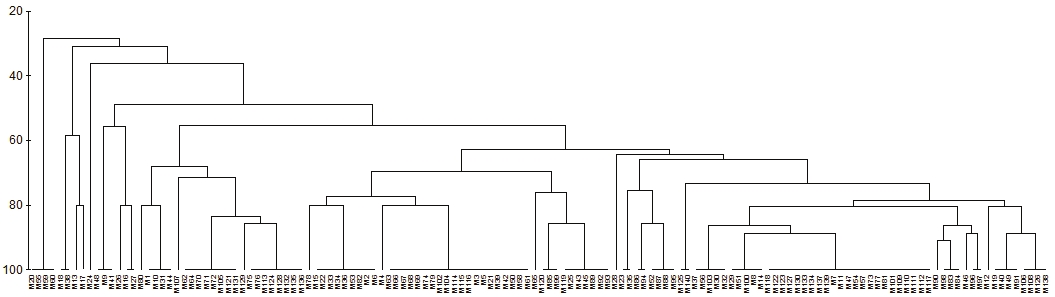
Figure 3 Cladistic analysis based on RAPD performed with 140 guava DNA samples from Calvillo, Aguascalientes. Labels correspond to consecutively numbered samples. Correlation of Spearman observed r= 0.794.
There is not clear relationship between the presence of a specific band with the morphological characteristics of the leaves or fruits of the sampled trees. This also coincides with the results of Muñoz (2012) even though the number of samples was equivalent to one fifth of the number of samples of the present work. The RAPDs in guava have been proposed to relate them to morphological characters or level of domestication. For example, Tseng-Wei et al. (2007) were able to identify two major guava groups from Taiwan using dendrogram derived from RAPD: commercial genotypes and wild genotypes. The latter group included two subgroups that generally distinguished between white pulp guavas and red pulp guavas. No RAPD band could be related to these groups.
In another case, with primers OPA-02 and 03, Ahmed et al. (2011) observed 33.2% polymorphic banding, which served to determine the genetic distances of 33 guava genotypes in a small range (0.5253-0.6631) range index. According to the authors, one of the clusters found is closely related to the morphology of the cultivated genotypes. Bajpai et al. (2008) obtained two different dendrograms of 22 guava genotypes using RAPD and direct DNA minisatellite amplification (DAMD) with genetic distances of 5 to 43%. The authors mentioned that the genotypes of the plains of the Indo-Ganges region are compacted into a single group, thus showing that RAPD markers can give a pattern of identification at least for that group.
Conclusions
The polymorphic bands were found using the RAPD technique in randomly selected guava trees from 140 orchards in the Municipality of Calvillo, Aguascalientes. The RAPD type markers obtained in this work and earlier, show the existence of great variability at the molecular level among the individuals present in the sampled orchards. These markers may be useful for the selection of outstanding genotypes that are to be propagated for used in genetic improvement programs assisted by molecular markers.
On the other hand, the groupings using morphological characters showed less variability, and did not correspond to the groupings generated by RAPDs. However, the process of searching for molecular markers associated with guava morphological characteristics must continue, especially for the identification of selected genotypes for assisted improvement. Alternatively, because the local guava growers who vegetative propagate their material are aware of the variability of their genotypes and recognize the best, it would be appropriate to use the RAPD technique to corroborate the genetic uniformity of the propagating material.
Literatura citada
Ahmed, B.; Mannan, M. A and Hossain, S. A. 2011. Molecular characterization of guava (Psidium guajava L.) germplasm by RAPD analysis. Inter. J. Natural Sci. 1:62-67. [ Links ]
Bajpai, A.; Chandra, R.; Rajan, S. and Srivastava, N. 2008. RAPD and minisatellite markers for genetic diversity and relationship in guava varieties. Ind. J. Genetics. 68:441-445. [ Links ]
Chandra, R. and Mishra, M. 2007. Biotechnological interventions for improvement of guava (Psidium guajava L.). In: Singh, G.(editores). Proc. 1st IS on Guava, ISHS. Acta Horticulturae.735:117-126. [ Links ]
Clarke, K. R. and Gorley, R. N. 2001. Primer v5: User Manual/Tutorial Primer-E Ltd., Plymouth. 91 p. [ Links ]
Domínguez, A, J. L.; Legaria, S, J. P.; Nieto, A. R.; Barrientos, P. A.F. y Pineda, P. J. 2005. Variabilidad genética según RAPD de árboles de guayabo ‘Media China’ procedentes de cuatro plantaciones y su respuesta morfológica a baja disponibilidad de nutrimentos. Rev. Chapingo Ser. Hortic. 11:329-343. [ Links ]
Doyle, J. J. and Doyle, J. L. 1990. Isolation of plant DNA from fresh tissue. Focus (USA). 12:13-15. [ Links ]
Feria, R. I. A. 2008. Clonación y caracterización de fragmentos RAPD y loci microsatélite, asociados a Psidium guajava L. cultivada en cuatro estados de la República Mexicana. Tesis doctoral.Universidad Autónoma Metropolitana. 271 p. [ Links ]
Gomes, F. A.; Gonçalves, O. J.; Pio, V. A.; de Oliveira, S. A. P; Góes,O. M. and Gonzaga, P. M. 2010. Marcadores moleculares RAPD e descritores morfológicos na avaliação da diversidade genética de goiabeiras (Psidium guajava L.). RAPD molecular markers and morphological descriptors in the evaluation of genetic diversity of guava (Psidium guajava L.). Acta Sci.Agron. 32:627-633. [ Links ]
Grattapaglia, D.; Vaillancourt, R. E.; Shepherd, M.; Thumma, B. R.;Foley, W.; Külheim, C.; Potts, B. M. and Myburg, A. A. 2012.Progress in Myrtaceae genetics and genomics: eucalyptus as the pivotal genus. Tree Genetics Genomes. 8:463-508. [ Links ]
ISAAA. 2015. Pocket, K. No. 19: molecular breeding and markerassisted selection. International service for the acquisition of agri-biotech applications. http://www.isaaa.org/resources/publications/pocketk/19/default.asp. [ Links ]
Kujal, S.; Chakrabarti, S. K.; Pandey, S. K. and Khurana, S. M. P.2005. Genetic divergence in tetraploid potatoes (Solanum tuberosum subsp. tuberosum) as revealed by RAPD vis-à-vis morphological markers. Potato J. 32:17-27. [ Links ]
Liu, X. and Yang, G. 2012. Assessment of clonal fidelity of micropropagated guava (Psidium guajava) plants by ISSR markers.AJCS. 6:291-295. [ Links ]
Mehmood, A.; Jaskani, M. J.; Ahmad, S. and Ahmad, R. 2013. Evaluation of genetic diversity in open pollinated guava by iPBS primers.Pak. J. Agri. Sci. 50:591-597. [ Links ]
Muñoz, R. P. J. 2012. Caracterización genotípica de accesiones de guayaba(Psidium guajava) mediante RAPD. Tesis de Maestría. DEPI,Instituto Tecnológico El Llano, Aguascalientes. 146 p. [ Links ]
Nogueira, A. M.; Guilhen, J. H. S.; Mangaravite, E.; Ferreira, A. and Ferreira, M. F. S. 2012. Discriminant analysis of wild guava tree by morphological descriptors and microsatellites. Proc. In: 3rd International Symposium on Guava and Other Myrtaceae. 15 p. [ Links ]
Padilla, R. J. S.; González, G. E y Esquivel, V. F. 2002. Cultivares y germoplasma. In: González, E. G.; Padilla, R. J.; Reyes, M. L.;Perales, C. M. A. y Esquivel, V. F. (eds.). Guayaba: su cultivo en México. SAGARPA-INIFAP-CIRNOC-CEP. Libro técnico Núm. 1. 34-48 pp. [ Links ]
Padilla, R. J. S.; González, G. E.; Esquivel, V. F.; Mercado, S. E.;Hernández, D. S. y Mayek, P. N. 2002. Caracterización de germoplasma sobresaliente de guayabo de la región Calvillo-Cañones, México. Rev. Fitotec. Mex. 25:393-399. [ Links ]
Padilla, P. J. S.; González, G. E.; Perales, C. M. A.; Reyes, P. H. R. y Osuna,C. E. S. 2007. Variabilidad del fruto de la guayaba (Psidium guajava L.) mexicana. INIFAP-CIRNOC-CEPAB. Publicación especial Núm. 31. 68 p. [ Links ]
Perales, C. M. A.; Padilla, R. J. S.; González, G. E. y Reyes, P. H. 2005.Manual para la producción integral del cultivo de la guayaba.México. INIFAP. Pabellón de Arteaga, Aguascalientes. 9 p. [ Links ]
Provan, J.; Thomas, W. T. B.; Forster, B. P. and Powell, W. 1999. Copia-SSR: a simple marker technique which can be used on total genomic DNA. Genome. 42:363-366. [ Links ]
Quesada P, M. L.; Perales, C. M. A.; Consuelo, T. F. J.; González, G. F.F. y Reyes, P. R. R. 2005. Manual para la producción integral del cultivo de la guayaba. Fundación Produce AguascalientesA. C. Campo Experimental Pabellón, INIFAP y Consejo Nacional Mexicano de la Guayaba, A. C., Aguascalientes,Aguascalientes. 61 p. [ Links ]
Rai, M. K.; Phulwaria, H. M.; Gupta A. K.; Shekhawat N. S. and Jaiswal U. 2012. Genetic homogeneity of guava plants derived from somatic embryogenesis using SSR and ISSR markers. Plant Cell Tissue and Organ Culture. 111:259-264. [ Links ]
SAGARPA (Secretaría de Agricultura, Ganadería, Desarrollo Rural,Pesca y Alimentación). 2012. Plan rector del sistema producto guayaba estado de Aguascalientes. http://dev.pue.itesm.mx/sagarpa/estatales/ept%20comite%20sistema%20producto%20guayaba%20aguascalientes/plan%20rector%20que%20contiene%20programa%20de%20trabajo%202012/pr_guayaba_aguascalientes_2012.pdf. [ Links ]
Sanabria, O. H. L. 2005. Caracterización morfológica en árboles nativos de guayaba en el valle del cauca. Tesis de maestría. Universidad Nacional de Colombia. Palmira, Colombia. http://www.bdigital.unal.edu.co/13077/2/118-1103-2-pb.pdf. [ Links ]
Sánchez, U. A. B. and Peña, V. C. B. 2011. Morphological descriptor for genus psidium characterization. Rev. Fac. Agron. 28:303-343. [ Links ]
Servicio de Información Agroalimentaria y Pesquera (SIAP). 2015.Servicio de información agroalimentaria y pesquera. http://www.siap.gob.mx/cierre-de-la-produccion-agricola-porcultivo/. [ Links ]
Shiddalingeswara, T.; Saroja, S.; Nalina, M. and Chandrashekara, K. N.2014. Molecular analysis of variants identified from orchards growing with micro propagated Robusta banana (Musa spp.‘AAA’) using RAPD markers. IOSR. J. Agric. Vet. Sci. 7:25-30. [ Links ]
Tseng, W. C; Chang, C. N. G; Chung, Y. W and Yuan, T. S. 2007. Molecular identification and analysis of Psidium guajava L. from indigenous tribes of Taiwan. J. Food Drug Analysis. 15:82-88. [ Links ]
UPOV. 1987. Guidelines for the conduct of tests for distinctness,homogeneity and stability. Guava (Psidium guajava L.)booklet. 27 p. [ Links ]
Valdés, I. H. J.; Rodríguez, M. N. N.; Bautista, A. M.; Ortíz, G. M. M.;Quiroz, M. A.; Sánchez, T. L. F.; Risterucci, A. M. y Rohde,W. 2012a. Microsatélites desarrollados en guayabo (Psidium guajava L.) y su utilidad para evaluar diversidad en la familia Myrtaceae. Rev. Colomb. Biotecnol. 12:1-9. [ Links ]
Valdés, I. H. J.; Rodríguez, M. N. N.; González, L.; Velázquez, P. J. B.;Rivero, R. D.; Sourd, M. D. G.; Martínez, G. F. y Rodríguez,R. J. A. 2012b. La biotecnología como herramienta para la propagación, conservación y el mejoramiento genético del guayabo. Rev. Colomb. Biotecnol. 14:7-19. [ Links ]
Varela, G. H. 2010. Fábrica de dulces y empaque de exportación de guayaba a los Estados Unidos “Flor de Calvillo”. Programa elaboración de casos de éxito de innovación en el sector agroalimentario. Fundación Produce Aguascalientes. http://www.siac.org.mx/fichas/23%20aguascalientes%20guayaba%20vf.pdf. [ Links ]
Received: February 2017; Accepted: March 2017
 Este es un artículo publicado en acceso abierto bajo una licencia Creative Commons
