


Serviços Personalizados
Journal
Artigo
 texto em
  Inglês (pdf)
 Artigo em XML
 Referências do artigo
 Enviar este artigo por email
Indicadores
-
 Citado por SciELO
 -
 Acessos
Links relacionados
-
 Similares em
SciELO
Similares em
SciELO
Compartilhar

 Permalink
Revista mexicana de ciencias agrícolas
versão impressa ISSN 2007-0934
Rev. Mex. Cienc. Agríc vol.7 spe 15 Texcoco Jun./Ago. 2016
Articles
Effect of the intervention of an agent of change in local innovation networks
1Centro de Investigaciones Económicas Sociales y Tecnológicas de la Agroindustria y la Agricultura Mundial (CIESTAAM)-Universidad Autónoma Chapingo (UACh). Carretera México-Texcoco km 38.5, Chapingo. Estado de México, C. P. 56230. (jsanchez@ciestaam.edu.mx; tartalian04@gmail.com).
The aim of this research was to analyze over time the impact of the intervention agency innovation management (AGI) in small sheep farms in the State of Mexico. The network of 78 sheep producers in Atlacomulco and Jilotepec Mexico State delegations were mapped for three time points: moment I, before surgery (2007); moment II, with the intervention (2009) and moment III, after the intervention (2011). The unequal attention (direct and indirect) provided by the agent of change to sheep farms caused significant differences between groups. During the intervention of the AGI, producers with direct care improved their position in the network, the value of social indicators (grade and input coverage) and their level of adoption of innovations was higher (p< 0.01) than indirect attention. The impact of the intervention of the change agent in sheep farms with indirect attention was reflected in the association of social indicators (output level, nodal density and power bonacih) and adoption of innovations (p< 0.1). It is concluded that the change agent to intervene by selecting a population with direct care in network innovation, favors the number of connections between producers, facilitates access, exchange and scope of information between producers.
Keywords: adoption and diffusion of innovations; direct and indirect care; coverage
El objetivo de la presente investigación fue analizar a través del tiempo el impacto de la intervención de la agencia de gestión de la innovación (AGI) en pequeños ovinocultores en el Estado de México. Se mapeó la red de 78 productores de ovinos en las delegaciones Atlacomulco y Jilotepec del Estado de México, durante tres momentos de observación: momento I, antes de la intervención (año 2007); Momento II, con la intervención (año 2009) y momento III, posterior a la intervención (año 2011). La atención desigual (directa e indirecta) brindada por el agente de cambio a los ovinocultores provocó diferencias significativas entre los grupos. Durante la intervención de la AGI, los productores con atención directa mejoraron su posición en la red, el valor de sus indicadores sociales (grado, y cobertura de entrada) y su nivel de adopción de innovaciones fue mayor (p< 0.01) que los de atención indirecta. El impacto de la intervención del agente de cambio en los ovinocultores con atención indirecta se reflejó en la asociación de sus indicadores sociales (grado de salida, densidad nodal y poder de bonacih) y su adopción de innovaciones (p< 0.1). Se concluye que el agente de cambio al intervenir mediante la selección de una población con atención directa en la red de innovación, favorece al número de conexiones entre productores, facilita el acceso, intercambio y alcance de la información entre productores.
Palabras clave: atención directa e indirecta; adopción y difusión de innovaciones; cobertura
Introduction
In Mexico, production of sheep is a common activity in rural communities and is a supplement to the income of producers. Nationally in 2013 was held an inventory of 8.5 million head of sheep (SIACON-SAGARPA, 2015) produced by around 3.6 million production units (UP) whose activity is sheep farming (INEGI, 2015). The sheep production is concentrated almost five states that account for about 50% of the national sheep inventory, being the State of Mexico's leading producer with a contribution of 16.3% of inventory (1.4 million head), followed in order of importance the state of Hidalgo with 13.7%, Veracruz with 7.8%, Oaxaca with 6.1% and Puebla with 5.9% (SIACON-SAGARPA, 2015).
Over the past 13 years (2000-2013), sheep inventory in the country has had an almost linear trend, the average annual growth was 2.8% on average, similar to the State of Mexico (2%), the main producer. Thus, to meet domestic demand has been necessary to import sheep carcasses or heads up for slaughter. However, given the importance that represents the activity, it has sought to boost output growth through dynamic innovation in the production units.
In the above regard, in 2007 an agency for innovation management (AGI) in the sheep chain to operate a strategy of innovation management in 10 municipalities in the State of Mexico is formed; a change agent with the particular feature of using networks of technical knowledge or innovation network of producers to spread innovations; understanding the innovations and changes that are based on knowledge to generate value (COTEC, 2006), and are relatively new to business. On the other hand, an innovation network is a type of social network, a set of different types of actors set around a production system, whose functions combine to promote individual and collective development (Rendón et al., 2009). The actors who are part of this type of network exchange information, ideas and knowledge in order to learn and innovate (González and Chávez, 2008).
The network analysis to manage innovation, requires additional information to make an assessment of the effects caused by external agents. Although in recent years has increased the interest in understanding the role of social interaction in the innovation process (Rogers, 2003; Monge and Hartwich, 2008; Arteaga and Lasio, 2009), little research has focused on analyzing the results of the intervention of agents changes the innovation network over time. Usually, studies tend to be limited to the analysis of network status in only at a moment of the intervention process (Zarazúa, 2007; Reyes, 2013). The aim of this research was to analyze the impact of the intervention of an agent of change in network innovation sheep farms for the dissemination of innovations in the State of Mexico.
Materials and methods
This study used social network analysis (ARS), a methodology to analyze the connection between different types of actors in a network and overall network structure that emerges from the social relations that they establish (Sanz, 2003).
Study population
The study was conducted in 10 municipalities in the State of Mexico, geographical territory in which the agency for innovation management (AGI) held its technical assistance and training: El Oro, Ixtlahuaca, San José del Rincón, Acambay, Temascalcingo, Aculco, Chapa de Mota, Jilotepec, Soyaniquilpan and Timilpan. We interviewed 78 sheep farms served by the AGI during the intervention period, of which 31 received direct care and 47 indirect care. The first type of care was to provide the producer personalized monitoring by field logbooks and individuals in their production units visits. This group was selected by its position in the network, level of innovation adoption and willingness to implement the practices suggested in their production units; and the second type of care, was to provide producers training courses and workshops collectively.
Information collection instrument
An interview for application was designed to producers in their production units, its structure corresponded to two major themes of research, innovation network producer regarding its sources of information or technical learning and innovation dynamics in the unit of production.
A catalog of 24 sheep innovations related activity and classified into five categories (organization, reproduction and genetics, facilities and hygiene, nutrition and health); to whether or not particular innovation practice sheep farms were asked to measure the degree of adoption by producers. In case of innovation in its production unit they were questioned about the sources of information. Mapping technique or innovation network was built from the question who has learned, or who uses when a problem arises in his flock? The condition for membership in the innovation network was being reported by respondents sheep farms or be among the surveyed population.
The study incorporates data sheep farms from august 2007 to june 2011. The survey was conducted in three time points: the moment I, in august 2007 through the baseline survey (ELB), which served as diagnosis (preoperatively) for the study of the innovation process and network structure; the moment II, in June 2009 with the final line survey (ELF) was performed at the end of the period of operation of the AGI to observe the changes caused by the intervention; and the moment III, in april 2011, an evaluation survey (EE) in order to assess changes in the structure of social network of producers and their level of innovation two years after the intervention of the agent was applied change.
In the intervening period of the AGI, from 2007 to 2009 (moment I to moment II), the AGI managed the interaction between producers to disseminate technical innovations with impact on production; for which he carried out various activities such as workshops, tours exchange of experiences between producers and demonstration days. The AGI stopped providing professional services of technical assistance and training in july 2009 and two years later in 2011 returned to the area to assess the continuity of innovations by producers and rafters in their innovation network.
Indicators used
With the Ucinet 6,288 software indicators networks (size, density, degree, power Bonacich and nodal density) is calculated, and the coverage of the actors were made in the Key Player 2. Each of the indicators software described below:
Network size. It is the number of nodes (actors) that are in a network (Zarazúa, 2007).
Network density. Quantifies the average amount of bonds that are created within the (Gaete and Vásquez, 2008) network, is expressed as the percentage of existing relations between possible. In this sense, the node density is the number of the actor links divided by the number of pairs multiplied by 100. It is calculated from the following formula:
The density (D) equals the number of relationships (L) between the numbers of possible relations n (n-1).
Degree. Their analysis indicates the most connected person in the group, the greater centrality. The degree of influence or be influenced by other people who are in the (Quiroga, 2003) network. It is determined by the expression:
Where: the degree is equal to the sum of the relationships between the analyzed Actor (i) and the rest (j) is j input or output, the number of players minus 1 (n-1) 100 (Rendón et al., 2007).
Bonacich power index. The power of the actor, is a function of how many connections you have and the actors associated with it. Being connected to others who are not connected makes the powerful actor, because these actors depend on it, the fewer connections they have with their environment, the more powerful (Hanneman, 2000).
Broadcast coverage. A diffuser located one actor from his position to access the largest number of actors (nearby). Their existence is valued for its potential to transmit. It is calculated using the following algorithm (15):

The letter R is used as a short range.
Rate of adoption of innovations (InAI). It refers to the innovative capacity of the producer and is calculated by considering the number of practices by the producer at a certain moment of total practices defined in a catalog:
Where Innovjn is the presence of the j-th innovation N innovations n and n is the total number of innovations.
Information analysis
Finally, statistical analysis of the data was performed. The test "t" was used in independent samples to analyze differences in the mean rate of adoption of innovations and indicators of the innovation network between the population of producers with direct care and indirect care preoperatively, during and after the intervention of the change agent. The test "t" in related samples was used to measure the increase or decrease in the adoption of innovations and indicators of networks of producers by the intervention effect of AGI. Finally, the association between the levels of adoption of innovations producer with its position in the network at any given time was measured using the Pearson correlation.
Results and discussion
The influence of the change agent in the innovation network of sheep farms
At the moment I, the network was dismantled and with great dispersion of the actors. The 9% of the total respondent’s producers are displayed as loose network nodes as they do not mention any sources of information. The network density is low, 0.56% was achieved compared to 100% of the potential connection between the 163 players who made up the network, which shows the lack of integration and interaction among producers.
The actors referenced in the network as sources of information were other producers with 47%, professional service providers (PSP) with 26%, input suppliers with 13% and other 14%, which showed the lack of diversity of sources learning network. The main actors of prestige, which provided information to sheep farms were six (input suppliers and professional service providers) and had broadcast coverage of 25.5% of all players who were on the network.
On the other hand, the 31 producers selected by the AGI to provide direct care, had a 4.6% coverage as sources of information and 41.7% as seekers or collectors of information. The data show that the network structure, the elected had little recognition and is distinguished by being recipients of information.
At the moment II, the network consisted of 141 players, which showed 214 consolidated relations. The network size is smaller than in the previous period, however relationships tend to increase, so that the density increased to 1.08%. However, this level of connectivity is not uniform across the network ownership, there are certain areas where there is greater connectivity, which makes a marked inequality to access information or existing knowledge on the network.
In the network structure a center and a periphery, the center is the AGI who became the leading provider of information and knowledge network around (first wave) are the producers direct care is identified who interacted face to face with the technical assistance agency who provided training and personalized way, and in a second wave of indirect care producers are located, those who eventually interacted with the agency and direct care producers. On the periphery of the network, you can identify groups of producers that the only way to access the information f lowing on the network is via some intermediary node (Figure 1).

References focus on change agents with 53% (30% members of the AGI and 23% other technicians), but producers still have a high percentage of mentions with 32%, input suppliers with 11% and other 4%. Thus, although extension agents provide an important channel of information but they are not the only source of learning about new technologies (Moore et al., 2001) for producers, but may use other actors in the network.
The AGI during their intervention was positioned in the innovation network of sheep farms, becoming a prestige actor and the leading provider of network information. The reached up to 64 references as a source of learning; that is, 82% of respondents producers recognized it as their main source of information. This was expressed in a broadcast coverage of 47.9%, which shows that had access to almost half of the actors in the network and reveals its importance as articulator actor.
The 31 producers who had direct care by AGI, tripling its coverage as information providers with respect to the initial 15.5% and had an increase of 3.8% as seekers or collectors of information with a value of 45.5%. These data show that their prestige or popularity in the network increased, which could occur due to this group of producers had private visits and monitoring by log, so their knowledge on innovations increased to a greater extent than other producers and they were referred to other sheep farms.
At the moment IIi, two years after the intervention of the AGI in the area, the network structure is observed more dispersed than in moment II. The network density was 1.08%, as in the moment II. However, the number of actors in the network decreased to 128 actors and with following possible relationships. References continue to focus on change agents with 62% (38% members of the AGI and 24% other technical), producers reduce its stake to 21%, input suppliers with 13% and others 4%. This indicates a trend of producers to become more selective in their sources of information because it is not the same quality of information received from a technician or member of the AGI to a producer, buyer or other actor.
The AGI remained the actor's referred to as a source of learning even though he was no longer in the area, had the same 66 references at the moment ii. Its coverage was increased by 5%, which is explained by the decrease in the size of the network. The coverage obtained by the 31 producers with direct care as sources of learning decreased by 10.3% compared to the moment ii, being only 5.2%. Like, your coverage as searchers or collectors had a decrease of 10.4%, with 35.1%. This decrease in the number of references could be explained because knowledge passes to the public domain or dispersed in the network and producers with indirect attention no longer have to necessarily resort to an intermediary node to learn of innovations (mainly the producer carefully direct), so another reason could be that become selective in their sources of information, considering the quality of the information.
Differences between the population served by the change agent directly and indirectly
At the moment I, before the intervention of the AGI, the initial InAI was 38.98% for the group of producers with direct care, and 31.21% for indirect care, i.e., some of the innovations already been adopted by the producers. The direct care sheep farms showed a higher degree of adoption of innovations that indirect care, with a significant difference (p< 0.05) of 7.77%. Also, this group have slightly different network indicators, however, they are not significant (p> 0.05) because the network structure is scattered and diffuse.
At the moment II, with the intervention of the change agent with direct service producers they had a better positioning in the network compared to other members of the same, and in turn, a higher level of innovation. The number of entries received from other producers (degree of input) and number of mentions that the producer made to others as a source of technical learning (level of output) was significantly higher with the 0.32 and 0.3% respectively compared to those who received indirect attention. Like, they had a higher power index (0.19%) on the net and a big difference in the adoption of innovations of 20.79%. The change agent acted as an interlocutor in the system and create suitable for users knew and implement innovations (Pérez, 2004) conditions. Therefore, after the AGI held management actions for innovation for 22 months, the rate of innovations for both types of stocks increased to 75.4 and 54.61%.
In the above sense, it is considered that the relevant elements at this time are communicating with their peers (Talukder, 2012) and social networks (Frambach and Schillewaert, 2002); as producers on the periphery (indirect attention) they could only get the information and knowledge about innovation through direct connection to a node with power or intermediary with AGI. So, producers with direct care increased by 0.33% coverage input or multiplier effect, i.e. conveyed innovations learned by the AGI other producers (second wave broadcast), equivalent to telling a rumor to friend of a friend.
At the moment III, there were no statistically significant differences in both the level of innovation indicators networking among population types of producers (p> 0.01). The sheep farms mostly continued to perform the set of practices in the production units, although they no longer had the attention of an agent of change; and if there was a decrease in their level of adoption but this was not significant. In the case of innovation network, due to the dispersion of actors and knowledge on innovations has become public domain, differences in social position of producers with direct care with indirect care tend to decrease.
In general one could say that producers with more social connections and actively seek information, may be more used to test new technologies than those who are not exposed to innovative ideas (Didier and Brunson, 2004), as they have a criterion wider to make the best decision as to innovate. This can be seen in the population with direct care who show significant differences in their social network indicators of innovation and level of adoption of innovations over producers with indirect attention (Table 1).

Changes in network innovation and adoption of innovations actors
The change agent with his administration managed to change the structure of the network and technical relations that maintained the producer. Their participation increased significantly by 0.32% the degree of entry of producers with direct care (Table 1), because it became a source of learning for other producers (essentially indirect care). In the case of the degree of departure, the two groups showed a significant increase (p< 0.0) of 0.87% for direct care and 0.74% for indirect care, it resulted in greater linkages established by the producer; and large direct connections, which gives the possibility of being influenced to adopt more number innovations (9).
From the moment I to II, the producers also increased significantly its coverage information search (0.94% 1.03% direct care and indirect care) and provision of information producers (0.42% 0.18% direct care and indirect care); that is, with training events conducted by the AGI given the opportunity to interact with producers, exchanging information and knowledge. This, favored greater adoption of innovation as a significant increase of 36.42% for those who received 23.40% direct care and indirect care for shows. Frequent contact with producer’s extension agents increased their knowledge about innovation practices (Moore et al., 2001).
Producers their attention indirect increased indicator of "nodal density"; This suggested an increase in the number of links and therefore its ability of an actor to reach and access to knowledge and information of the other actors in the network, which may also have favored their increased adoption of innovations. According Lewrick et al. (2007) to become a successful company's high performance is vital exchange of knowledge, information and building social ties.
The withdrawal of the AGI, caused significant changes in the structure of the main network links people with direct care. The decrease in "degrees of input and output" as well, that the values of the indicators "coverage input" and "output coverage" indicate fewer links between producers. Also, a decrease of 19.09% InAI he had, which was statistically significant (p< 0.01); however, a net increase of 17.33% InAI took into similar study period the total population change with indirect attention 18.08% (Table 2).
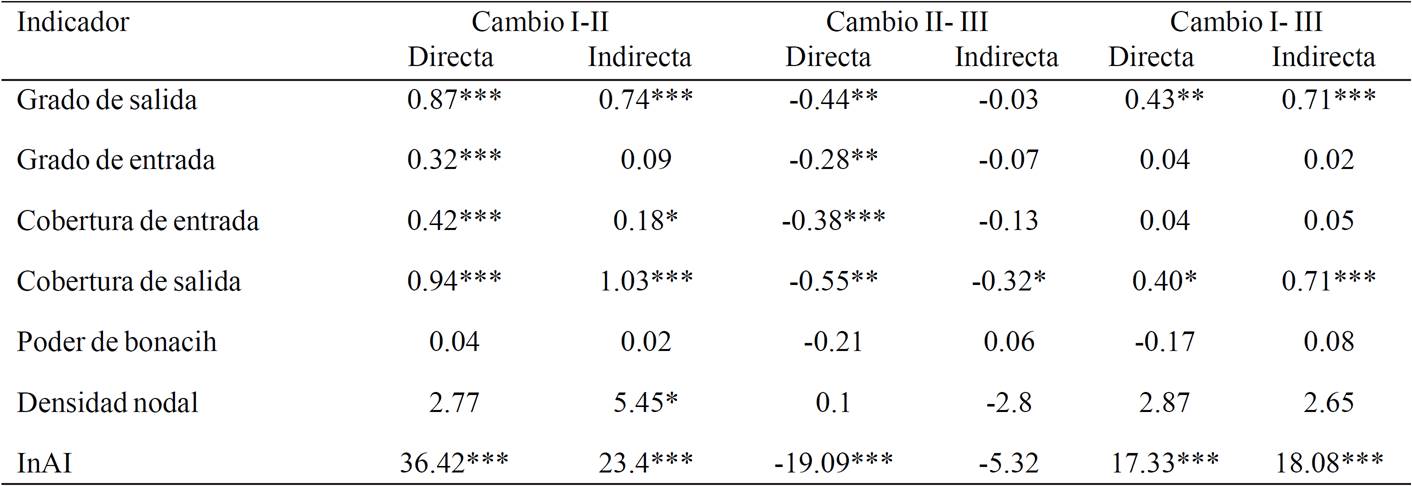
In the case of people with indirect attention had a significant decrease in the output coverage at 0.32%, its scope two steps was lower due to changes in the structure of the network, also decreased its level of adoption of innovations (5.32 %); however, was not as dramatic or significant as these in response to the withdrawal of theAGI, adapted quickly and began to seek information among network members, essentially those receiving direct care during the period of management change agent.
Thus, to take stock of the effects caused by the AGI in the two types of stocks of producers, both increased their output level and coverage, and presented a similar increase innovation throughout the period. Although no longer had the attention of an agent of change, mostly producers continued to make innovation practices in the production units.
Social relations and innovation
At the moment I can see that there is no association between the rate of adoption of innovations and network indicators. However, with the intervention of the AGI, when analyzing the correlation between the variables in the population with indirect attention a positive and significant association between them was found, so you might be attributed to the agent changes in the relationship of variables. Innovation impacts related to linking producers are shown in this population because through its network obtained the information necessary to innovate. Contacts allow us to observe the results that occur when others innovated (Didier and Brunson, 2004), which may encourage the producer also adopted.
The degree of output expressed as the number of gross relationships of a producer, presented a positive and significant correlation (p< 0.05) of 0.290 with InAI, greater search for information leading to greater adoption of innovations in the population with indirect attention, so it was appropriate to extend the number of sources of learning. The indicator "power of bonacih" and "nodal density" also had a positive correlation with the rate of adoption of innovations, while the better their position in the network of sheep keeper and there is a greater number of links established in its core network , belongs to a more dense or cohesive group could access more information for innovation. The adoption by an individual, or a new collective behavior is a function of the behavior of others in the group or system (Valente, 1996).
Two years after the intervention of an agent of change, there is no correlation between indicators of social networks and the rate of adoption of innovations (Table 3), except in the nodal density of population with direct care. This could occur by reducing the rate of adoption of innovations and changes that have occurred in the structure of the network; decrease in stakeholder relations (relations that were broken), actors who joined or left the network, and others changed their position. Some of the breaks may be awarded to the fact that producers tended to be more selective in their information sources innovation network producer tended to have lower connections between actors.

Conclusions
By analyzing two types of population with different care sheep farms AGI three observation moments, allowed assess in more detail the changes result of the intervention of the change agent. AGI with its action modified the structure of the network of innovation sheep farms and the level of innovation of the producer. It became the main actor of prestige or learning resource producers; and as a result of deliberate targeting producer group to provide direct care, the network structure goes from being dispersed to a structure where a center and a periphery is identified; in the center AGI and producers with direct care, which improved its position in the network and its level of innovation significantly unlike producers with indirect attention on the periphery is located.
Two years after completion of the intervention of the AGI in the area it is still referred to as primary source of information, but producers with direct care tend to disperse and mix in the network; and the differences between the two groups in both innovation and its social positioning disappear. This could be explained by the fact that during the period of intervention AGI producers with direct care had a greater increase in their indicators, so in retirement also had a drastic decline. However, it is noteworthy that both types of populations continued to make innovations mostly managed by the agent.
The greatest social impact related to innovation intra operatively change agent in the population had indirect care who changed their way of link to access knowledge and information for innovation. Denoted in a positive and significant association of the level of output, nodal density and power Bonacih with their level of innovation social indicators. This indicates that there is statistical evidence that shows that as a producer seeking information (output level), improve its position in the network and belong to a cohesive group, their level of innovation increases.
The network management innovation by an agent of change is efficient when the amount of improvement in information exchange relations that favors the increase in the level of innovation. The increased efficiency is attributed to the focus on a group of actors with greater power of transmission and dissemination of innovations. In future studies are needed, which will deepen the quality of interaction in the innovation network; which will allow further explore the different roles played by actors, type of information and assessment of the link in the dissemination of agricultural innovations.
Literatura citada
COTEC. 2006. La persona protagonista de la innovación. Madrid, España. 143 p. [ Links ]
Didier, E. A. and Brunson, M. W. 2004. Adoption of range management innovations by Utah ranchers. J. Range Management. 57(4):330-336. [ Links ]
Frambach, R. T. and Schillewaert, N. 2002. Organizational innovation adoption: a multi-level framework of determinants and opportunities for future research. J. Business Res. 55(2):163-176. [ Links ]
Gaete, F. J. M. y Vásquez, J. L. 2008. Conocimiento y estructura en la investigación académica: una aproximación desde el análisis de redes sociales. Redes. Rev. Hispana para el Análisis de Redes Sociales. 5(14):1-33. [ Links ]
González, C. C. H. y Gálvez, A. É. J. 2008. Modelo de emprendimiento en red -MER. Aplicación de las teorías del emprendimiento a las redes empresariales. Academia. Rev. Latinoam. Administración. (40):13-31. [ Links ]
Hanneman, R. A. 2000. Centralidad y poder. Introducción a los métodos del análisis de redes sociales. 192 p. [ Links ]
INEGI. 2015. VIII Censo Agrícola, Ganadero y Forestal. http://www3.inegi.org.mx/sistemas/tabuladosbasicos/default.aspx?c=17177&s=est. [ Links ]
Lewrick, M.; Raeside, R. and Peisl, T. 2007. The innovators’s social network: a cross-sector exploration on the influence of social networks and social capital on innovation and success. J. Technol. Manag. Inn. 2(3):38-48. [ Links ]
Monge, P. M. y Hartwich, F. 2008. Análisis de redes sociales aplicado al estudio de los procesos de innovación agrícola. Redes. Rev. Hispana para el Análisis de Redes Sociales. 14(2):1-31. [ Links ]
Moore, K. M.; Hamilton, S.; Sarr, P. and Thiongane, S. 2001. Access to technical information and gendered NRM practices : Men and women in rural Senegal. Agric. Human Values. 18:95-105. [ Links ]
Pérez, M. y Terrón, M. 2004. La teoría de la difusión de la innovación y su aplicación al estudio de la adopción de recursos electrónicos. Rev. Española Doc. Cient. 27(3):308-329. [ Links ]
Quiroga, Á. 2003. Introducción al análisis de datos reticulares: prácticas con UCINET6 y NetDraw1 Versión 1. [ Links ]
Rendón, R. M.; Aguilar, A. J.; Altamirano, C. J. R.; Muñoz, R. M. 2009. Etapas del mapeo de redes territoriales de innovación. Ed. Centro de Investigaciones Económicas, Sociales y Tecnológicas de la Agroindustria y la Agricultura Mundial (CIESTAAM). Universidad Autónoma Chapingo (UACH). 54 p. [ Links ]
Rendón, R.; Aguilar, J.; Muñoz, M. y Altamirano, J. R. 2007. Identificación de actores clave para la gestión de la innovación: el uso de redes sociales. Ed. Centro de Investigaciones Económicas, Sociales y Tecnológicas de la Agroindustria y la Agricultura Mundial (CIESTAAM). Universidad Autónoma Chapingo (UACH). 51p. [ Links ]
Reyes, G. O. 2013. Relación redes, innovación y aspectos económicos en el cultivo de hule (hevea brasiliensis) en Tezonapa, Veracruz. Tesis de Licenciatura. Centro de Investigaciones Económicas, Sociales y Tecnológicas de la Agroindustria y la Agricultura Mundial (CIESTAAM). Universidad Autónoma Chapingo (UACH). 96p. [ Links ]
Rogers, E. M. 2003. Diffusion of innovations. 5a (Ed.). The Free Press. New York. 520 p. [ Links ]
Sanz, L. 2003. Análisis de redes sociales: o cómo representar las estructuras sociales subyacentes. Apuntes de Ciencia y Tecnología. (7):10. [ Links ]
SIACON-SAGARPA. 2015. Coordinación General de Ganadería. http://www.sagarpa.gob.mx/. [ Links ]
Talukder, M. 2012. Factors affecting the adoption of technological innovation by individual employees: an Australian study. Procedia. Social and Behavioral Sciences, 40:52-57. [ Links ]
Valente, T. W. 1996. Social network thresholds in the diffusion of innovations. Social Networks. 18:69-89. [ Links ]
Zarazúa, E. J. A. 2007. Esquemas de innovación tecnológica y su trasferencia en las agroempresas frutícolas del estado de Michoacán: una perspectiva desde las sociales. Tesis Doctoral. Centro de Investigaciones Económicas, Sociales y Tecnológicas de la Agroindustria y la Agricultura Mundial (CIESTAAM). Universidad Autónoma Chapingo (UACH). 265 pp. [ Links ]
Received: March 2016; Accepted: June 2016
 Este es un artículo publicado en acceso abierto bajo una licencia Creative Commons
