


Servicios Personalizados
Revista
Articulo
 texto en
  Inglés (pdf)
 Artículo en XML
 Referencias del artículo
 Enviar artículo por email
Indicadores
-
 Citado por SciELO
 -
 Accesos
Links relacionados
-
 Similares en
SciELO
Similares en
SciELO
Compartir

 Permalink
Revista mexicana de ciencias agrícolas
versión impresa ISSN 2007-0934
Rev. Mex. Cienc. Agríc vol.7 spe 13 Texcoco ene./feb. 2016
Articles
Relationship between necromass, woody species composition and possible implications of climate change in temperate forests
1 Campo Experimental Centro Altos de Jalisco-INIFAP. Carretera Tepatitlán-Lagos de Moreno, km 8, C. P. 47600, Tepatitlán de Morelos, Jalisco, México. (benavides. juandedios@inifap.gob.mx; chavez.alvaro@inifap.gob.mx; xelhuantzi.jaqueline@inifap.gob.mx).
2 Facultad de Ciencias Forestales, Universidad Autónoma de Nuevo León. (marco.gonzaleztg@uanl.edu.mx).
Anthropogenic action and extreme climatic changes have altered the natural fire regime in a number of forest ecosystems, so it is necessary to know the fuel load, since this is the only factor from the fire triangle that can be manipulated. This study aims to determine surface necromass load available and analyze its relationship with the composition of species in the forest area from the Ecological Campus Iturbide, managed by the Autonomous University of Nuevo Leon. In this area two stands, with presence (P1) and absence (P2) of fire were selected, where loads of dead wood material (MLC) were quantified, fallen leaves horizon (HO) and fermentation (HF), moreover, conducted a sampling of smaller trees (d0.3 ≤ 7.5cm). Among the main findings it was observed that the load of necromass was lower in the area with traces of fire (P1= 36.6 Mg ha-1 and P2= 49.6 Mg ha-1; p< 0.001). As for species composition, 20 were recorded in both plots, though the composition was different, at P1 the species with the highest number of individuals was Quercus sp. (1 401 Nha-1) while in P2 was Rhus virens (1 719 Nha-1), both species with different response to fires. It is important to highlight that pinus pseudostrobus, species with adaptations to fire, had higher density in burned area (P1= 923, P2= 255, p< 0.001). So it can be conclude that species composition is related with necromass loads, and that changes in the natural fire regime due to climate change and anthropogenic activity can alter the composition of these ecosystems.
Keywords: Pinus pseudostrobus; Quercus sp.; Rhus virens; importance value index (IVI); pine-oak forest
La acción antropogénica y los cambios climáticos extremos han alterado el régimen natural de fuego en varios de los ecosistemas forestales, por lo que se hace necesario conocer la carga de combustibles, ya que éste, es el único factor del triángulo del fuego que se puede manipular. El presente estudio tiene como objetivos determinar la carga de necromasa superficial disponible y analizar su relación con la composición de especies en el área forestal del Campus Ecológico Iturbide, manejado por la Universidad Autónoma de Nuevo León. En esta área se seleccionaron dos rodales, con presencia (P1) y ausencia (P2) de incendios, donde se cuantificaron las cargas de material leñoso caído (MLC), el horizonte de hojarasca (HO) y fermentación (HF), además, se llevó a cabo un muestreo del arbolado menor (d0.3 ≤ 7.5 cm). Entre los principales resultados se observó que la carga de necromasa fue menor en el área con rastros de incendios (P1= 36.6 Mg ha-1 y P2= 49.6 Mg ha-1; p< 0.001). En cuanto a la composición de especies, se registraron 20 en ambas parcelas, no obstante la composición fue distinta, en P1 la especie con mayor número de individuos fue Quercus sp. (1 401 Nha-1) mientras que en P2 lo fue Rhus virens (1719 Nha-1), ambas especies con distinta respuesta ante los incendios. Es importante destacar que Pinus pseudostrobus, especie con adaptaciones a los incendios, tuvo mayor densidad en el área quemada (P1= 923, P2= 255; p< 0.001). Por lo que se puede concluir que la composición de especies se relaciona con las cargas de necromasa, y que alteraciones en el régimen natural de incendios a causa del cambio climático y acción antropogénica pueden alterar la composición de estos ecosistemas.
Palabras clave: Pinus pseudostrobus; Quercus sp.; Rhus virens; bosque de pino-encino; índice de valores de importancia (IVI)
Introduction
Each year about 13 million hectares of forests are lost due to deforestation, which has resulted in the breakup the local, regional, national and even worldwide climate balance, exacerbating the threat posed by climate change. One of the causes contributing to deforestation are fires, which require the interaction of biological factors that inf luence the occurrence and behavior of the same, these factors are mainly climate (weather), topography and combustible material (DeBano et al., 1998). Being fuel the only component that can be manipulated, so it is necessary to know the live and dead fuel loads available.
Superficial dead fuels, also known as surface necromass and consist of dead wood material (MLC) and the organic layer of soil (COS), which is composed by the fermentation horizon (HF) and the fallen leaves horizon (HO), (Harmon et al., 1986; Morfin-Rios et al., 2012). Necromass in forests is important for its contribution to fire behavior (Agee, 1993; Pyne et al., 1996), its relation with biodiversity (Harmon et al., 1986) and its contribution to total carbon pool (Ravindranath and Ostwald, 2008). Although it is estimated that its contribution is minimal, ≤ 10% (Ravindranath and Ostwald, 2008), some studies in Mexico show that surface necromass load can reach over 80 megagrams per hectare in temperate forests (Morfin-Rios et al., 2007), which, could be an important point not only for estimating carbon, but to the danger of forest fires.
In addition to carbon dynamics, knowledge of the availability of surface necromass,allow stogenerate models to predict fire behavior (Rothermel, 1972), and to determine the possible effects of fire on vegetation. For example, MLC with diameters ≤ 0.6 cm contributes to spread of fire rate, while fallen leaves layer and fermentation to residual fuel combustion, which increases the mortality of mature trees (Morfin-Rios et al., 2012). However, fire behavior and its effects depend on vegetation type and potential fire regime (Agee, 1993; Rodriguez-Trejo, 2008; Jardel-Pelaez et al., 2009).
Knowing the fire regime in an ecosystem, it is essential for proper handling (Jardel-Pelaez et al., 2009), as it allows to determine how often fires must be, plus forestry practices are best suited to emulate fire effects (Franklin et al., 2007; Perera and Cui, 2010). However, extreme climate change and anthropogenic activity have altered the natural fire regime in many terrestrial ecosystems (TNC, 2004), which is affecting forest health with the increase of fires, pests and forest diseases. That is why this paper aims to characterize the surface necromass and its relationship with species composition in two stands (burned and unburned) in a pine-oak forest in Nuevo Leon, Mexico. It is noteworthy that this work complements two previous studies on diversity (Rubio-Camacho et al., 2014) and forest structure (Rubio-Camacho et al., 2015) in the study area.
Materials and methods
Study area. This research was conducted in the area from the Ecological Campus Iturbide, managed by the Autonomous University of Nuevo Leon. The campus is located 15 km southeast from Iturbide in the state of Nuevo Leon, Mexico, among the range of latitude coordinates 24° 42' to 24° 43' north latitude, and longitude 99° 51 to 99° 53' west longitude (Rubio-Camacho et al., 2014), covers an area close to1 035 ha with an altitude range between 1 200 and 1 890 m (Figure 1).

Figure 1 School forest location in Iturbide, Nuevo Leon. Where: P= plot of 100 x 100 m. Source: Rubio- Camacho et al. (2014).
Two stands with similar physiographic conditions (P1 and P2) were sampled, however, in one of them found fire traces (P1) as bark charred in mature trees and visually there is less surface necromass load. This was taken as a comparison factor in the study.
Field information
For field data collection, an adaptation to the design of sampling sites proposed by Brown et al. (1981) was used. To do this, two permanent plots of 1 hectare each (100 x 100 m) were delimited, within each of these 25 subplots of 400 m2 (20 x 20 m) were drawn, in the center a site as shown in Figure 2 was installed, leaving a total of 25 locations per plot systematically distributed at 20 meters each. With these, a surface necromass inventory was carried out, including the dead wood material (MLC) and the organic layer of soil (COS) that covers the fallen leaves layer (HO) and fermentation (HF). Additional to necromass, this design also allows to take a sample of vegetation which is called lower tree than 7.5 cm in diameter at the height of 0.30 m from the floor (d0.3 <7.5 cm) (Figure 2).
Sampling dead wood material (MLC). A planar intersection technique (Brown, 1974; Brown et al., 1981; Van Wagner, 1982, 1968) was used for this case; which uses a classification of woody parts, based on its thickness and time lag, i.e. how long it takes a woody part in gaining or losing 2/3 of its moisture to a change in the environment. Based on this classification, the woody parts are grouped in diameter categories as: MLC parts 1 hour lag (<0.6 cm in diameter), MLC 10 h (0.6-2.5 cm), MLC 100 h (2.6-7.5 cm) and MLC 1 000 h (> 7.5 cm), the latter also classified between firm and decomposed because wood density is different (Brown et al., 1981).
The planar intersections technique consists to locate a sampling straight line over the forest ground and count all the MLC parts that are through it. In this study 50 sample lines were established, 25 in each plot, each line has a total length of 15 m; MLC parts were recorded at different lengths depending on their time lag, the 1 and 10 h were measured in 2 meters, the 100 h were recorded in 4 meters and fuels of 1 000 h were counted along the sampling line (15 m), also, diameter was measured and determined whether firm (1 000F) or decomposed (1 000D). HO and HF layers were sampled in squares of 30 x 30 cm. Four squares distributed in a systematic way (2 x 2 m) were established, at each site, selecting the one with higher load and fallen leaves and fermentation layer are collected, and then transported to the laboratory to determine their dry weight. The dry weight was obtained with the use of an oven at a temperature of 90 °C until constant weight was reached.
Vegetation sampling. For this study the information from low tree was used, defined between 7.5 and 1 cm in diameter at height of 0.30 m (d0.3) in order to assess species composition in the lower stratum of the stands and how it relates to necromass loads. To measure the latter, circular sites with 2 m radius as proposed by Brown et al. (1981) were established, where species, diameter at 0.30 m, height, and crown diameter of each individual were recorded (Figure 2).
Information analysis
The statistical analysis and graphics presented in this paper were performed using free software license R v3.0.1 (R Development Core Team, 2011) and the routines were created under the software R-Studio v0.9 (RStudio, 2014).
Necromass loads. Is expressed in megagrams per hectare (Mg ha-1) and different formulas are used for the estimation by component. MLC is calculated through the formulas described by Van Wagner (1982) and Morfin-Rios et al. (2012). To determine the loads of fallen leaves, extrapolation to hectare from the 30x30 cm square is used. The formulas to calculate MLC are described below:
Where: C= fuel load (Mg ha-1); k = constant (1.234); DC= squared diameter; DCP= average squared diameter in cm (for 1, 10 and 100 h); GE= specific density or gravity (g/cm2); c= slope correction factor,  and L= transect length (m).
Vegetation analysis
To observe the possible relationships between necromass loads and species composition was performed an analysis of importance values thereof. It took into account environmental density indicators (De), dominance (Do) and frequency (Fr) per species. The density is calculated through the extrapolation of the number of trees on site to the number of trees per hectare (Nha-1). Dominance, as the density is calculated through the extrapolation of the basal area values (G) per site to hectare, per species. Finally, frequency is obtained by counting the number of sites where species appear (Dombois and Ellenberg, 1974).
Ecological importance values for each species are calculated using De, Do and Fr data through their relative values by species, as shown in Table 1.
Species abundance analysis. To analyze species abundance, density data described above, and species abundance curves were used. The species abundance patterns can help as support to determine the status of ecosystems and these are usually described through abundance curves, where the species are arranged graphically, for its abundance (number of individuals present) from high to low. Depending on curve shape, one can determine if the ecosystem shows dominance of a particular species, or if the abundance is distributed evenly, i.e. species have similar number of individuals (Magurran, 1988; Verberk, 2011).
In this study, species abundance curve was fit to known mathematical models. Currently there are many models used to describe species diversity in a community, however, this paper only discusses three of the best known: Pareto model, Poison model from the lognormal series and Neutral model from Alonso and Mckane (Prado et al., 2015).
To select the best model the akaike information criterion (AIC) was used, according to which compares the selected models taking into account their fit and complexity; when models are compared using this method, the selection of the best model is based on the lower value in AIC. Moreover, the delta AIC criterion (dAIC), which, when is less than 2 indicate that compared models explain similarly trend data, i.e. there are no differences between each other, while values greater than 2 show a difference between these models. To determine the goodness of fit of the models the x2was used as recommended by Magurran (1988).
Comparison between plots. The nonparametric test Mann- Whitney-Wilcoxon (Zar, 2010) was used for statistical comparison between plots. Particularly compared necromass data (MLC, HO and HF) between plots and as data do not come from a normal distribution (KS- no significant) proceeded to perform the range sum test from Wilcoxon (nonparametric alternative for t test) for two independent samples.
As for the comparison of species between plots, density is used as parameter to compare statistically. The analysis was performed by comparing ratios with function "prop test" in R (Crawley, 2007).
Results and discussion
Necromass loads
For P1 a total of 36.6 Mg ha-1 of biomass, comprised by MLC 1 h (0.96 Mg ha-1), 10 h (6.81 Mg ha-1), 100 h (3.93 Mg ha-1), 1 000 F with 2.75 Mg ha-1 and 1 000 D with 1.33 Mg ha-1 further layers HO and HF with 8.52 and 12.25 Mg ha-1 respectively. P2 recorded a total of 49.6 Mg ha-1 of necromass. MLC 1 h recorded 0.74 Mg ha-1, 10 h (5.05 Mg ha-1), 100 h (46.54 Mg ha-1), 1 000 F (1.99 Mg ha-1), 1 000 D (3.39 Mg ha-1), HO (8.64 Mg ha-1) and HF with 23.26 Mg ha-1 (Figure 3). These MLC loads can be considered in an intermediate range compared with data reported in the study conducted by Xelhuantzi-Carmona et al. (2012), showing a maximum of 23 Mg ha-1 in undisturbed forest jungle. However, Morfin-Rios et al. (2007) reported close to 80 Mg ha-1 for montane forests.
For plots case only recorded statistically significant differences in the fermentation layer (p< 0.001). The comparison between other variables showed no such differences; however, this result supports the hypothesis that the higher superficial necromass load is in the stand that has no traces of fire (P2), because superficial fires help to reduce fuel loads (Agee, 1993; Rodriguez-Trejo, 1996; Jardel-Pelaez, 2010).
Species composition
Regarding species composition, overall 12 families, 18 genera and 20 species were recorded. The most represented family was Fabaceae with 5 genera and 6 species, followed by the Rosaceae with 2 genera and 2 species, Juglandaceae and Rutaceae recorded only one genus but with 2 species, other families had one genus and one species (Table 2).
Density and species abundance evaluation. The most abundant genus was Quercus with 2292 individuals in two hectares (Table 3 and 4); however, in plot 1 was where it recorded higher density and this difference was statistically significant (p< 0.001). Followed in density by Rhus virens with 2037 adding both plots, although it has most of its individuals in P2 (p< 0.001).
Table 3 Ecological importance values of species on plot 1 (P1).
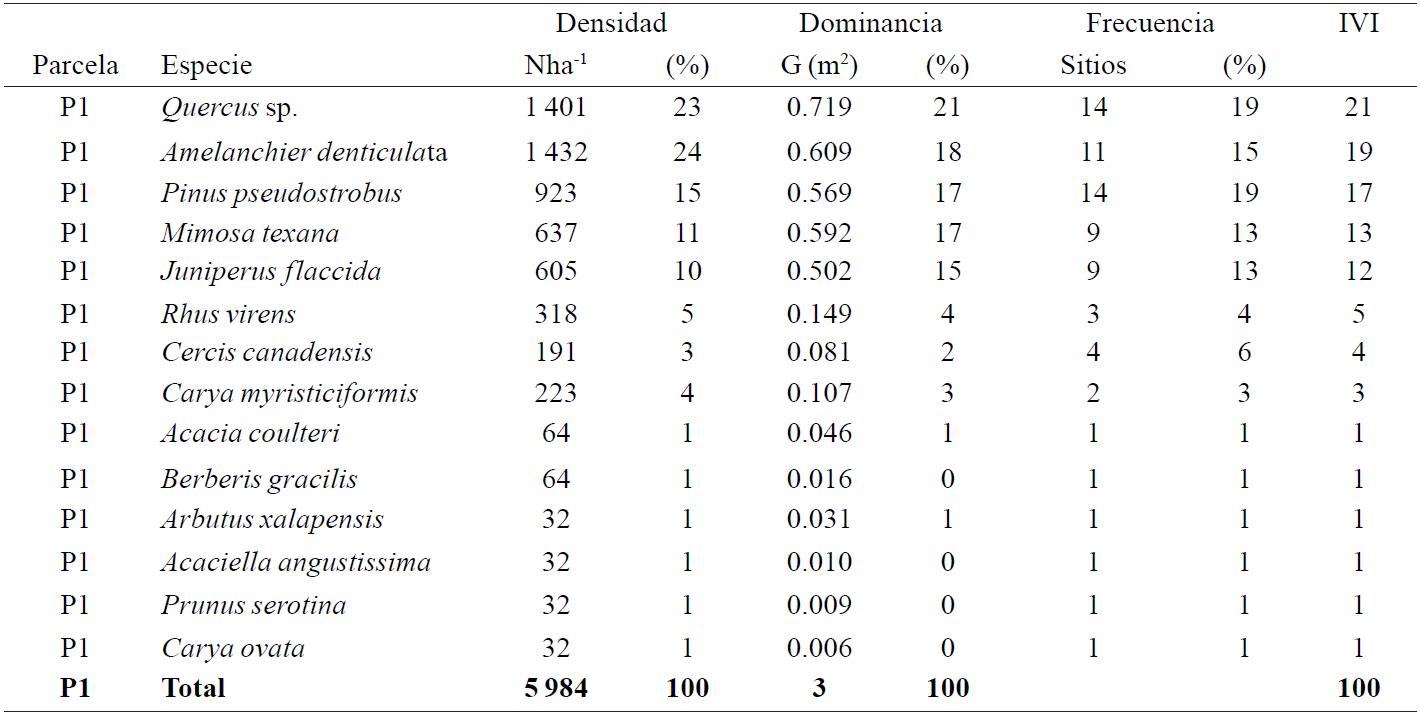
Donde: Nha-1= número de árboles por hectárea; G (m2)= área basal total en metros cuadrados por hectárea; IVI= índice de valores de importancia.
Table 4 Ecological importance values of species in plot 2 (P2).
Donde: Nha-1= número de árboles por hectárea; G (m2)= área basal total en metros cuadrados por hectárea; IVI= índice de valores de importancia.
Amelanchier denticulata is the third species in terms of number of individuals with 1623 and the plot with the highest values was P1 (p< 0.001). Noteworthy, that Pinus pseudostrobus, species with adaptations to fire and intolerant to shade (Rodríguez-Trejo and Fulé, 2003), showed statistically significant differences between plots (P1= 923, P2= 255, p< 0.001).
In addition, the species with fewer individuals were Acacia farnesiana, Acaciella angustissima, Amyris madrensis and Carya ovata with 32 individuals each in total (Tables 3 and 4).
Species abundance curves. Known models were fitted and for both plots and the best was the neutral model from Alonso and Mckane (Figure 4). For P1 the model that follows it, is Fisher (AIC= 96.41; dAIC= 0.52; x2 = 25.7; p< 0.05), and finally the Poison model (AIC= 100.58; dAIC= 4.67; x2= 61.7; p< 0.001). As for P2, a similar response had to model fit. After the neutral model, follows Fisher model (AIC= 103.2; dAIC= 0.41, x2= 9.19; p= 0.81) and Poison model (AIC= 104.5; dAIC= 1.74; x2= 8.64; p= 0.85).
In this analysis can be noted that both plots fit to neutral model; although the curves have similar distribution (Figure 4); that is, few species are the most abundant and regularly decreases as the number of species increases, it is important to consider that the most abundant species are different between plots (Tables 3 and 4).
Importance value index (IVI)
The most important species show a different behavior between plots, as seen in Tables 3 and 4. For plot 1, species with higher IVI values were Quercus sp., followed by Amelanchier denticulata and Pinus pseudostrobus, these three species represents 57% of total importance values. On the other hand, plot 2 has other species as the most important, Rhus virens, Quercus sp., Cercis canadensis and represents 58% of the importance values. A case worth mentioning is P. pseudostrobus, this species shows different importance values between P1 and P2, indicating a more active regeneration in the plot that has less necromass load (P1), on the other hand, species R. virens recorded high importance values in the plot with the highest necromass load (P2).
This could indicate that these species are directly related with frequency of fires. In the case of P. pseudostrobus could be said that they benefit from forest fires, and this also has to do with the fact that is a species intolerant to shade and with some features that make it resistant to forest fires (Rodríguez-Trejo and Fulé, 2003). On the contrary, R. virens may be assumed that is related with the absence of forest fires, since the absence of fire on prolonged periods allows the accumulation of surface necromass, specifically the fermentation layer. This is particularly important, since a modification to frequency of fires could lead to changes in species composition of understory and one of the factors that have been proven, affects the frequency of forest fires, is climate change, through the alteration of fire regime.
Himmelsbach et al., (2012) has worked in the area with the most important species to determine their tolerance to drought, the authors reported that P. pseudostrobus supports more short but high-intensity drought while other species, such as Quercus, support long low intensity drought. Which could have consequences on species composition in these ecosystems, as changes in drought regime, as demonstrated in the study by Yocom et al., (2010) could stress, specifically, plants making them more susceptible to natural disturbances such as forest fires.
Conclusions
Overall necromass surface necromass loads are shown in an intermediate range if compared with other studies; the plot with fire evidence had the lowest surface necromass load; P. pseudostrobus, intolerant to shade and adaptations to fire, has higher importance values in the plot with lower necromass load and Rhus virens is the most important species in the plot with the highest necromass load. Environmental changes associated with fire frequency and change in drought regime could influence the composition of species in the study area, which could affect the diversity of the area under study.
Also, it is recommended the implementation of a program of integrated fire management in which specifies the necessary actions to manage forest fuels, the above to decrease the risk of more extensive and severe fires.
Literatura citada
Agee, J. K. 1993. Fire ecology of pacific northwest forests. Island Press, Washington D.C. 490 p. [ Links ]
Brown, J. K. 1974. Handbook for inventorying downed woody material. Ogden, UT: U.S. 25 p. [ Links ]
Brown, J. K.; Oberheu, R. D. and Johnston, C. M. 1981. Handbook for inventorying surface fuels and biomass in the Interior West. 215 p. [ Links ]
Crawley, M. J. 2007. The R book. John Wiley & Sons Ltd, Imperial College London at Silwood Park, UK. 942 p. [ Links ]
DeBano, L. F.; Neary, D. G and Ffolliott, P. F. 1998. Fire effects on ecosystems. John Wiley & Sons. 356 p. [ Links ]
Dombois, D. M and Ellenberg, H. 1974. Aims and methods of vegetation ecology. John Wiley & Sons. 586 p. [ Links ]
Franklin, J. F.; Mitchell, R. J. and Palik, B. J. 2007. Natural disturbance and stand development principles for ecological forestry. Newtown Square, PA: U.S. 44 p. [ Links ]
Harmon, M. E. M.; Franklin, J. F. J.; Swanson, F. J.; Sollins, P.; Gregory, S. V.; Lattin, J. D.; Anderson, N. H.; Cline, S. P.; Aumen, N. G; Sedell, J. R.; Lienkaemper, G. W.; Cromack, K.; Cummins, K. W.; Cromack, Jr.; K. and Cummins, K. W. 1986. Ecology of coarse woody debris in temperate ecosystems. Adv. Ecol. Res. (15):133-302. [ Links ]
Himmelsbach, W.; Treviño-Garza E. J.; González-Rodríguez, H.; González-Tagle, M. A.; Meza, M. V.; Aguirre-Calderón, O. A.; Castillón, A. E. E. and Mitlöhner, R. 2012. Acclimatation of three co-occurring tree species to water stress and their role as site indicators in mixed pine-oak forests in the Sierra Madre Oriental, Mexico. Eur. J. For. Res. 131(2):355-367. [ Links ]
Jardel-Peláez, E. J. 2010. Planificación del manejo del fuego. Universidad de Guadalajara. 59 p. [ Links ]
Jardel-Peláez, E. J.; Alvarado-Celestino, E.; Morfín-Ríos, J. E.; Castillo- Navarro, F. y Flores-Garnica, J. G. 2009. Regímenes de fuego en ecosistemas forestales de México. In: Flores-Garnica, J. G. (Ed.). Impacto ambiental de incendios forestales. Mundi-Prensa, México, 73-100 pp. [ Links ]
Magurran, A. E. 1988. Ecological diversity and its measurement. Princeton University Press, New Jersey. 179 p. [ Links ]
Morfin-Ríos, J. E.; Alvarado-Celestino, E.; Jardel-Peláez, E. J.; Vihnanek, R. E.; Wright, D. K.; Michel-Fuentes, J. M.; Wright, C. S.; Ottmar, R. D.; Sandberg, D. G. y Nájera-Díaz, A. 2007. Fotoseries para la cuantificación de combustibles forestales de México: bosques montanos subtropicales de la Sierra Madre del Sur y bosques templados y matorral submontano del Norte de la Sierra Madre Oriental. Portland, OR: U.S. 93 p. [ Links ]
Morfin-Ríos, J. E.; Jardel-Peláez, E. J.; Alvarado-Celestino, E. y Michel-Fuentes, J. M. 2012. Caracterización y cuantificación de combustibles forestales. Comisión Nacional Forestal- Universidad de Guadalajara, Jalisco, México. 111 p. [ Links ]
Perera, A. H and Cui, W. 2010. Emulating natural disturbances as a forest management goal: Lessons from fire regime simulations. For. Ecol. Manage, managing landscapes at multiple scales for sustainability of ecosystem functions. (259):1328-1337. [ Links ]
Prado, P. I.; Miranda, M. D. and Chalom, A. 2015. sads: maximum likelihood models for species abundance distributions. An R package. 68 p. [ Links ]
Pyne, S. J.; Andrews, P. L and Laven, R. D. 1996. Introduction to Wildland Fire. 2th edition (Ed.). Wiley, New York. 808 p. [ Links ]
R Development Core Team 2011. R: a language and environment for statistical computing. R Found. Stat. Comput. R Foundation for Statistical Computing. doi:10.1007/978-3-540-74686-7. [ Links ]
Ravindranath, N. H. and Ostwald, M. 2008. Carbon inventory methods: handbook for greenhouse gas inventory, carbon mitigation and roundwood production projects. Springer Science & Business Media. 315 p. [ Links ]
Rodríguez-Trejo, D. A. 1996. Incendios forestales. Universidad Autónoma de Chapingo, Mundi-Prensa. 630 p. [ Links ]
Rodríguez-Trejo, D. A. 2008. Fire regimes, fire ecology, and fire management in Mexico. AMBIO A J. Hum. Environ. (37):548- 556. [ Links ]
Rodríguez-Trejo, D. A and Fulé, P. Z. 2003. Fire ecology of Mexican pines and a fire management proposal. Int. J. Wildl. Fire (12):23-37. [ Links ]
Rothermel, R. C. 1972. A mathematical model for predicting fire spread in wildland fuels. USDA For. Serv. Res. Pap. INT USA. 40 p. [ Links ]
RStudio. 2014. RStudio: integrated development environment for R. https://www.rstudio.com/. [ Links ]
Rubio-Camacho, E. A.; González-Tagle, M. A.; Alanís-Rodríguez, E.; Chávez-Durán, A. A y Aguirre-Calderón, O. A. 2015. Análisis de la estructura y distribuciones diamétricas en bosques templados bajo la perspectiva del régimen potencial de fuego. Ciencias Forestales y del Ambiente. (3):282-294. [ Links ]
Rubio-Camacho, E. A.; González-Tagle, M. A.; Jiménez-Pérez, J.; Alanís-Rodríguez, E. y Ávila-Flores, D. Y. 2014. Diversidad y distribución vertical de especies vegetales mediante el índice de Pretzsch. Cienc. UANL. 1-2(103):110. [ Links ]
TNC, 2004. El fuego, los ecosistemas y la gente. Una evaluación preliminar del fuego como un tema global de conservación. Iniciativa Global para el Manejo del Fuego. 9 p. [ Links ]
Van Wagner, C. E. 1968. The line intersect method in forest fuel sampling. For. Sci. (14):20-26. [ Links ]
Van Wagner, C. E. 1982. Practical aspects of the line intersect method. Chalk River, Ontario, Canada. 18 p. [ Links ]
Verberk, W. 2011. Explaining general patterns in species abundance and distributions. Nature, Nature Education Knowledge. 3(10):38. [ Links ]
Xelhuantzi-Carmona, J.; Flores-Garnica, J. G. y Chávez-Durán, Á. A. 2012. Análisis comparativo de cargas de combustibles en ecosistemas forestales afectados por incendios. Rev. Mex. Cien. For. 2 (3):37-52. [ Links ]
Yocom, L. L.; Fulé, P. Z.; Brown, P. M.; Cerano-Paredes, J.; Villanueva- Díaz, J.; Falk, D. A. and Cornejo- Oviedo, E. 2010. El Niño- southern oscillation effect on a fire regime in northeastern Mexico has changed over time. Ecology. (91):1660-1671. [ Links ]
Zar, J. H. 2010. Biostatistical analysis. 5th (ed.). Prentice Hall, New Jersey. 944 p. [ Links ]
Received: November 2015; Accepted: February 2016
 Este es un artículo publicado en acceso abierto bajo una licencia Creative Commons
