


Services on Demand
Journal
Article
 text in
  English (pdf)
 Article in xml format
 Article references
 Send this article by e-mail
Indicators
-
 Cited by SciELO
 -
 Access statistics
Related links
-
 Similars in
SciELO
Similars in
SciELO
Share

 Permalink
Revista mexicana de ciencias agrícolas
Print version ISSN 2007-0934
Rev. Mex. Cienc. Agríc vol.7 spe 13 Texcoco Jan./Feb. 2016
Articles
Impacts of climate change in potential distribution of Morus alba L. in Mexico
1 Centro Universitario de Ciencias Biológicas y Agropecuarias. Universidad de Guadalajara. Camino Ramón Padilla Sánchez No. 2100 Nextipac, Zapopan, Jalisco, México. C. P. 44600. (noeduranpuga@yahoo.com.mx; diegonz@cucba.udg.mx).
2 Unidad Académica de Agricultura. Universidad Autónoma de Nayarit. Carretera Tepic-Compostela, km 9. Xalisco, Nayarit, México. C. P. 63780. (joselenin28@hotmail.com; digapa1@hotmail.com; sergiotepic@hotmail.com).
3 Campo Experimental Centro-Altos de Jalisco-INIFAP. Carretera Libre Tepatitlán-Lagos de Moreno, km 8. Tepatitlán, Jalisco, México. C. P. 47600.
The aim of the study was to estimate the impact of climate change in potential distribution of Morus alba L. in Mexico. Distribution niches with Maximum Entropy (Maxent) for climatologies ~1950-2000 (reference climatology), 2041-2060 and 2061-2080, with two-way representative greenhouse gas concentrations (Rcp4.5 and RCP8.5) were modeled. 21 bioclimatic variables and two topographic variables were used; this information was obtained from the Global Climate Data portal World Clim and was managed with raster images and ascii 2.5 arcmin. The general circulation model (GCM) was considered: HadGEM2- ES. The results showed that environmental variables that contribute most to explain the geographical distribution of M. alba are the precipitation from the most humid month (September) and the average temperature of the coldest month (January). The logistics threshold from the 20th percentile assumes for reference climatology 80.8% of environmental fitness area of M. alba in the total area of Mexico. The prediction of climate change scenarios reports environmental retraction areas for three scenarios studied; giving a total of 80.66, 79.14 and 80.67 on scenario 2041-2060 rcp4.5 and rcp8.5 and scenario 2061-2080 rcp8.5 respectively; for scenario 2061-2080 rcp4.5 records an expansion to 82.28 in national area. Therefore climate change forecast a retraction on areas with environmental fitness of M. alba, for the period 2041-2060 and for the period 2061-2080 just with Rcp8.5.
Keywords: Morus alba; climate change; niche distribution; subtropical; tropical forage shrubs
El objetivo del estudio fue estimar el impacto del cambio climático en la distribución potencial de Morus alba L. en México. Se modelaron nichos de distribución con Máxima Entropía (Maxent), para las climatologías ~1950-2000 (climatología de referencia), 2041-2060 y 2061-2080, con dos vías representativas de concentraciones de gases efecto invernadero (Rcp4.5 y Rcp8.5), Se utilizaron 21 variables bioclimáticas y dos variables topográficas; esta información se obtuvo del portal de Global Climate Data de WorldClim y se manejó con imágenes raster y ascii a 2.5 minutos de arco. Se consideró el modelo de circulación general (MCG): HadGEM2-ES. Los resultados mostraron que las variables ambientales que más contribuyen a explicar la distribución geográfica de M. alba son la precipitación del mes más húmedo (septiembre) y la temperatura media del mes más frío (enero). El umbral logístico del percentil 20 conjetura para la climatología de referencia un 80.8% de área con aptitud ambiental de M. alba en la extensión total de México. La predicción de los escenarios de cambio climático reportan áreas de retracción ambiental para tres escenarios estudiados; dando un total de 80.66, 79.14 y 80.67 en los escenarios 2041-2060 rcp4.5 y rcp8.5 y escenario 2061-2080 rcp8.5 respectivamente; para el escenario 2061-2080 rcp4.5 se registra una expansión a 82.28 en la superficie nacional. Por lo anterior el cambio climático augura una retracción en las superficies con aptitud ambiental de M. alba, para el periodo 2041-2060 y para el periodo 2061-2080 solo con el Rcp8.5.
Palabras clave: Morus alba; arbustos forrajeros tropicales; cambio climático; nichos de distribución; subtropicales
Introduction
The world's climate is changing at an unprecedented rate and this phenomenon will continue in the coming decades (IPCC, 2013). There is abundant evidence that anthropogenic climate change is affecting the physiology, phenology and distribution of many species and it is expected in the near future that this phenomenon will intensify (Parmesan, 2006; Visser, 2008; Morueta-Holme et al., 2010). Climate change has led to radical biological changes of great magnitude (Fischlin et al., 2007); even, it is increasingly clear that climate change affects biodiversity and ecosystems (Sala et al., 2000) and can cause high rates of species extinction with narrow adaptation ranges or endemic species (Morueta-Holme et al., 2010). Moreover, climate change could cause the inclusion of potentially harmful invasive species to an ecosystem (Kirilenko et al., 2000).
It is anticipated that multiple components of climate change will affect all levels of biodiversity, from organisms to biotic areas (Parmesan, 2006); in the most basic levels, climate change can reduce the genetic diversity of populations due to directional selection, which could, in turn, affect the performance and resilience of ecosystems (Botkin et al., 2007; Lasco et al., 2008; Schneider et al., 2009), leading to modify the interactions network at community level (Bellard et al., 2012).
Given the high risk of extinction facing the species unable to adapt or spread at enough rates to perform a follow up the anthropogenic climate change, assisted migration has been suggested as a possible conservation strategy (Svenning et al., 2009). This would involve translocation of species to areas with current environmental fitness, but will probably continue to be adequate in the next 100 years or more; in the cases of low probability of other conservation strategies that are not sufficiently apt to ensure their survival (Hoegh-Guldberg et al., 2008).
The prediction of the response of biological biodiversity to climate change has become a very active field of scientific research (Beaumont et al., 2011; Dawson et al., 2011; McMahon et al., 2011); this response plays an important role in alerting scientists and decision makers on potential future risks, provides means to strengthen the attribution of changes in the ecosystem and helps to develop proactive strategies to reduce the impacts of climate change (Parmesan et al.,2011).
The genus Morus is distributed in temperate zones from almost all over the world as well as in tropical lands (Sánchez, 2002); its wide distribution makes possible this species to count with great capacity to adapt to very different climatic conditions (Milera, 2008). Morus alba is a species with high nutritional value to feed ruminants for its high protein levels (20-24%) and digestibility (75-85%), consequently it has a very broad taste acceptance by livestock (Milera, 2008; Jimenez, 2012).
Currently for proper planning of livestock development in the short, medium and long term in Mexico, it is necessary to estimate future climate scenarios, availability of genetic resources, and count with adequate information to apply mitigation measures in order to avoid or minimize the possible negative impacts of climate change. Therefore, the objective of this study was to estimate the impact of climate change for the periods 2041-2060 and 2061-2080, with two- way of greenhouse gases concentration in potential areas of distribution of Morus alba.
Materials and methods
Database
Data from 62 sampling sites were considered. The database was obtained from two sources: the National Forest and Soil Inventory (INFyS) from the National Forestry Commission (CONAFOR) and from the site: http://www.tropicos.org/.
Potential areas of distribution
The Maximum Entropy approach (Phillips et al., 2009) was used in this research, to model the ecological niche and predict the most likely geographic distribution of M. alba. The result of the model expresses the most suitable value for habitat potential in terms of environmental variables used. Maximum Entropy has been used widely to estimate potential distributions of plants and animals species with high accuracy (Sobek et al., 2012), and predict or infer species distribution based on the most significant environmental conditions, using only data of species presence (Moreno et al., 2011).
Environmental databases and geographical information system
Monthly, seasonal and annual precipitation, maximum temperature, minimum temperature, average temperature and thermal oscillation data from the periods 2041-2060, 2061- 2080 and ~1950-2000 (reference climatology) were used. These climate data was obtained from the Global Climate Data website WorldClim and processed by raster images and ascii, at a resolution of 2.5 arcmin. For 2041-2060 and 2061- 2080 climatologies the GCM was considered: HadGEM2-ES under two representative concentration pathways (RCPs) of greenhouse gases (GEI): rcp4.5 and rcp8.5. The GCM used, is part of climate modeling developed by the Coupled Model Intercomparison Project Phase 5 (CMIP5) (Walton et al., 2013). Altitude layer was obtained from the Environmental Information System (SIAN), from the National Institute of Agricultural Livestock and Forestry Research (Diaz et al., 2012).
From the basic climate variables mentioned a number of additional variables derived to perform the MaxEnt analysis of potential distribution niches for both reference climatology conditions and for 2041-2060 and 2061-2080 climatologies. The total number of variables used were: height above sea level (m), slope (%), annual maximum average temperature (°C), maximum temperature from May to October (°C), maximum temperature from November to April (°C) , maximum temperature from the warmest month (°C), mean annual temperature from the coldest month (°C), mean minimum annual temperature (°C), minimum temperatures from May to October (°C), minimum temperature from November toApril (°C), minimum temperature from the coldest month (°C), annual accumulated precipitation (mm), accumulated rainfall from May to October (mm), accumulated rainfall from November to April (mm), precipitation from the driest month (mm), precipitation from the wettest month (mm) annual thermal oscillation (°C), thermal oscillation from May to October (°C) and thermal oscillation from November to April (°C).
Using covers from the parameters and presence of species data, niche distribution for the climate scenarios were modeled, using 75% of presence records as training points and 25% as validation points. The AUC index (area under the curve) was used to assess the statistical model, as this index is one of the most used to measure the quality of the models (Moreno et al., 2011).
Areas with probability of environmental fitness
The prediction model for the distribution of M. alba was obtained with MaxEnt and examined with the IDRISI 17.0 (Eastman, 2012) system, a map with threshold values corresponding to 20th percentile was generated (Escalante et al., 2013). To calculate the potential distribution surface of the species, the areas occupied by water bodies and urban centers were not considered. These thematic layers were obtained through land use and vegetation maps (INEGI, 2009).
Ecological descriptors
The ecological descriptors for M. alba were determined based on the environmental derivatives intervals from site characterization for presence of species. This was made through IDRISI 17, raster images of each environmental variable and the geographic coordinates of each presence site.
Results and discussion
Distribution of niche models
Figure 1, shows the operational curve or ROC curve that represents the fitness of the sampling data; in this analysis, the obtained value was 0.955 for training points and 0.897 for validation points; indicating that the ability of the models to classify the presence of the species was successful (Parolo et al., 2008).

From this analysis it was determined that potential niche distribution model to describe the distribution of M. alba is high, as only two models environmental variables explained 87.6% of the spatial distribution of the species (Table 1). The variables that showed a higher level of contribution were precipitation from the wettest month (September) and mean temperature of the coldest month (January).
Table 1 Ecological descriptior from environmental variables that condition the geographical distribution of M. alba.
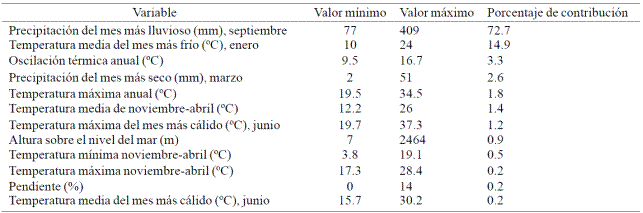
Figure 2 shows the current geographical potential distribution of M. alba. Their presence is located from the Yucatan Peninsula to the north of the country, except for a large area in Baja California and part of the northern region of Sonora, Chihuahua, Durango, Zacatecas and San Luis Potosi.

The highest presence of M. alba populations are concentrated in the southern and northeastern regions of Mexico; This presence is in line with the claim that M. alba grows in a variety of environments and latitudes. From tropical and subtropical regions which characterizes it by having a wide range of adaptation (Loya et al., 2014).
The ecological descriptors for M. alba and environmental variables that contribute to the construction of niche distribution can be observed in Table1. According to these results, precipitation of the wettest month (September) is the variable that most contributes (72.7%) in the potential distribution of the species in Mexico. The Morus alba descriptor for this variable points to a range of 77 to 409 mm of precipitation. These results are consistent with those reported by Loya et al. (2014), in the sense that this species grows well in a wide range of precipitation that can vary from 600 to 2 500 mm of annual precipitation.
The second ecological descriptor that most contributes is the average temperature of the coldest month with a range of 10 to 24 °C. M. alba also demonstrates a wide temperature range; it can be inferred that this species is able to explore and colonize thermally extreme environments.
The results regarding potential niches for M. alba for climate change scenarios are shown in Figure 3. The maps from this figure show the presence of environmental fitness areas and areas with increased and decreased surface for the species under study. In all future scenarios appear surface increases and decrease; showing the possible dynamics of suitable areas, depending on future climate changes.

Figure 3 Accessions and areas with environmental fitness of M. alba; under the general circulation model HadGEM2-ES with four scenarios of climate change a). 2041-2060 rcp 4.5; b). 2041-2060 rcp8.5; c). 2061- 2070 rcp4.5; and d). 2061-2080 rcp8.5.
The logistics threshold of the 20th percentile forecast for reference climatology an optimal area of 80.8% of the total land area. After averaging increase areas and retractions under climate change climatologies (Figure 4), it was established that areas with environmental fitness decreased to 80.66%, 79.14% and 80.67% of the total area of Mexico, in the scenarios 2041- 2060 rcp4.5, 2041-2060 rcp8.5 and 2061-2080 rcp8.5 respectively; and an increase to 82.28% for scenario 2061-2080 rcp4.5.

Figure 4 Percentage of areas with environmental fitness for M. alba in Mexico. Under climate scenarios, light-colored bars indicate currently fitness areas and in the future (stable), while the darker bars indicate new fitness areas in the future (expansion areas).
These results show that future climate changes apparently will be harmful for M. alba in the three climate change scenarios. Given that the most significant variables in niche distribution are precipitation from wettest month and mean temperature of the coldest month; it could be inferred that combinations of these parameters under climate change scenarios would be unfavorable to M. alba.
Hoffman and Sgro (2011) noted that some species show retraction and expansion in spatial distribution areas by effects of climate change, in function to their evolutionary adaptation. The expansion of fitness areas due to climate change has been reported for other species such as Leucospermum hypophyllo carpodendron subsp. Hpophyllo carpodendron (Pearson et al., 2006).
Most studies on the effects of climate change on the distribution of species report negative effects, i.e. retraction areas are larger than expansion areas (Sork et al., 2010). In the present study one scenario presented the contrary, that is, the expansion areas are greater than retraction areas.
As shown in Figure 3, these two types of areas have a geographic pattern; retraction areas are mainly concentrated in the north and center part of the country, while the expansion areas locate mainly in the peninsula of Baja California and part of northern Sonora and southern Chihuahua. This fact points to a region of the country, where future weather patterns will be different to current weather conditions, and therefore differ in the adaptation level of M. alba. This situation has already manifested for the region where the recorded retraction areas; there have been reports of crop patterns as result of regional climate changes (Ramirez et al., 2011; Santillán et al., 2011).
The maps in Figure 3 show that no population of M. alba is affected by the retraction of environmental fitness. However, in the event that some populations of M. alba were near retraction areas of fitness in the coming years, it would have to consider that these populations will have only two options for survival: a) migrate to more favorable environments; or b) adapt to new weather conditions (Morueta-Holme et al., 2010), which largely depends on the genetic diversity of the species (Mercer and Perales, 2010). For the present study, the environmental fitness will lose a little more area due to climate change, and this, apparently, could promote further loss of M. alba spreading to new areas. However, it is also important to consider the potential capabilities of this species to compete with other species in the ecosystem or invasive species which threaten the stability of the ecosystem (Mainka and Howard, 2010).
Moreover, it is important to note that the conservation of M. alba in the future will also depend on its ability to adapt to climate change (Alsos et al., 2009), which is a function of its ability to colonize new areas or, when necessary, of its ability to apply physiological changes to adapt to the new environment (Chown et al., 2010).
According to previous statements, forecast climate change for both periods will have a negative effect on environmental fitness of M. alba (Figure 4), which would allow in the future its possible contraction in territorial coverage. However, it is clear that these unfavorable environmental conditions that will be caused by future climate change, it will be favorable for other species, perhaps in the context of competition with M. alba. Under such scenario, the wide range of ecological descriptors of M. alba (Table 1) could be an advantageous characteristic, especially if the species is considered of broad genetic diversity of other parts of the world, which could increase the adaptation and colonization capacity of M. alba (Burke et al., 2009; Ruiz et al., 2013).
Even when the current and future climate scenarios seem to be unfavorable for M. alba, conservation measures could be taken to preserve current populations, in order to ensure their presence in their natural environment.
Conclusions
According to previous statements, projected climate change for both periods studied, will have a more negative than positive effect on environmental fitness of M. alba, allowing in the future its possible contraction in territorial cover. However, it is clear that these unfavorable environmental conditions will be caused by future climate change, it will also be favorable for other species, perhaps in the context of competing with M. alba. Under such a scenario, the wide range of ecological descriptors for M. alba, could be an advantageous feature.
Even when future climate scenarios seem unfavorable for environmental fitness of M. alba, conservation measures could be taken to preserve the current populations, in order to ensure their presence in their natural environment.
Literatura citada
Alsos, I. G.; Alm, T.; Normand, S. and Brochmann, C. 2009. Past and future range shifts and loss of diversity in dwarf willow (Salix herbacea L.) inferred from genetics, fossils and modelling. Global Ecol. Biogeogr. 18:223-239. [ Links ]
Beaumont, L. J.; Pitman, A.; Perkins, S.; Zimmermann, N. E.; Yoccoz , N. G. and Thuiller, W. 2011. Impacts of climate change on the world ́s most exceptional ecoregions. Proc. Natl Acad. Sci. 108:2306-2311. [ Links ]
Bellard, C.; Bertelsmeier, C.; Leadley, P.; Thuiller, W. and Courchamp, F. 2012. Impacts of climate change on the future of biodiversity. Ecology Letters. 15:365-377. [ Links ]
Botkin, D. B.; Saxe, H.; Araujo, M. B.; Betts, R.; Bradshaw, R. H. W.; Cedhagen, T.; Chesson, P.; Dawson, T. P.; Etterson, J. R.; Faith, D. P.; Ferrier, S.; Guisan, A.; Skjoldborg, H. A.; Hilbert, D. W.; Loehle, C.; Margules, C.; New, M.; Sobel, M. J. and Stockwell, D. R. B. 2007. Forecasting the effects of global warming on biodiversity. Bioscience. 57:227-236. [ Links ]
Burke, M. B.; Lobell, D. B. and Guarino, L. 2009. Shifts in African crop climates by 2050, and the implications for crop improvement and genetic resources conservation. Global Environmental Change. 19(3):317-325. [ Links ]
Chown, S. L.; Hoffman, A. A.; Kristensen, T. N.; Angilletta Jr. M. J.; Stenseth, N. Ch. and Pertoldi, C. 2010. Adapting to climate change: a perspective from evolutionary physiology. Clim. Res. 4:3-15. [ Links ]
Dawson, T. P.; Jackson, S. T.; House, J. I.; Prentice, I. C. and Mace, G. M. 2011. Beyond predictions: biodiversity conservation in a changing climate. Science. 332:53-58. [ Links ]
Díaz, P. G.; Guajardo, P. R. A.; Medina, G. G.; Sánchez, C. I.; Soria, R. J.; Vázquez, A. M. P.; Quijano, C. J. A.; Legorreta, P. F. y Ariel, R. C. J. 2012. Potencial productivo de especies agrícolas de importancia socioeconómica en México. 1a. Ed. INIFAP. Xalapa, Ver., México. 140 p. [ Links ]
Eastman, J. R. 2012. Idrisi selva manual. Version 17. Clark Labs, Clark University. Worcester, Mass., USA. 322 p. [ Links ]
Escalante, T.; Rodríguez, T. G.; Linaje M.; Illoldi, R. P. and González, L. R. 2013. Identification of areas of endemism from species distribution models: threshold selection and nearctic mammals. Revista Especializada en Ciencias Químico-Biológicas. 16(1):5-17. [ Links ]
Fischlin, A.; Midgley, G. F.; Price, J. T.; Leemans, R.; Gopal, B. et al. 2007. Ecosystems, their properties, goods, and services. In: Parry, M. L.; Canziani, O. F.; Palutikof, J. P. van der Linden, P. J.; Hanson, C. E. (Eds.). Climate change 2007: impacts, adaptation and vulnerability. Contribution of working group II to the fourth assessment report of the Intergovernmental Panel on Climate Change. Cambridge: Cambridge University Press. 211-272 pp. [ Links ]
Hoegh-Guldberg, O.; Hughes, L.; McIntyre, S.; Lindendmayer, D. B. and Parmesan, C. 2008. Assisted colonization and rapid climate change. Science. 321:345-346. [ Links ]
Hoffman, A. A. and Sgró, C. M. 2011. Climate change and evolutionary adaptation. Nature. 470:479-485. [ Links ]
IPCC (Intergovernmental Panel on Climate Change), 2013. The physical science basis. Working group I contribution to the fifth assessment report of the intergovernmental panel on climate change. Summary for policymakers. In: Stocker, T. F.; Qin, D.; Plattner, G.K.; Tignor, M.B.;Allen, S.K.; Boschung, J.;Nauels, A.; Xia, Y.; Bex, V. and Midgley, P. M. (Eds.). Switzerland. 27 p. [ Links ]
INEGI (Instituto Nacional de Estadística Geografía e Informática). 2009. Guía para interpretación cartográfica: Uso de suelo-vegetación Serie III. D. F., México. 71 p. [ Links ]
Jiménez, G. R. 2012. Capacidad productiva de praderas mono-específica, asociada y silvopastoril en un ambiente tropical seco. Tesis Doctoral. Colegio de Postgraduados. Montecillo, Texcoco, Estado de México, México. 151 p. [ Links ]
Kirilenko, A. P.; Belotelov, N. V. and Bogatyrev, B. G. 2000. Global model of vegetation migration: incorporation of climatic variability. Ecological Modelling 132:125-133. [ Links ]
Lasco, R. D.; Pulhin, F. B.; Sánchez, P. A. J.; Villamor, G. B. and Villegas, K. A. L. 2008. Climate change and forest ecosystems in Philippines: Vulnerability, adaptability and mitigation. J. Environ. Sci. Management. 11(1):1-14. [ Links ]
Loya, O. J. L.; Martínez, G. S.; Prado, R. O. F.; Valdés, G. Y. S.; Gómez, D. A. A.; Escalera, V. F.; Macedo, B. R. and Durán, P. N. 2014. El sistema silvopastoril. Sistema Superior Editorial. Nayarit, México. 102 p. [ Links ]
Mainka, S. A.; Howard, G. W. 2010. Climate change and invasive species: double jeopardy. Integrative Zoology. 5:102-111. [ Links ]
McMahon, S. M.; Harrison, S. P.; Armbruster, W. S.; Bartlein, P. J.; Beale, C. M.; Edwards, M. E.; Kattge, J.; Midgley, G.; Morin, X. and Prentice, I. C. 2011. Improving assessment and modelling of climate change impacts on global terrestrial biodiversity. Trends Ecol Evol 26:249-259. [ Links ]
Mercer, K. L. and Perales, H. R. 2010. Evolutionary response of landraces to climate change in centers of crop diversity. Evolutionary applications. doi:10.1111/j.1752-4571.2010.00137.x. [ Links ]
Milera, R. M. de la C. 2008. Morera un nuevo forraje para la alimentación del Ganado. Ciudad de la Habana. Editorial Universitaria. 382 p. [ Links ]
Moreno, R.; Zamora, R.; Molina, J. R.; Vásquez, A. and Herrera, M. 2011. Predictive modeling of microhabitats for endemic birds in South Chilean temperate forest using Maximum entropy (Maxent). Ecol. Informat. 6:364-370. [ Links ]
Morueta-Holme, N.; Fløjgaard C. and Svenning, J. C. 2010. Climate change risks and conservation implications for a threatened small-range mammal Species. PLoS one. 5(4):1-12. [ Links ]
Parmesan, C. 2006. Ecological and evolutionary responses to recent climate change. Ecol Evol. 37:637-669. [ Links ]
Parmesan, C.; Duarte, C. M.; Poloczanska, E.; Richardson, A. J. and Singer, M. C. 2011. Overstretching attribution. Nat. Clim. Change. 1:2-4. [ Links ]
Parolo, G.; Rossi, G. and Ferrarini, A. 2008. Toward improved species niche modelling: arnica montana in the Alps as a case study. J. Appl. Ecol. 45(5):1410-1418. [ Links ]
Pearson, R. G.; Thuiller, W.; Araújo, M. B.; Martínez-Meyer, E.; Brotons, Ll.; McClean, C.; Miles, L.; Segurado, P.; Dawson, T. P.; Lees, D. C. 2006. J. Biog. 33:1704-1711. [ Links ]
Phillips, S. J.; Dudík, M.; Elith, J.; Graham, C. H.; Lehmann, A.; Leathwick, J and Ferrier, S. 2009. Sample selection bias and presence-only distribution models: implications for background and pseudo-absence data. Ecol. Appl. 19:181-197. [ Links ]
Ramírez, L. M. R.; Ruiz, C. J. A.; Medina, G. G.; Jacobo, C. J. L.; Parra, Q. R. A.; Ávila, M. M. R. y Jesús, P. A. J. 2011. Perspectivas del sistema de producción de manzano en Chihuahua, ante el cambio climático. Rev. Mex. Cienc. Agríc. Pub. Esp. 2:265-279. [ Links ]
Ruiz, C. J. A.; Hernández, C. J. M.; Sánchez, G. J. J.; Ortega, C. A.; Ramírez, O. G.; Guerreo, H. M. J.; Aragón, C. F.; Vidal, M. V. A. y De la Cruz L. L. 2013. Ecología, adaptación y distribución actual y potencial de las razas mexicanas de maíz. INIFAP- CIRPAC-Campo Experimental Centro Altos de Jalisco. Tepatitlán de Morelos, Jalisco, México. Libro técnico Núm. 5. 159 p. [ Links ]
Sala, O. E.; Stuart, C. F. III; Armesto, J. J.; Berlow, E. and Bloomfield J. 2000. Global biodiversity scenarios for the year 2100. Science. 287:1770-1774. [ Links ]
Sánchez, M. D. 2002. World distribution and utilization of mulberry and its potential for animal feeding. In: mulberry for animal production. FAO animal production and health paper. FAO, Rome. 1 p. [ Links ]
Santillán, E. L. E.; Blanco, M. F.; Magallanes, Q. R.; García, H. J. L.; Cerano, P. J.; Delgadillo, R. O. and Valdez, C. R. D. 2011. Tendencias de temperatura extremas en Zacatecas, México. Rev. Mex. Cienc. Agríc. Pub. Esp. 207-219. [ Links ]
Schneider, R. R.; Hamann, A.; Farr, D.; Wang, X. and Boutin, S. 2009. Potential effects of climate change on ecosystem distribution in Alberta. Can. J. For. Res. 39:1001-1010. [ Links ]
Sork, V.; Davis, F.; Westfall, R.; Flints, A.; Ikegami, M.; Wang, H. and Grivet, D. D. 2010. Gene movements and genetic association with regional gradients in California valley oak (Quercus lobata Née) in the face of climate change. Mol. Ecol. 19:3806- 3823. [ Links ]
Svenning, J. C.; Fløjgaard, C.; Morueta-Holme, N.; Lenoir, J. and Normand, S. 2009. Big moving day for biodiversity? A macroecological assessment of the scope for assisted colonization as a conservation strategy under global warming. IOP Conf Ser: Earth Environ Sci 8:01-12. [ Links ]
Sobek, S. S.; Kluza, D.A.; Cuddington, K. and Lyons, D. B. 2012. Potential distribution of emerald ash borer: What can we learns from ecological niche models using Maxent and GARP? Forest Ecol. Manag. 281(1):23-31. [ Links ]
Visser, M. E. 2008. Keeping up with a warming world; assessing the rate of adaptation to climate change. Proc. R. Soc. B. 275:649-659. [ Links ]
Walton, D.; Meyerson, J.; Neelin, J. D. 2013. Accessing, downloading, and viewing CMIP5 data. Earth system grid federation. 25 p. [ Links ]
Received: November 2015; Accepted: February 2016
 Este es un artículo publicado en acceso abierto bajo una licencia Creative Commons
