


Services on Demand
Journal
Article
 text in
  English (pdf)
 Article in xml format
 Article references
 Send this article by e-mail
Indicators
-
 Cited by SciELO
 -
 Access statistics
Related links
-
 Similars in
SciELO
Similars in
SciELO
Share

 Permalink
Revista mexicana de ciencias agrícolas
Print version ISSN 2007-0934
Rev. Mex. Cienc. Agríc vol.7 spe 13 Texcoco Jan./Feb. 2016
Articles
Regionalization of climate change in Mexico
1 Campo Experimental Centro-Altos de Jalisco-INIFAP. Carretera libre Tepatitlán-Lagos de Moreno, km 8, Tepatitlán, Jalisco, México.
2 Campo Experimental Zacatecas- INIFAP. Carretera Zacatecas-Fresnillo, km 24.5, Calera, Zacatecas, México.
3 Campo Experimental Pabellón- INIFAP. Carretera Aguascalientes-Zacatecas, km 32.5, Pabellón de Arteaga, Aguascalientes, México.
4 Centro Universitario de Ciencias Biológicas y Agropecuarias-Universidad de Guadalajara. Carretera Guadalajara-Nogales, km 15.5, Jalisco, México.
5 Campo Experimental Costa de Hermosillo- INIFAP. Blvd. del Bosque No. 7 Esq. Paseo de la Pradera, Col. Valle Verde, Hermosillo, Sonora.
The objective of this research was to regionalize climate change patterns for Mexico based on values of thermal and precipitations change from 708 cells of 0.5 x 0.5° arc. The values of thermal and precipitation changes were settled by subtracting the climatology 2050 Rcp4.5 from climatology reference 1961 to 2010, considering the variables mean maximum temperature (Tx), mean minimum temperature (Ti), mean temperature (Tm), thermal oscillation (OT) and precipitation (P) of the spring-summer period (PV, from May to October), autumn-winter (OI, from November to April) and annual. The climatology 2050 Rcp4.5 was derived from an assembly model from the median value of 11 general circulation models (MCG) reduced in scale, calibrated and belonging to the coupled model inter-comparison project phase 5 (CMIP5), reported in the 5th delivery from IPCC: BCC-CSM1-1, CCSM4, GISS-E2-R, HadGEM2-AO, HadGEM2-ES, IPSL-CM5A-LR, MIROC-ESM-CHEM, MIROC-ESM, MIROC5, MRI-CGCM3, NorESM1-M. The values of thermal and precipitation change from the 708 cells were subjected to a multivariate analysis including a cluster analysis (Ward method) and principal components (ACP). To estimate the optimal number of groups, contained validation was used in the Clustan Graphics V8 program, using 200 replications. Subsequently it conducted a discriminant analysis to minimize misclassifications in clusters from 708 cells. This analysis was conducted based on the statistical analysis system (SAS). The results showed that the variation in the values of climate change in Mexico for 2050 can be explained by two main components, which together account for just over 84% of the variation. CP1 was composed by variables related to thermal change values and CP2 by variables related to precipitation change values. In the cluster analysis the formation of 11 groups of cells with different statistical characteristics of climate change were reported, ranging from superficial cooling levels (-1 to 0 °C) to severe warming levels (> 3 °C); superficial humidification levels (0 to +10 mm seasonal precipitation) to severe drying levels (-300 to -150 mm seasonal precipitation); and, very superficial levels of tropicalization (-0.5 0 °C) to moderate levels of continentalization (1 to 1.5 °C). However, the results represent a first approach in this topic; have a strong statistical support that allows using the clustering obtained for agricultural planning purposes.
Keywords: global warming; regional climate change; numerical taxonomy
El objetivo de la presente investigación fue regionalizar patrones de cambio climático para la República Mexicana con base en valores de cambio térmico y pluvial de 708 celdas de tamaño 0.5 x 0.5° de arco. Los valores de cambio térmico y pluvial se establecieron al restar la climatología año 2050 Rcp4.5 de la climatología de referencia 1961-2010, considerando las variables temperatura máxima media (Tx) temperatura mínima media (Ti), temperatura media (Tm), oscilación térmica (OT) y precipitación (P) de los períodos primavera-verano (PV, que abarcó de mayo a octubre), otoño-invierno (OI, que abarcó de noviembre a abril) y anual. La climatología año 2050 Rcp4.5 se derivó de un modelo ensamble a partir del valor de la mediana de 11 modelos de circulación general (MCG) reducidos en escala, calibrados y pertenecientes al inter-comparación de modelos acoplados fase 5 (CMIP5), reportados en la 5a entrega del IPCC: BCC- CSM1-1, CCSM4, GISS-E2-R, HadGEM2-AO, HadGEM2- ES, IPSL-CM5A-LR, MIROC-ESM-CHEM, MIROC-ESM, MIROC5,MRI-CGCM3,NorESM1-M. Los valores de cambio térmico y pluvial de las 708 celdas se sometieron a un análisis multivariado que incluyó un análisis de agrupamiento (Método de Ward) y de componentes principales (ACP). Para estimar el número óptimo de grupos se usó la validación contenida en el programa Clustan Graphics V8, utilizando 200 repeticiones.
Posteriormente, se llevó a cabo un análisis discriminante para minimizar clasificaciones erróneas en los agrupamientos de las 708 celdas. Este análisis se llevó a cabo con base en el sistema de análisis estadístico (SAS). Los resultados mostraron que la variación en los valores de cambio climático de la República Mexicana para el año 2050 puede ser explicada por dos componentes principales, los cuales en conjunto explican un poco más de 84% de la variación. El CP1 estuvo integrado por variables referidas a valores de cambio térmico y el CP2 por variables relacionadas con valores de cambio pluvial. En el análisis de agrupamiento se reportó la formación de 11 grupos de celdas con características de cambio climático estadísticamente distintas, las cuales incluyen desde niveles de enfriamiento somero (-1 a 0 °C) a niveles de calentamiento severo (>3 °C); niveles de humidificación muy somera (0 a +10 mm de precipitación estacional) a niveles de desecación severa (-300 a -150 mm de precipitación estacional); y, niveles de tropicalización muy somera (-0.5 a 0 °C) a niveles de continentalización moderada (1 a 1.5 °C). No obstante, que los resultados obtenidos representan una primera aproximación en esta temática, poseen un sustento estadístico robusto que permite utilizar el agrupamiento obtenido para fines de planeación agrícola.
Palabras clave: calentamiento global; carácter regional del cambio climático; taxonomía numérica
Introduction
Climate change has a regional character, which causes that the effects of this phenomenon on agricultural production systems are differentiated. The increase of temperature and precipitation cause various combinations resulting on particular or different climatic conditions, which alter the agro-climate in different ways for crops.
Despite the inherent uncertainty of climate change scenarios, as result of the application of global circulation models (IPCC, 2013), these can be used to characterize climate and agro- climatic conditions that climate change brings (Trnka et al., 2011; Tian et al., 2014), which is a first step to know greater detail of the possible effects of this phenomenon in soil-plant system. However, the generation of adaptation and mitigation measures requires more precise information regarding the location of types of climate change that operate or will operate in different agro-ecological regions. That is, it requires a classification system of climate change which will facilitate and expedite the generation process and technology transfer. In this sense, numerical taxonomy can provide a good choice for discriminating areas that are statistically different from each other when considering change values in climatic variables.
To perform this type of analysis, it is necessary to have a data matrix of climate change, which can be generated from a climate change information system on environment Geographic Information Systems (GIS).
There are several sources of information regarding climate change scenarios expected for the XXI century in Mexico. Magaña and Caetano (2007) proposed scenarios of average temperature and year per year precipitation for the period 2000-2099 based on an assembly of 10 global circulation models (MCG). Cavazos et al. (2013) also assembled 15 MCG worked by the Intergovernmental Panel on Climate Change (IPCC) and derived for Mexico the monthly temperature and precipitation images for the period 2015-2039 (near future) and 2075-2099 (far future).
It is accepted that modeling climate change and the predicted values of temperature and rainfall change for future climatology, still possess an unspecified degree of uncertainty, so however it has been made continuous improvements to the methods and simulation models of climate change, the warming levels and changes in precipitation should be taken with reservation. However, within this context, the usefulness of future climate simulations lies in identifying trends that regulate criteria about what lies ahead in climate for agriculture and other areas of interest. In this sense, the use of consensus models or assembly models is an effective strategy to minimize the risk of error in the demarcation of trends in temperature and rainfall patterns in various regions of the world.
In this research it was worked with an assembly of 11 MCG taking as climatology reference the period 1961-2010. From here the objective of this particular study was to discriminate areas with statistically different climate change patterns based on temperature and rainfall change values for climatology 2050 and representative concentration pathway of greenhouse gases (Rcp) 4.5. To achieve this objective a multivariate analysis techniques were implemented to provide a statistical support to the results and thereby promote the reliability of a possible stratification scheme of climate change. The statistical approaches gradually gain prominence in the assessment of the impacts of climate change on agricultural production due to their ability to evaluate large and diverse groups of data quickly (Rosenzweig et al., 2013).
Materials and methods
Information System of climate change
An assembly model was integrated from the median value of 11 general circulation models (MCG) reduced scale and calibrated (Walton et al., 2013) and belonging to CMIP5 (Coupled Model Intercomparison Phase 5) reported on the 5th IPCC delivery: BCC-CSM1-1, CCSM4, GISS- E2-R, HadGEM2-AO, HadGEM2-ES, IPSL-CM5A-LR, MIROC-ESM-CHEM, MIROC-ESM, MIROC5, MRI- CGCM3, NorESM1- M. The assembly was generated under the four representative concentration pathways of greenhouse gases (Rcp), this are Rcp2.6, Rcp4.5, Rcp6.0 and Rcp8.5, and considering two climatologies: 2041- 2060 and 2061-2080. In total eight information systems on climate change for Mexico were integrated, taking as base the climatology reference 1961-2010. Information systems of climate change are composed of thematic raster images with a resolution of 30" arc, corresponding to monthly values of maximum temperature (Tx), minimum temperature (Ti) and precipitation (P).
Since it originally projected maximum temperature, minimum temperature and precipitation of the 11 MCG (with which was developed the assemble) are referred to the climatology 1950-2000 (Hijmans et al., 2005) proceeding to obtain the values of temperature change and precipitation change for 2041-2060 and 2061-2080, regarding to reference climatology; this by subtracting monthly raster images (2041-2060) - (1950-2000) and (2061-2080) - (1950-2000), which was made in Idrisi selva system. The resulting images were subjected to values extraction for a mesh formed by nodes at 30" arc. This procedure is performed using the ArcGIS system. The results of this operation were vectors of monthly values of temperature and rainfall change.
Such vectors are transformed into Excel files to calculate the median of 11 models corresponding to the value of monthly change in minimum temperature, maximum temperature and precipitation for the periods 2041-2060 and 2061- 2080. The Excel matrices thus obtained of temperature and precipitation change were added algebraically to the monthly raster images of maximum temperature, minimum temperature and precipitation of the environmental information system from INIFAP corresponding to the climatology 1961-2010. The justification to use as reference climatology 1961-2010 instead of 1950-2000, lies on a more accurate representation of the temperature and precipitation conditions of the country by weather interpolations made in the environmental information system from INIFAP. This fact, though does not count with documented evidence, has been shown by expert researchers from the Agro-meteorology and Modeling Network from INIFAP in different regions of the country.
Identification of regional climate change
From the basic variables of the information system of climate change 2041-2060 Rcp4.5, seasonal images for spring-summer period (PV) and autumn-winter period (OI) and annual maximum temperature, minimum temperature, average temperature (Tm), thermal oscillation (OT) (maximum temperature - minimum temperature) and precipitation were obtained. These seasonal and annual images were also calculated for the period 1961-2010 and converted to a resolution of 0.5° x 0.5°. With Idrisi Selva subtracted the images 2041- 2060 Rcp4.5 from the reference images 1961 to 2010; the resulting images were considered images of climate change values; through ArcGIS the changing values of Tx, Ti, Tm, OT and P were extracted for each of the cells that make up the Mexican territory. In total an array of 708 points were extracted with 15 variables of climate change (Table 1).
Table 1 Variables involved in the multivariate analysis to identify regions with different patterns of climate change.
With the array of 708 points and 15 variables of climate change, were conducted cluster and principal component analysis (ACP) for weather variables described in Table 1. Standardization to zero mean and variance 1 was conducted, calculating Squared Euclidean distance and cluster analysis using the method of increase in the sum of squares (Ward) was performed.
To estimate the optimal number of groups, the validation proposed by Wishart (2006) contained in Clustan V8 Graphics program, using 200 replications was used. In order to validate the classification is to find a structure in data and look for those partitions that express the maximum deviation from randomness. The method compares the clusters obtained from the original information with that generated from random permutation of data. Based on the biggest differences between the random clusters and real clusters it is carried out a t test and determines the optimal number of clusters.
Subsequently conducted a discriminant analysis, this analysis assigns different points to one or more groups based on temperature and precipitation change data. This method creates linear discriminant functions that minimize the probability of misclassification; discriminant function depends on the mean vectors, matrices of variances and portions of samples belonging to the clusters. This analysis was conducted based on the Statistical Analysis System (SAS Institute Inc., 2014).
Similarly, the principal component analysis was performed with the information described above using the Statistical Analysis System (SAS Institute Inc., 2014). The results are presented in a graph that displays the relationships between the 708 points in which climate change was evaluated.
Results and discussion
Statistical analysis
The results from cluster analysis for climate change data identified11 groups based on the validation method of Clustan Graphics V8; due to a large number of points, it is not possible to present the results graphically as dendrogram. Based on clustering, it was conducted a discriminant analysis, which determined the variance-covariance matrices of the clusters that are not homogeneous, therefore the variance-covariance matrices from each group were used to derive the discriminant function. The aposteriori probability indicated that group 1 had the highest percentage of misclassified points with 28% and groups 5 and 6 with about 16% each. Based on the allocation of the discriminant analysis it was carried the ACP and the results were plotted in two dimensions (Figure 1).
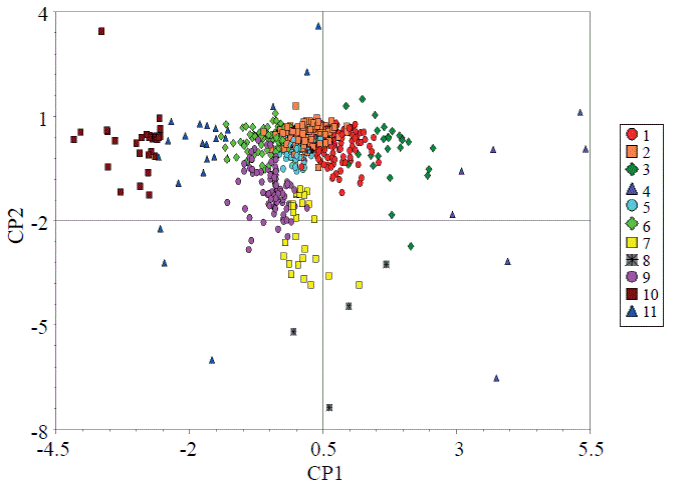
Figure 1 Graph of the first two axes of the principal components analysis. The symbols represent the clusters described in Table 4.
Table 4 Groups or regions of climate change in Mexico based on change values of temperature, precipitation and thermal oscillation over two periods of the year.

The relations between the 708 points are summarized based on principal component analysis. The first dimension helps to explain 71.28%, the second 12.94% and the third 7.81% of the total variation, respectively (Table 2).
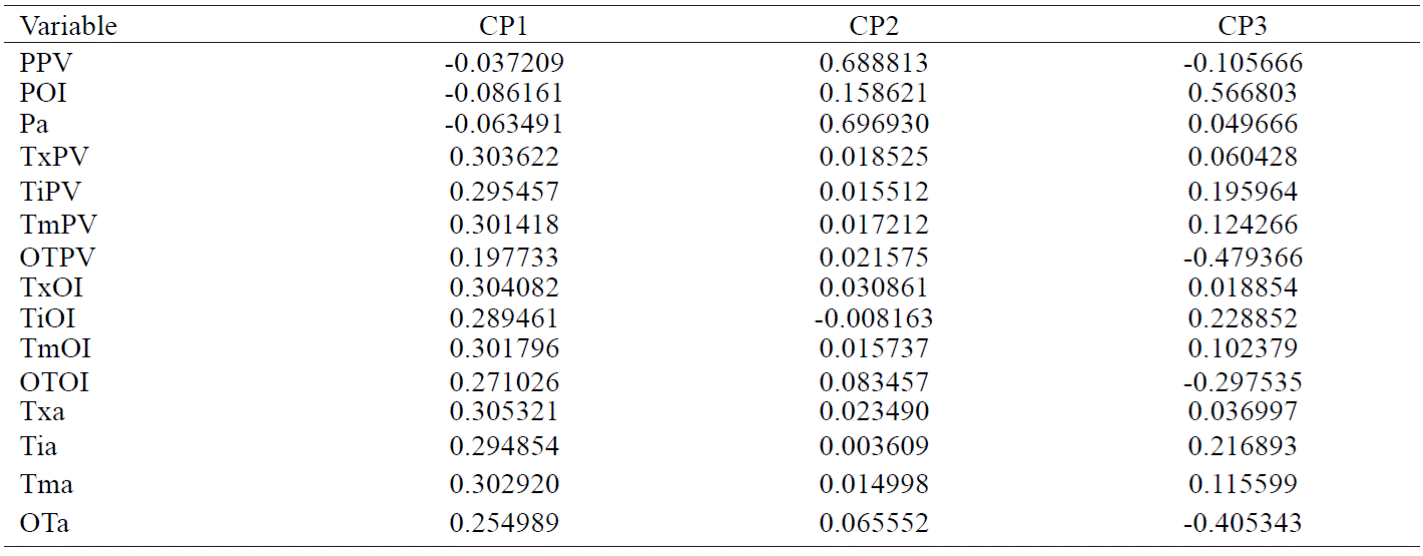
Component 1 (CP1) involves a greater degree of temperature variables, this is TxPV, TiPV, TmPV, TxOI, TiOI, TmOI, Txa, Tia, Tma, OTOI, OTa and OTPV, although the last variable appears to be better represented outside of the first two principal components. Component 2 (CP2) is explained mainly by the precipitation variables Pa, PPV and POI; however, the last variable has more weight in component 3 (CP3). Dimension 1 allows differentiating Clusters 1, 3, 4, 6, 9, 10 and 11, while dimension 2 separates Clusters 7 and 8. It is important to note that the principal component analysis found clusters of highly correlated variables; this is within temperature variables, both maximum and average temperatures of the PV period and the OI period highly correlate with maximum, minimum, and annual average temperature. Similarly, the maximum temperature recorded a high correlation with average temperature, and the same happened between minimum temperature and average temperature of all periods of analysis and between annual precipitation and PV precipitation. Hence it was decided to make the description of the resulting clusters from clustering analysis based solely on variables TmPV, TmOI, OTPV and Otoi from CP1 and, PPV and POI from CP2. Seasonal variables (spring-summer, autumn-winter) were selected instead of annual variables to better detail the differences between the clusters.

Clusters or regions from climate change
Table 4 shows the 11 groups resulting with own characteristics of climate change, while Figure 2, shows the spatial distribution of these groups.
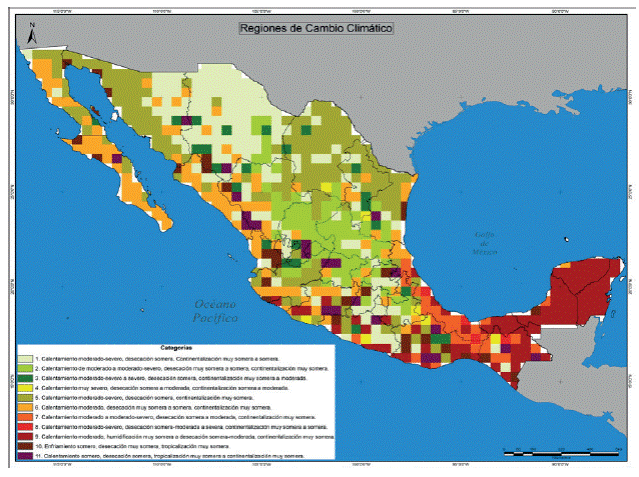
Group 1: moderate to severe warming, superficial drying, very superficial to superficial continentalization.
According to the cells that make up the group or region 1, the characteristics that make up climate change for year 2050 are: an increase in average temperature PV and OI of 2 to 3 °C; an increase of thermal oscillation (OT) PV of 0 to 0.5 °C and OI of 0.5 to 1 °C; a loss of 10 to 50 mm of rain both in the PV and OI period. Its distribution in Mexico is located mainly in the northwest, in the states of Chihuahua and Sonora, although its presence is also seen in a more fragmented way in other regions such as Baja California, Coahuila, Durango, Sinaloa, Nayarit, San Luis Potosi, Tamaulipas, Nuevo Leon, Jalisco, Michoacan, Guerrero, State of Mexico, Morelos, Distrito Federal, Hidalgo, Queretaro, Puebla, Oaxaca and Chiapas (Figure 2).
Group 2: moderate warming to moderate-severe, very superficial to superficial drying, very superficial continentalization.
The cells of this group are characterized by an increased average temperature PV of 2 to 3 °C, while in OI the increase is 1 to 2 °C. The increase in OT both PV and OI goes from 0 to 0.5 °C and it includes a decrease of 10 to 50 mm for precipitation PV, and 0 to 10 mm for precipitation OI. The cells belonging to this group are distributed mainly in the north-central part of the country, plus smaller areas of the states of Puebla, Hidalgo and Jalisco (Figure 2).
Group 3: moderate-severe to severe warming, superficial drought, very superficial to moderate continentalization.
This group is characterized by a temperature increase in PV(3 to 4°C) and a greater increase in OTOI(1to1.5 °C). The rest of the characteristics are similar to those from other groups, that is, an increase of 2 to 3 °C in OI, an increase in OTPV from 0 to 0.5°C and a loss of precipitation of 10 to 50 mm both in PV and OI. The presence of this cluster is minority and it is distributed in small areas of Sonora, Chihuahua, Durango, Coahuila, Nuevo Leon, Tamaulipas, Nayarit, Jalisco, Puebla and Oaxaca (Figure 2).
Group 4: very severe warming, superficial to moderate drying, superficial to moderate continentalization
The most distinctive characteristic of this cluster is a high warming rate both PV (5 to 5.5 °C) and OI (4 to 5 °C), thus a decrease of precipitation above 100 mm in PV (- 150 to -100 mm). Precipitation loss in OI is 10 to 50 mm, while OT will increase from 0.5 to 1 °C in PV and from 1 to 1.5 °C in OI. This region has little territorial representation; it is present only in small areas in the states of Coahuila, Michoacan, Nuevo Leon, Oaxaca, Guerrero, Puebla and Chiapas (Figure 2).
Group 5: Moderate to severe warming, superficial drying, and very superficial continentalization.
The cells of this group have the same average characteristics of climate change than Group 1, with the exception of change rate of OT for the period OI, which ranges from 0 to 0.5 °C of increase in Group 5 and 0.5 to 1.0 °C in Group 1. The precipitation both in PV and OI will decrease by 10 to 50 millimeters in 2050. This type of climate change is widely distributed in large areas of Sonora, Coahuila, Nuevo Leon, Tamaulipas, Baja California and Jalisco, plus smaller surface areas in Baja California Sur, Sinaloa, Michoacan, Guerrero, Oaxaca and Veracruz (Figure 2).
Group 6: moderate warming, very superficial to superficial drying, and very superficial continentalization.
This cluster differs from previous ones in a lower warming rate expected for 2050 in PV and OI periods, as it is placed in the range 1 to 2 °C. OT PV and OI will increase from 0 to 0.5 °C, whereas precipitation PV will decrease from -10 to 0 mm and precipitation OI will decrease between 10 and 50 mm. These characteristics of climate change are mainly present in the Baja California and Sinaloa, although in a more fragmented way it can be seen in the states of Chihuahua, Sonora, Durango, Nayarit, Jalisco, Zacatecas, Coahuila, Nuevo Leon, Tamaulipas, San Luis Potosi, Veracruz, Michoacan, Guerrero, Queretaro, Guanajuato, State of Mexico, Oaxaca and Puebla (Figure 4).
Group 7: moderate to moderate-severe warming, superficial to moderate drying, and very superficial continentalization.
In this region the warming rate for 2050 will be 1 to 2 °C in OI and 2 to 3 °C in PV. OT both in PV and in OI is minimal (0 to 0.5 °C), while the precipitation PV will decrease from 100 to 150 mm and precipitation OI will decrease from 10 to 50 mm. The spatial distribution of these climate change types is found in Veracruz and Chiapas, with little presence in Oaxaca, Tabasco and Campeche (Figure 2).
Group 8: moderate - severe warming, superficial - moderate to severe drying, and very superficial to superficial continentalization.
The warming level is from 2 to 3 °C in both PV and OI, while Ot is from 0 to 0.5°C in PV and 0.5 to 1°C in OI. The level of precipitation loss is the highest of all regions in both OI (-100 to -50 mm) and PV (-300 to -150 mm). This condition of climate change is of little territorial representation and can be seen only in small areas of Veracruz and Chiapas (Figure 2).
Group 9: moderate warming, very superficial humidification to superficial-moderate drying, very superficial continentalization.
This is the only cluster in which there are no precipitation losses for any period, since in OI the change in precipitation sets a gain of 0 to 10 mm; not like this for the period PV where a reduction from -100 to -50 mm is expected. The warming level in both PV and OI is superficial, from 1 to 2 °C, while OT in both periods is insignificant (0 to 0.5 ° C). The distribution of this condition of climate change concentrates in Yucatan, Quintana Roo, Campeche, Tabasco, Chiapas and Oaxaca, with small scattered areas in Veracruz, Oaxaca, Michoacan, Puebla and Colima (Figure 2).
Group 10: superficial cooling, very superficial drying, and very superficial tropicalization
This group is distinguished by being the only one with decrease in temperature in both PV and OI (-1 to 0 °C) and by a decrease of OT in both PV and OI (-0.5 to 0 °C). Reduced levels of precipitation are also the lowest identified in all clusters, this is -10 to 0 mm in PV and OI. The representativeness of this type of climate change in terms of area is significant, but their spatial distribution is very disperse, including small areas of Baja California, Baja California Sur, Sonora, Sinaloa, Chihuahua, Durango, Nayarit, Jalisco, Michoacan, State of Mexico, Hidalgo, Tamaulipas, Guerrero, Oaxaca, Chiapas and Campeche (Figure 2).
Group 11: superficial warming, superficial drying, very superficial tropicalization to very superficial continentalization.
In this group locates the lowest warming rate (0 to 1 °C) in both PV and OI, with an increase of OT in PV very low (0 to 0.5 °C) and even a decrease of OT in OI (-0.5 to 0 °C). The precipitation loss rate is similar to that from Clusters 1, 3 and 5; this is -50 to -10 mm, in both PV and OI. This cluster is distributed in smaller areas in Sonora, Chihuahua, Durango, Sinaloa, Zacatecas, Aguascalientes, Jalisco, Guanajuato, Tamaulipas, Veracruz, Michoacan, State of Mexico, Guerrero, Oaxaca and Chiapas (Figure 2).
Conclusions
Multivariate analysis techniques allowed identifying 11 clusters of cells with different characteristics of climate change. Based on these clusters, it can be said that regionalization of climate change by year 2050 Rcp 4.5 is given mainly by thermal change characteristics and secondly by precipitation change characteristics.
Thermal change will occur in both spring-summer as in autumn-winter cycle, with similar values in both periods, although with upward trend during the spring-summer season. Within the 11 groups identified, 10 reported increasing temperature PV and OI, and decreased precipitation. Only in one cluster were found negative temperature change values (temperature decrease) in both PV and OI. Likewise, only one group was identified with increased precipitation but only during the OI cycle.
The predominant level of thermal change in the PV cycle will be 2-3 °C, while in OI is 1-2 °C. whereas the prevailing level of precipitation decrease will be from -50 to -10 mm both PV and OI.
The results obtained in this study allowed identifying the different regional manifestations of climate change in Mexico by 2050. However, it is suggested to improve the resolution of the map on this topic to make it operational.
Literatura citada
Cavazos, T.; Salinas, J. A.; Martínez, B.; Colorado, G.; de Grau, P.; Prieto-González, R.; Conde-Álvarez, A.C.; Quintanar-Isaías, A.; Santana-Sepúlveda, J. S.; Romero-Centeno, R.; Maya- Magaña, M. E.; Rosario de La Cruz, J. G.; Ayala-Enríquez, Ma. del R.; Carrillo-Tlazazanatza, H.; Santiesteban, O. y Bravo, M. E. 2013. Actualización de escenarios de cambio climático para México como parte de los productos de la quinta comunicación nacional. Informe final del proyecto al INECC, 150 p. [ Links ]
IPCC (Intergovernmental Panel on Climate Change). 2013. The physical science basis. Working group I contribution to the fifth assessment report of the intergovernmental panel on climate change. Summary for Policymakers. In: Stocker, T. F.; Dahe, Q.; Gian-Kasper, P.; Melinda, M. B.; Tignor, Simon, K. A.; Judith, B.; Alexander, N.; Yu, X.; Bex, V. and Midgley, M. P. (Eds.). Switzerland. 27 p. [ Links ]
Magaña, V. y Caetano, E. 2007. Informe final del proyecto: pronóstico climático estacional regionalizado para la República Mexicana como elemento para la reducción de riesgo, para la identificación de opciones de adaptación al cambio climático y para la alimentación del sistema: cambio climático por estado y por sector. Núm. Proyecto INE/A1-006/2007. Universidad Autónoma de México (UNAM). México. 19 p. [ Links ]
Rosenzweig, C.; Jones, J. W.; Hatfield, J. L.; Ruane, A. C.; Boote, K. J.; Thorburn, P.; Antle, J. M.; Nelson, G. C.; Porter, C.; Janssen, S.; Asseng, S.; Basso, B.; Ewert, F.; Wallach, D.; Baigorria, G. and Winter, J. M. 2013. The agricultural model intercomparison and improvement project (AgMIP): Protocols and pilot studies. Agric. Forest Meteorol. 170:166-182. [ Links ]
SAS Institute Inc. 2014. SAS/STAT® 13.2 User’s Guide. Cary, NC: SAS Institute Inc. [ Links ]
Tian, Z.; Yang, X.; Sun, L.; Fischer, G.; Liang, Z. and Pan, J. 2014. Agroclimatic conditions in China under climate change scenarios projected from regional climate models. Int. J. Climatol. 34:2988-3000, DOI: 10.1002/joc.3892. [ Links ]
Trnka, M.; Olesen, K.E.; Kersebaums, K.C.; Kkjelvág, A.O.; Eitzinger, J.; Seguin, B.; Peltonen-Sainio, P.; Rotter, R.; Iglesias, A.; Orlandini, S.; Dubrovsky, M.; Hlavinka, P.; Balek, J.; Eckersten, H.; Cloppet, E.; Calanca, P.; Gobin, A.; Vucetic, V.; Nejedlik, P.; Kumar, S.; Lalic, B.; Mestre, A.; Rossi, F.; Kozyra, J.; Alexandrov, V.; Semerádová, D. and Zalud, Z. 2011. Agroclimatic conditions in Europe under climate change. Global Change Biology, 17:2298- 2318. Doi: 10.1111/j.1365-2486.2011.02396.x. [ Links ]
Walton, D.; Meyerson, J. and Neelin, J. D. 2013. Accessing, downloading, and viewing CMIP5 data. Earth System Grid Federation. 25 pp. [ Links ]
Wishart, D. 2006. Clustan graphics primer: a guide to cluster analysis. Clustan Limited, Edinburgh. 67 p. [ Links ]
Received: November 2015; Accepted: February 2016
 Este es un artículo publicado en acceso abierto bajo una licencia Creative Commons
