


Serviços Personalizados
Journal
Artigo
 texto em
  Inglês (pdf)
 Artigo em XML
 Referências do artigo
 Enviar este artigo por email
Indicadores
-
 Citado por SciELO
 -
 Acessos
Links relacionados
-
 Similares em
SciELO
Similares em
SciELO
Compartilhar

 Permalink
Revista mexicana de ciencias agrícolas
versão impressa ISSN 2007-0934
Rev. Mex. Cienc. Agríc vol.7 no.6 Texcoco Ago./Set. 2016
Articles
Identifying historical drought periods in a region of mediterranian semiarid climate type
1Centro de Investigación Científica y de Educación Superior de Ensenada, Baja California (CICESE)-Carretera Ensenada-Tijuana No. 3918, Zona Playitas, Ensenada, B. C. México, C. P. 22860. Tel: +52 64 61 75 05 00.
2Centro de Investigación Científica y de Educación Superior de Ensenada, Baja California (CICESE)-Carretera Ensenada-Tijuana Núm. 3918, Zona Playitas, Ensenada, B. C. México, C. P. 22860. Tel: +52 6461750500. (tkretzsc@cicese.mx).
This study was conducted evaluating historical periods of drought that have affected the Valle de Guadalupe in Baja California, Mexico, which belongs to the sub-basin that has the same name. In this region are carried out major agricultural activities like growing olives, vegetables, aromatic herbs and table grapes, being the most representative grape production to produce wine. Being a semiarid surface water resource is limited, therefore all water demand is provided by the Guadalupe Aquifer. To fulfill the objective of this study it was used the calculation of the reconnaissance drought index (IRS to carry out the historical annual classification, severity, duration and frequency of meteorological drought. It was found which have been the most representative periods that have affected the region (1999 - 2009) and concludes that the results generated can be related to the decrease in volume of aquifer recharge.
Keywords: duration; drought index; frequency; intensity; Valle de Guadalupe
En este estudio se llevó a cabo la evaluación de los períodos de sequía histórica que han afectado al Valle de Guadalupe en el Estado de Baja California, México, el cual pertenece a la subcuenca que lleva el mismo nombre. En esta región se llevan a cabo actividades agrícolas de gran importancia como el cultivo de olivo, hortalizas, hierbas de olor y uva de mesa, siendo la más representativa la producción de uva para la elaboración de vino. Por ser una zona semiárida el recurso hídrico superficial es limitado, por lo tanto, toda la demanda de agua la provee el Acuífero Guadalupe. Para cumplir con el objetivo de este estudio se utilizó el cálculo del índice de reconocimiento de sequía (IRS) para llevar a cabo la clasificación anual histórica, la severidad, la duración y la frecuencia de la sequía meteorológica. Se encontraron cuáles han sido los periodos más representativos que han afectado a la región (1999 - 2009) y se concluye que los resultados generados pueden relacionarse con el descenso en el volumen de recarga del acuífero.
Palabras clave: duración; frecuencia; intensidad; índice de sequía; Valle de Guadalupe
Introduction
The Valle de Guadalupe is an inter montane valley that has an area of approximately 80 km2, surface estimated considering a slope > 5° which corresponds to the depression of the sub-basin filled with alluvial sediments where are carried out extractions of groundwater. It is located within the sub-basin of the same name in the northwestern state of Baja California, Mexico (Figure 1), between parallels 32° 8' 58" and 32° 0' 10" north latitude and between meridians 116° 41' 25" and 116° 29' 6" west longitude. With a mediterranean semi-desert climate, in this area various agricultural activities of great state, national and global importance are carried out in which viticulture stands out (Kurczyn-Robledo, 2007).
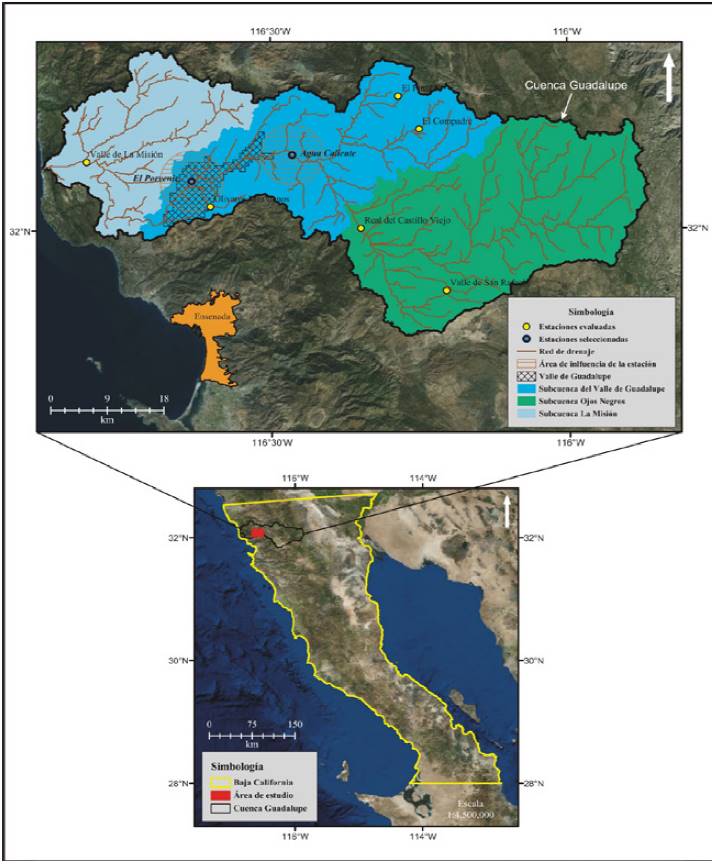
Figure 1. Hydrography of the region, location of study área and weather stations from CONAGUA evaluated and selected in this work.
The National Water Commission (CONAGUA, 2013) estimated that the temperature and average annual rainfall for the region is 16.8 °C and 295 mm, respectively, while average annual potential evaporation is estimated at 1 618 mm. The elevation of the valley ranges from 400 masl in the northeast limit to 300 masl on the southwestern border approximately, surrounded by mountains with an altitude between 500 and 1400 masl, estimated numbers with a digital elevation model of 30 m provided by the National Institute of Statistics and Geography (INEGI) obtained from its website: http://www.inegi.org.mx/geo/contenidos/datosrelieve/continental/descarga.aspx.
The main use of water is agriculture, reaching 72.6%, mainly to grow wine grapes, 18.4% for public-urban use, 6% for domestic use, 1.2% for domestic and agricultural use, 0.9% for livestock, 0.6% for agricultural and industrial use and 0.3% for industrial use (CONAGUA, 2013). The average total volume of extraction from 1990 and 2009 was estimated at 28.2 million m3/ year (CONAGUA, 2013). Currently, the Guadalupe Aquifer is the sole sustenance for activities that carried out in the valley and its surrounding areas. Another important use of this aquifer represents water supply for the city of Ensenada with an authorized volume of 6.9 Mm3, calculated by CONAGUA in 2008. Currently is in over-exploitation, as it presents an annual deficit of ~ 12 Mm3, as a result of increased extraction to the recharge level (CONAGUA, 2013), coupled with prolonged drought periods in the region (CONAGUA, 2008).
Drought is considered a natural hazard that can turn into a disaster if it lasts for long periods of time as a result of a deficit in precipitation; which can lead to economic losses, to not meet human and environmental needs (Wilhite and Buchanan-Smith, 2005). Consideration should be given with a focus on three dimensions: according to severity, duration and affected area (Tsakiris et al., 2007c).
There are several methodologies to evaluate drought, which can be divided into two categories according to the consequences of the phenomenon and that rely on indexes, combining hydrological and climatological indicators (Tsakiris and Pangalou, 2009). The first may be useful to carry out an analysis of drought events throughout history; the second allows to evaluate and characterize current drought using indices (Tsakiris and Pangalou, 2009), which are calculated from climatological information of the region of interest. To interrelate parameters link to climate, drought indices quantitatively assess climate anomalies and their intensity, duration, frequency and territorial extension (Wilhite et al., 2000). When climatological information is available, it can be analyzed the historical occurrence and likelihood of recurrence, which allows planning and management of water resources (Tsakiris et al., 2007b).
By the above, the Guadalupe Valley and its aquifer have great relevance in the region from a biological, economic and human perspective. Documenting historical periods of low water, could allow relating the occurrence of weather phenomenon with a deficit in the volume of natural recharge to the aquifer (Figure 1).
Generate strategies to optimize, conserve, use and strategic water management is a priority in the region. In this context, the main objective of the study was to carry out a description and analysis on the frequency, duration and severity of climatological drought in Valle de Guadalupe. IRS is a statistical method that allows performing a description of drought conditions, the series of historical climatological data are necessary to carry out the estimate. Same that was obtained from records of weather stations of CONAGUA. The studies to identify periods of historic drought in the region are scarce, so this work contributes to the current conditions of the phenomenon.
Materials and methods
Calculation of drought recognition rate (IRS)
IRS calculation is based on the relationship between precipitation (P) and potential evapotranspiration (ETP). The initial value of the index for a certain period of time begins with the first month of hydrological year (k) and during that year, from the following equation (Tsakiris and Vangelis, 2005):
Where: k= represents the initial value of IRS and Pj and ETPJ= is the precipitation and potential evapotranspiration from month j of the hydrological year, respectively.
In this region, P occurs in winter, while summers are usually dry so in several research papers has been noted the beginning of the hydrological year in October (Campos Gaytan, 2008, Barrandas- Argüelles, 2010 and Del Toro-Guerrero, 2014). The average initial value of IRS agrees with the aridity index proposed by the Food and Agriculture Organization of the United Nations to assess aridity of a given area (Tsakiris et al., 2007c).
Normalized IRS (IRSn) is calculated using the following equation for each year of the time series (Tsakiris et al., 2007b):
Where: āk= symbolizes the arithmetic mean of ak; a third equation represents standardized IRS (IRSstd), which is calculated from the following expression (Tsakiris et al., 2007b):
Where: yk= means ln (ak); ȳk= represents the arithmetic mean; and dsk= is the standard deviation.
In its behavior IRSstd has great similarity to the standardized precipitation index (IEP) (Tsakiris and Pangalou, 2009), so that the interpretation of the results fits to the following table (Table 1).
Table 1. Classification of drought according to IEP value and probabilities of occurrence (Tsakirys et al., 2007c).
| Valor IEP | Categoría | Probabilidad (%) |
|---|---|---|
| 2 o más | Extremadamente húmedo | 2.3 |
| 1.5 a 1.99 | Severamente húmedo | 4.4 |
| 1 a 1.49 | Moderadamente húmedo | 9.2 |
| 0 a 0.99 | Ligeramente húmedo | 34.1 |
| 0 a -0.99 | Sequía leve | 34.1 |
| -1 a -1.49 | Sequía moderada | 9.2 |
| -1.5 a -1.99 | Sequía severa | 4.4 |
| -2 o menos | Sequía extrema | 2.3 |
Tikgas (2008) also found that the corresponding values ranging from 0 to 0.99 can be set as a normal-wet condition, while values ranging from 0 to -0.50 can also be considered within the normal-dry setting.
Data processing and weather stations
IRS estimates can be complex because it involves the evaluation of spatial distribution of indicators or environmental variables (precipitation, temperature and potential evapotranspiration) (Tsakiris et al., 2007c). The Drinc program (drought index calculator), was designed to facilitate ETP calculation through Thornthwaite and IRS method, using ETP and P data from some weather station. This program was developed by the laboratory of reclamation works and water resources management from the National Technical University of Athens (Tsakiris et al., 2007c). The online version of the program can be found at: www.ewra.net/drinc (Tigkas, 2008). The network of weather stations in northwestern Mexico is large, however most of the information contains series of discontinuous time, missing values or not recorded, therefore it becomes difficult to draw the same set of data between two or more stations.
In this study the meteorological data of eight weather stations from CONAGUA (Table 2) were evaluated. These are located within the Guadalupe basin (Figure 1), however most of them have series of discontinuous data and the distance between the stations and the area of interest is greater than its area of influence, which is ~ 5 km radius according to the World Meteorological Organization, when topography is flat (WMO, 2011) (Figure 1). Only stations from El Porvenir and Agua Caliente met the criteria necessary to carry out the research work, which are: to have a series of continuous data (or as complete as possible to avoid errors in estimating missing data) and the climatological influence area corresponds to the area of study. Both have a data set of 22 and over 30 year respectively of partially continuous climatological information. The estimation of missing data was carried out with the method from the US National Weather Service described by Campos-Aranda (1992), which considers that the data can be approximate based on information estimated in the surrounding stations (Equation 4).
Table 2. Weather stations evaluated from CONAGUA in this study. The elevation is in meters above sea level.
| Estación | Latitud | Longitud | Elevación | Serie de datos | Datos faltantes |
|---|---|---|---|---|---|
| Olivares Mexicanos | 32.0357 | -116.6012 | 364 | 1954 - 2008 | Sí |
| El Pinal | 32.1992 | -116.2847 | 1291 | 1969 - 1999 | Sí |
| El Compadre | 32.15 | -116.25 | 1162 | 1948 - 1960 | No |
| Valle de San Rafael | 31.9094 | -116.2053 | 750 | 1979 - 2012 | No |
| Real del Castillo Viejo | 32.0026 | -116.3487 | 644 | 1980 - 1989 | Sí |
| Valle de La Misión | 32.1022 | -116.81 | 0 | 2000 - 2013 | No |
| Agua Caliente | 32.1124 | -116.4639 | 410 | 1978 - 2013 | No |
| El Porvenir | 32.0738 | -116.6332 | 318 | 1991 - 2013 | No |
Where: P= missing data in mm or °C; Pi= precipitation or temperature observed for the month of the missing data in auxiliary stations in mm or °C; and Wi= 1/Di2. Where: Di represents the distance between the auxiliary stations and incomplete station in km.
Precipitation and potential evapotranspiration data is appreciated in Figure 2.
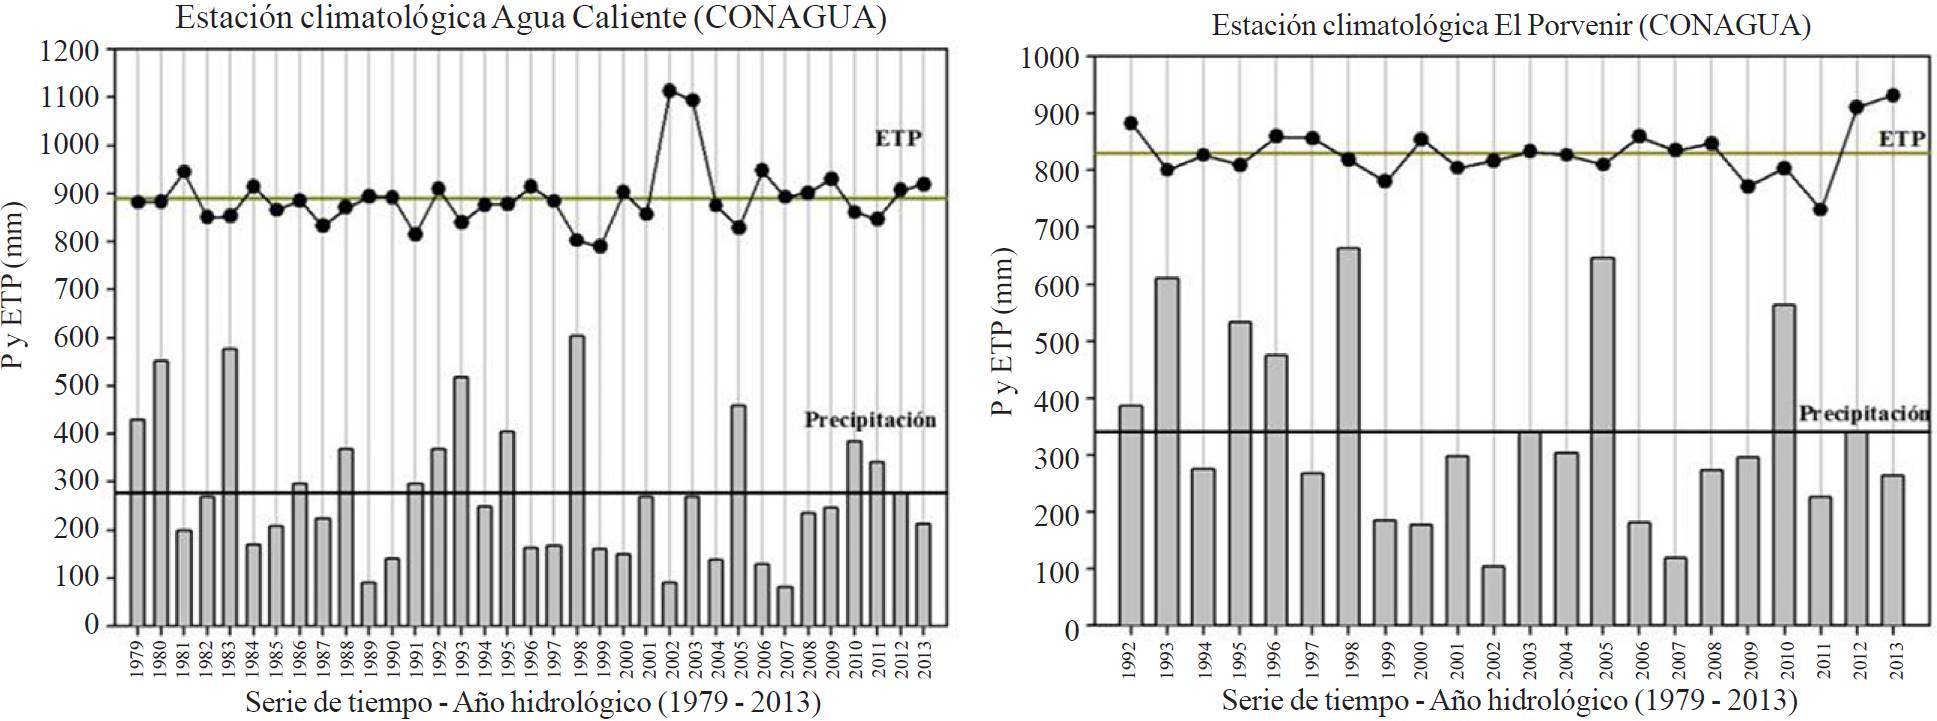
Figure 2. Annual values of P and ETP in mm of weather stations from CONAGUA in their respective time series; the bottom line represents the average historical value of P from the weather stations Agua Caliente (278 mm/year) and El Porvenir (342 mm/year). The top represents the average historical value of ETP from weather stations Agua Caliente (890 mm/year) and El Porvenir (830 mm/year).
Results and discussion
Weather analysis and identification of drought periods
IRS values were estimated with the results from weather station data, shown in Figure 3. In the northeastern portion of the Guadalupe Valley, where the station Agua Caliente is, it was observed a persistent drought that lasted 10 years (1999 -2009), during this period only the hydrological year 2005 was classified as moderately moist. Other hydrological years were classified with mild drought (1999, 2000, 2003, 2004, 2008 and 2009), moderate drought (2006), severe drought (2007) and extreme drought (2002). Other periods of drought were observed in hydrological years 1989 and 1990, being classified with severe and moderate drought respectively.
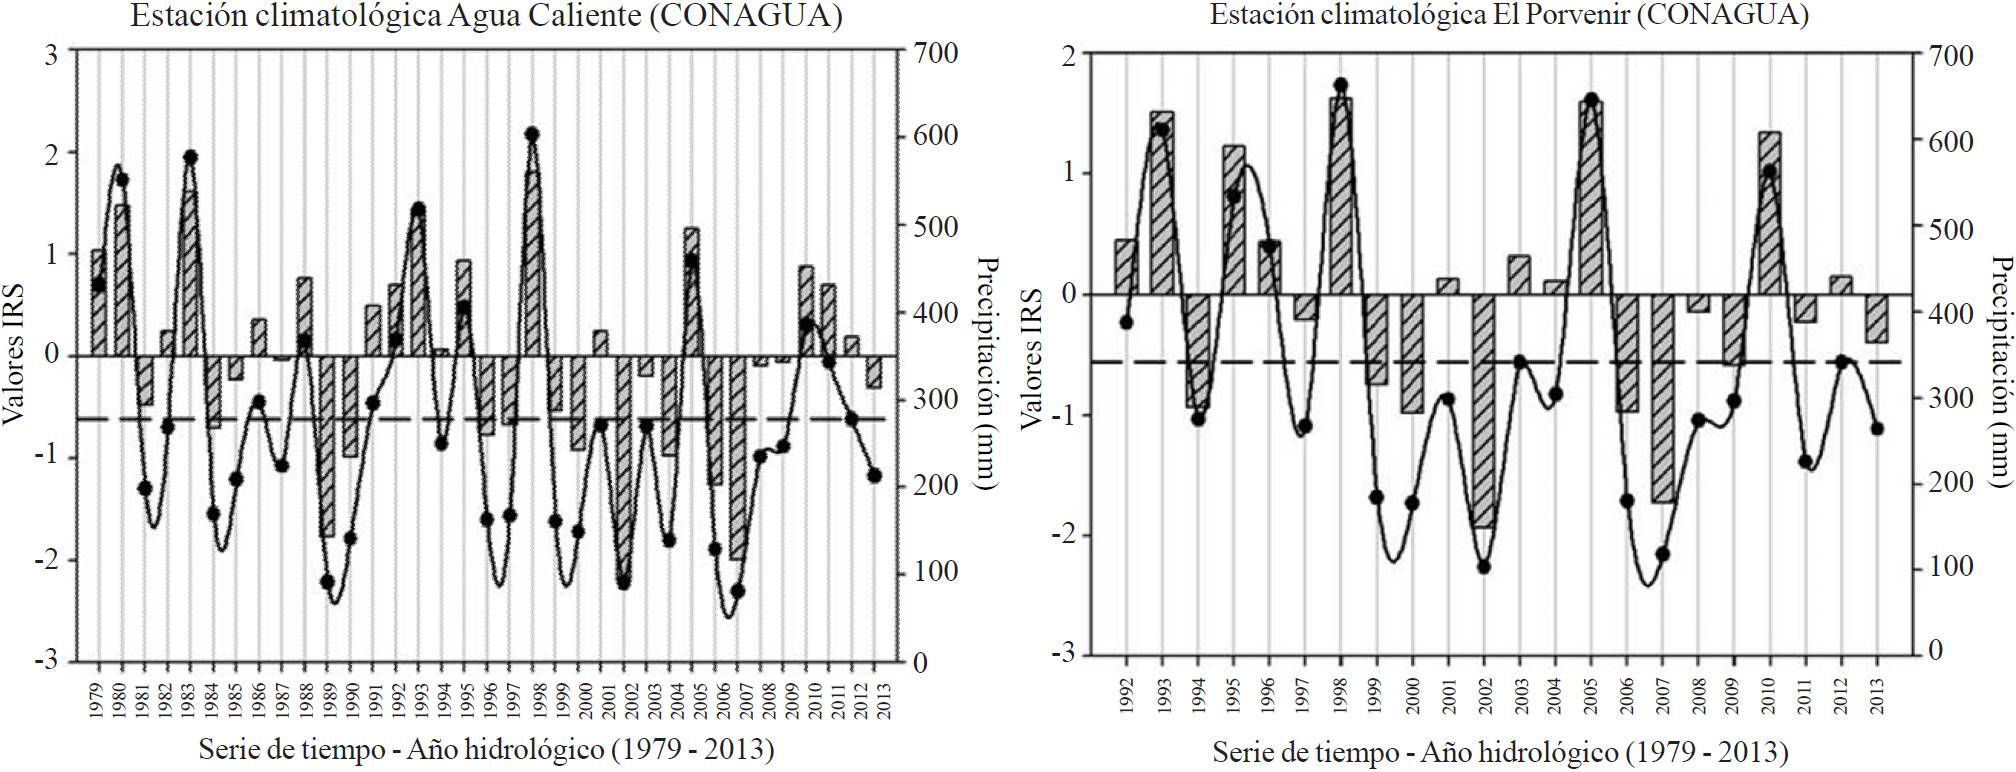
Figure 3. IRS (bars) values and average annual P (solid line with marks), where moist years differentiate from dry years separated by the value of the annual average historical P (line with spaces) and drought periods from Agua Caliente and El Porvenir stations.
In the central area from Guadalupe Valley, El Porvenir station was observed a drought lasting 4 years (2005-2009). During this period hydrological drought years were classified with mild drought (2008 and 2009), moderate drought (2006) and severe drought (2007). In addition another representative event was observed during the period (1999-2002), only the hydrological year 2001 was slightly damp. 1999 was classified with mild drought, 2000 moderate drought and 2002 severe drought (Figure 3). Severe and extreme drought coincide in the same periods for both seasons (2001-2002 and 2006-2007), and listed as hydrological years with less precipitation in the time series.
Agua Caliente station, by having a greater number of data is more evident to observe over time increased hydrologic years where annual P is smaller than average (Figure 2). Between 1979 and 1995 eight hydrological years showed this condition, while between 1996 and 2013, fourteen hydrological years exhibited a P lower than annual average. This scenario can be an indicator of a change in regional climate. By relating the above with the results shown in Figure 3, can be seen that the years in which it is documented that the P is lower than the annual average coincide with drought periods. Also, in most cases it could be classified to a hydrological year as dry when this condition is present (Figure 2 and 3) and as lower P is during the hydrological year, drought intensity increases (Figure 3).
Other important aspects to assess are drought duration and frequency. It has been seen that even moderate droughts can cause major problems if it persist for several years (Tigkas, 2008). Arid and semiarid regions may be vulnerable to these characteristics because the annual volume rainfall tends to be limited. Drought severity in the Guadalupe Valley region has a direct relationship with the reduced volume of precipitation (Figure 3); however, severe and extreme droughts have been rare (8.5% Agua Caliente and 9% El Porvenir) with respect to the corresponding time series analysis. While frequency and duration have had great importance in the region by analyzing drought.
With an approximate duration of 10 years, the most representative period (1999-2009) and some other events throughout the study. The Regional Hydraulic Program 2003-2006, states that the aquifer was listed with a status of sub exploitation, because the volume of recharge was estimated at 24 million m3/year and an extraction of 22 million m3/year (Kurczyn-Robledo, 2007). In 2009, the National Water Commission reported a deficit of 19 million m3/year, this means that in just three years the aquifer went from being classified as sub exploited to overexploit. In 2013, the same institution estimated a deficit of 12 million m3/year which are extracted from non-renewable aquifer storage, so until today the aquifer is still considered in a status of overexploitation.
Conclusions
The IRS index adequately characterizes the severity, duration and frequency of drought, in addition this methodology is a practical and appropriate tool for description of the phenomenon in the past and provides relevant information on current conditions of dry season allowing to generate management strategies and prevention.
Identification analysis of drought, using IRS index in combination with data from historical annual precipitation can define and describe the phenomenon in the region of Guadalupe Valley and the results generated can be related to the decrease in the volume of water storage underground in the Guadalupe Aquifer from the climatological point of view.
Literatura citada
Barrandas, A. M. R. 2010. Cambios hidrológicos en las cuencas que abastecen de agua a la zona de Ensenada, Baja California, México. Tesis de Maestría. Centro de Investigación Científica y de Educación Superior de Ensenada (CICESE). Ensenada, B.C. México. 66 p. [ Links ]
Campos, A. D. F. 1992. Procesos del ciclo hidrológico. Segunda reimpresión. Universidad Autónoma de San Luis Potosí. México. [ Links ]
Campos, G. J. R. 2008. Simulación del flujo de agua subterránea en el acuífero del Valle de Guadalupe, Baja California, México. Tesis de doctorado. Centro de Investigación Científica y de Educación Superior de Ensenada (CICESE). Ensenada, B. C. México. 220 p. [ Links ]
CONAGUA. 2008. Plan maestro de manejo del Acuífero Guadalupe, Municipio de Ensenada, B.C. Tomo III. Informe técnico. Ensenada, B. C. México. 111 p. [ Links ]
CONAGUA. 2009. Determinación de la disponibilidad de agua en el Acuífero Guadalupe (0207). Estado de Baja California. Subdirección General Técnica. Gerencia de Aguas Subterráneas. Subgerencia de Evaluación y Ordenamiento de Acuíferos. México. Publicado en el Diario Oficial de la Federación. 21 p. [ Links ]
CONAGUA. 2013. Determinación de la disponibilidad de agua en el Acuífero Guadalupe (0207). Estado de Baja California. Subdirección General Técnica. Gerencia de Aguas Subterráneas. Subgerencia de Evaluación y Ordenamiento de Acuíferos. México. Publicado en el Diario Oficial de la Federación. 31 p. [ Links ]
Del Toro, G. F. J.; Kretzschmar, T. e Hinojosa, C. A. 2014. Estimación del balance hídrico en una cuenca semiárida, El Mogor, Baja California, México. México. Tecnología y Ciencias del Agua. 6(5):69-81. [ Links ]
Kurczyn, R. A.; Kretzschmar, T. e Hinojosa, C. A. 2007. Evaluación del escurrimiento superficial en el noroeste del Valle de Guadalupe, B. C. México, usando el método de curvas numeradas y datos de satélite. México. Rev. Mex. Cienc. Geol. 24(1):1-14. [ Links ]
Tigkas, D. 2008. Drought characterization and monitoring in regions of Greece. Greece. European Water. 23(24):29-39. [ Links ]
OMM. 2011. Guía de prácticas climatológicas. Organización Meteorológica Mundial. 100. Ginebra, Suiza. 128 p. [ Links ]
Tsakiris, G. and Vangelis, H. 2005. Establishing a drought index incorporating evapotranspiration. European Water. 9-10:1-9. [ Links ]
Tsakiris, G.; Pangalou, D. and Vangelis, H. 2007b. Regional drought assessment based on the reconnaissance drought index (RDI). Water Res. Manag. 21(5):821-833. [ Links ]
Tsakiris, G.; Tigkas, D.; Vangelis, H. and Pangalou, D. 2007c. regional drought identification and assessment - case study in Crete. In: methods and tools for drought analysis and management, Rossi, L. (Eds.). Springer, The Netherlands. 169-191 pp. [ Links ]
Tsakiris, G. and Pangalou, D. 2009. Drought Characterisation in the Mediterranean. In: Iglesias, A.; Garrote, L. and Concelliere, A. (Eds). Coping with drought risk in agriculture and water supply. Advances in natural and technological hazards research. Springer, New York. 69-80 pp. [ Links ]
Wilhite, D. A.; Hayes, M. J. and Svodoba, M. D. 2000. Drought monitoring and assessment: status and trends in the United States. The Netherlands. Drought and Drought Mitigation in Europe. Advances in Natural and Technological Hazards Research. (14):149-160. [ Links ]
Wilhite, D. A. and Buchanan, S. M. 2005. Drought as a Hazard: undestanding the natural and social context. In: Wilhite, D. (Ed.). Drought and water crisis science. Technology and Management Issues. 3-32 pp. [ Links ]
Received: January 2016; Accepted: March 2016
 Este es un artículo publicado en acceso abierto bajo una licencia Creative Commons
