


Servicios Personalizados
Revista
Articulo
 texto en
  Inglés (pdf)
 Artículo en XML
 Referencias del artículo
 Enviar artículo por email
Indicadores
-
 Citado por SciELO
 -
 Accesos
Links relacionados
-
 Similares en
SciELO
Similares en
SciELO
Compartir

 Permalink
Revista mexicana de ciencias agrícolas
versión impresa ISSN 2007-0934
Rev. Mex. Cienc. Agríc vol.7 no.6 Texcoco ago./sep. 2016
Articles
Yield, water use efficiency in canola based on nitrogen and distance between rows
1Campus Montecillo-Colegio de Postgraduados. Montecillo, Texcoco, Estado de México C. P. 56230. (jasee@colpos.mx; mate@colpos.mx).
2Instituto de Investigación Científica área de Ciencias Naturales-Universidad Autónoma de Guerrero. Chilpancingo, Guerrero México.
Canola (Brassica napus L.) produces edible oil that helps prevent heart disease and rheumatoid arthritis. Thus, the research topics on this crop are justified, especially in the search for strategies to increase water productivity. The aim of the study was to determine in canola genotypes, the effect of the distance between rows and nitrogen fertilization on: water use efficiency (EUA), biomass (BT), harvest index (IC), yield grain (RG) and oil (RA). Treatments consisted of planting on June 20, 2011, Canada I, Canada II and Westar genotypes, with supply of 0 and 100 kg of nitrogen (N) and distance between rows (DH) of 0.40 m (DC) and 0.80 m (DA) which generated a density of 25 and 12.5 plants m-2. The experimental design was randomized blocks in split plots and four replications. Canada II genotype had EUA, BT, RG and RA higher than Westar and Canada I. This trend was observed with application of N and DC planting. While Canada II genotype in DC plantings with N, had EUA, BT, RG and RA higher. The grain oil content was not affected by treatments. These results indicate that by reducing the distance between rows and nitrogen fertilization can achieve increased water productivity and consequently greater production of canola.
Keywords: Brassica napus; heat units; oil content; oil yield; phenology
La canola (Brassica napus L.) produce aceite comestible que ayuda a prevenir enfermedades del corazón y artritis reumatoide. Así, los temas de investigación sobre este cultivo son justificados, sobre todo en la búsqueda de estrategias para elevar la productividad del agua. El objetivo del estudio fue determinar en genotipos de canola, el efecto de la distancia entre hileras de plantas y la fertilización nitrogenada sobre: la eficiencia en el uso del agua (EUA), biomasa (BT), índice de cosecha (IC), rendimiento en grano (RG) y de aceite (RA). Los tratamientos consistieron en la siembra el 20 de junio de 2011, de los genotipos Canadá I, Canadá II y Westar, con suministro de 0 y 100 kg de nitrógeno (N) y distancia entre hileras (DH) de 0.40 m (DC) y 0.80 m (DA) que generó una densidad de 25 y 12.5 plantas m-2. El diseño experimental fue bloques al azar con arreglo en parcelas subdivididas y cuatro repeticiones. El genotipo Canadá II presentó una EUA, BT, RG y RA superior a Westar y Canadá I. Dicha tendencia se observó con la aplicación de N y la siembra a DC. Mientras que el genotipo Canadá II en siembras a DC con N, presentó la EUA, BT, RG y RA más altos. El contenido de aceite del grano no fue afectado por los tratamientos. Estos resultados indican que mediante la reducción de la distancia entre hileras y la fertilización nitrogenada puede lograrse una mayor productividad del agua y en consecuencia mayor producción de canola.
Palabras clave: Brassica napus; contenido de aceite; fenología; rendimiento de aceite; unidades calor
Introduction
Canola (Brassica napus L.) is an oilseed from which a high quality edible oil is obtained which contains essential fatty acids and can help prevent heart diseases and some autoimmune such as rheumatoid arthritis (Morris, 2004). It is also an alternative for biodiesel production (Panozzo et al., 2014). The term canola was used to differentiate rapeseed varieties containing from 20 to 55% erucic acid that is toxic for humans as well as glucosinolates, which are compounds that cause harmful effects to the body, by reducing the level of hormones and causes abnormalities in the development of liver, kidney and thyroid (Pass and Pierce, 2002).
Canola contains less than 2% of erucic acid and no significant amounts of glucosinolates (Starner et al., 1999). Data from SIAP (2011) show that in Mexico, rainfed production of canola was 3 146 t, being the leading states in production order Tamaulipas (1 402 ha), State of Mexico (1 023 ha), Hidalgo (319 ha), Tlaxcala (283 ha), Durango (142 ha) and Puebla (130 ha). In Tamaulipas have been conducted studies with hybrids like Hyola 401, Hyola 308 and Hyola 330 and variety ICM 204, with an average of 1.613 t ha-1, under plantings with residual moisture in autumn with one auxiliary irrigation, planting pattern of 0.80 m* 0.05 m and 100-60-00 of N, P and K (Ortegón et al., 2006a).
Hernandez et al. (2008) mention that for the tropical region of Jalisco, a yield of 3.223 t ha-1 under irrigation with Hyola 401 (53 days to flowering) and 1.445 t ha-1 with Westar (67 days to flowering) in autumn planting with planting pattern 0.76 m* 0.05 m and 110-55-00 kg ha-1 of N-P-K. In the State of Mexico, canola is planted under rainfed, with an average yield of 1.6 t ha-1 (SIAP, 2011). The main producing municipality is Juchitepec (415 ha), followed by Villa de Allende (190 ha), Villa Victoria (170 ha), Ixtapaluca, Rayon (60 ha) and Tenango del Valle (55 ha).
With less than 50 ha, Almoloya de Juárez, Axapuso, San Antonio Island, Hueypoxtla, Cocotitlán, Nopaltepec, Temascalapa and Tlamanalco. Results obtained in previous studies (Ortegón et al., 2002) prove that canola seeding at distance of 80 cm between rows is the most efficient method in Tamaulipas and other regions of the country (Muñoz et al., 2002). However, such production of canola and domestic do not cover the requirements to meet consumption needs of the population, therefore the need to import. An alternative to reduce such purchase abroad is to increase the yield per unit area, by incorporating genotypes and implementation of appropriate management practices for each region.
Within the last, planting at short distance between rows lead to increased population density (DP) and nitrogen fertilization can be an alternative, as has been reported in sunflower by Aguilar et al. (2005). Thus, the aim of the study was to determine the effect of the distance between rows or grooves and nitrogen fertilization in canola under rainfed conditions in Valles Altos on: a) days to phenological stages; b) biomass, harvest index, grain yield and oil; c) yield components and oil content of the grain; and d) water use efficiency.
Materials and methods
The study was conducted under rainfed conditions in Montecillo, Mexico, with temperate climate during the summer, in a vertisol, pH 7.7, 2% organic matter and 40 kg of inorganic nitrogen per hectare. Sowing was carried out on June 20, 2011. The treatments consisted of planting three Canola genotypes (G): Canada I (CI), Canada II (CII) and Westar (W); supplying 0 (N0) and 100 kg (N+) of nitrogen (N), distance between rows (DH) of 0.40 m (DC) and 0.80 m (DA) and between plants of 0.10 m, generating a density of 25 and 12.5 plants m-2, respectively. 100 kg of phosphorus per was applied to the crop. The experimental design was randomized blocks in split plots and four replications.
Days to phenological stages like: emergence (E), stem growth (CT), flowering initiation (IF), end of flowering (FF), 50% of mature siliques (MS50), 80% of mature siliques (MS80) and full physiological maturity (MT), the criterion was when 80% of the plants showed these characteristics. At MT was determined: grain yield (RG, 10% moisture), oil content (CA) in the grain, using the technique of nuclear magnetic resonance, oil yield (RA) was calculated by the following equation: RA= (CA*RG) / 100; thousand grain weight (PMG), number of grains m-2 (NG), number of fruits or siliques m-2 (NF), number of stems m-2 (NT), biomass (BT, g m- 2) and harvest index (IC= [RG / BT] * 100).
In addition, during crop development average maximum (Tmax) and average minimum (Tmin) temperature, evaporation (EV) and precipitation (PP) was recorded. Crop evapotranspiration (ETc) was calculated by the equation: ETc= Ev *K* Kc; where EV= evaporation from tank type "A", K= coefficient tank (0.7) and Kc= crop coefficient (0.6) according to Doorenbos and Pruit (1986). Heat accumulation was determined by heat units (UC, °C day) with equation UC= Taverage-Tb (Snyder, 1985), where Tb is the base temperature. For study purposes was considered a Tb= 5 °C (Morrison et al., 1989).
ETc / PP ratio was calculated to determine the degree of severity of water deficit (SDH) to which the crop was subjected, considering that a value lower than or equal to 1, the crop is not under SDH, since available water is greater or equal to the amount of water used by ETc. The degree of SDH is higher when the values are greater than 1. Water use efficiency (EUA, g m-2 mm-1) was calculated using the approach: EUA = BT, RG and RA / ETc; where BT, RG and RA are total biomass, grain yield and oil yield, respectively; ETc is seasonal crop evapotranspiration. The variables under study were subject to an analysis of variance (ANOVA) and comparison test of Tukey (α= 0.05).
Results and discussion
Phenology and climate elements
Figure 1 presents the dynamics of climate elements, it is noted that during the vegetative and reproductive stage, Tmax ranged from 22 °C to 25 °C and Tmin between 7 °C - 12 °C and 1.5 °C -10 °C, respectively. Morrison and Stewart (2002) mention that under controlled greenhouse conditions, at temperatures greater than 27 °C flower sterility increases, while lower temperature adversely affects RG due to a reduction in the number and size of seed per silique (Ortegón et al., 2006b). Seasonal rainfall (PP) and evaporation (EV) was 326 mm and 408 mm, respectively.
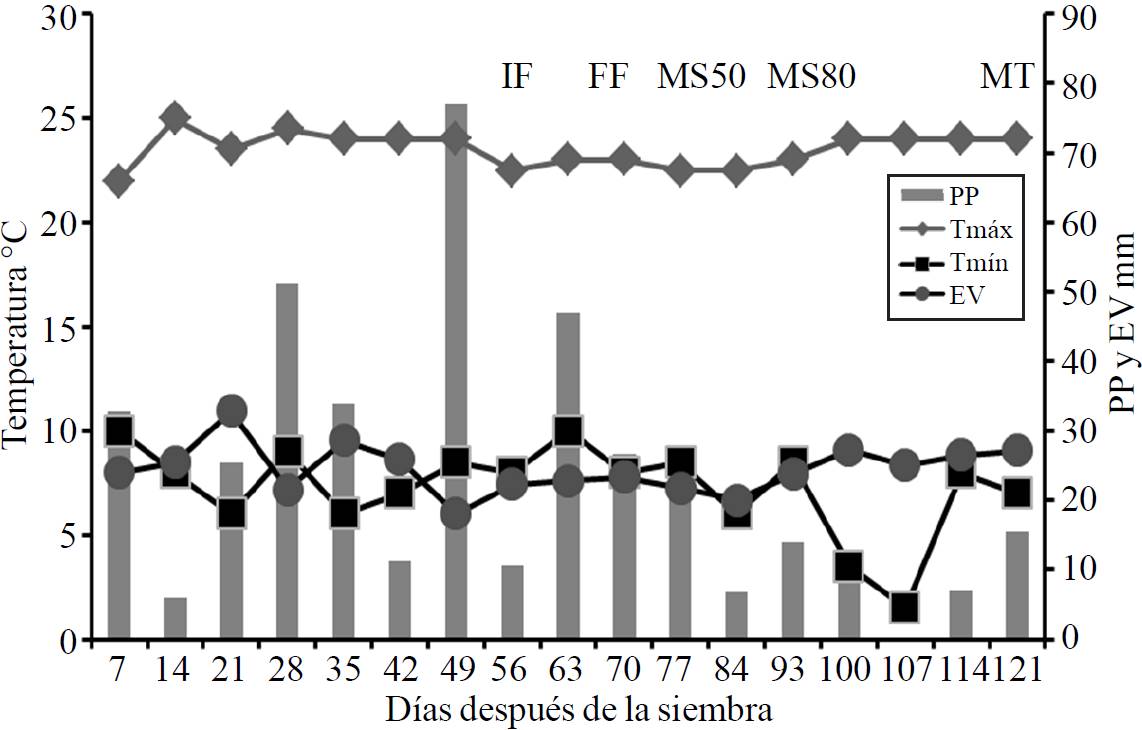
Figure 1. Dynamics of the weekly average maximum (Tmax) and minimum (Tmin) temperature, weekly amount of rainfall (PP, mm) and evaporation (EV, mm) during canola crop development. Montecillo, State of Mexico. Summer 2011.
Seasonal ETc was 163 mm of which 69 mm occurred during the vegetative stage and 94 mm during reproductive stage. This indicates that evaporative demand was higher than the available water. As shown in Figure 2, the crop was under severe water deficit (higher SDH), particularly during the reproductive stage of siliques filling (period from MS80 to MT), limiting a higher expression of canola tield, as has been reported by Olsson (1960) and Seyedmohammadi et al. (2011).
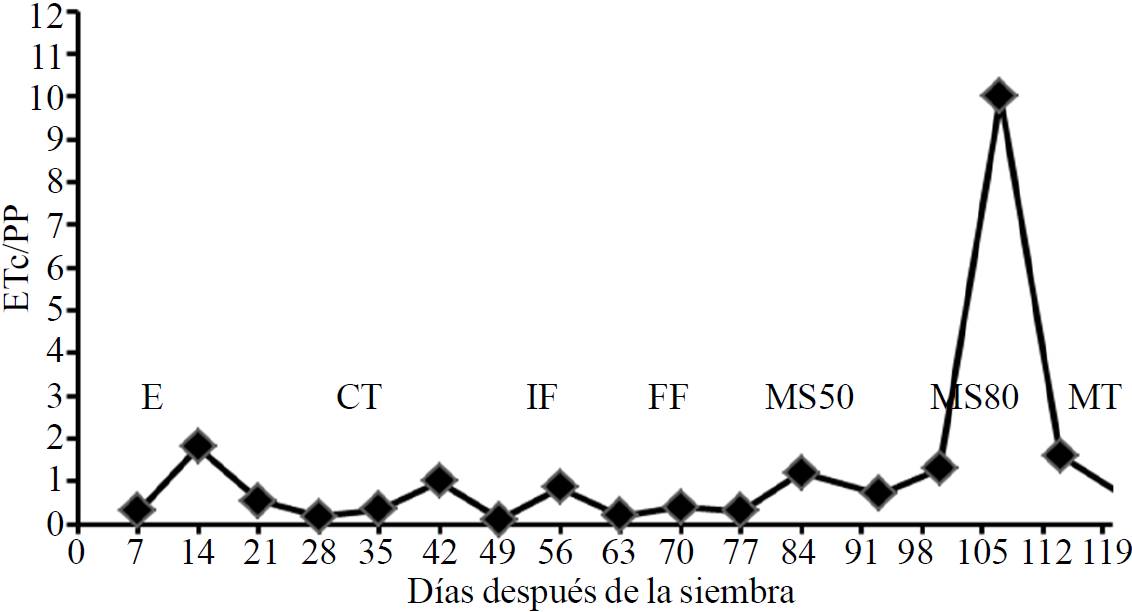
Figure 2. Dynamics of severe water deficit (SDH= ETc / PP) during canola crop development. Montecillo, State of Mexico. Summer 2011.
The time to occurrence of phenological stages, accumulated heat (UC, °C d-1), and seasonal crop evapotranspiration (ETc, mm) was similar between treatments. Crop emergence (E) occurred 8 days after sowing (dds), beginning of stem growth (CT) at 30 dds, flowering initiation (IF) at 47 dds, end of flowering ( FF) at 67 dds, 50% to mature siliques (MS50) at 84 dds, 80% of mature siliques at 102 dds and full maturity of siliques (MT) or physiological crop maturity (FM) at 115 dds. At each stage, UC were 107 at E, 338 at CT, 517 at IF, 727 at FF, 905 at MS50, 1094 at MS80 and 1231 °C d-1 at MF.
Biomass and harvest index
For total biomass (BT) and harvest index (CI), ANOVA showed significant changes by effect of G, N, DH and interaction G*N*DH (Table 1). The highest BT production corresponded to CII with 469 gm-2, which outperformed Westar and CI by 29% and 43%, respectively. Regarding N, canola with N showed higher BT (508 g m-2) and exceeded by 92% the control (without N). Similar trends were observed by shortening DH and consequent increase in DP, as in this way the soil is covered from early growth stages, with consequent higher intercepted radiation and increased BT production. This has also been reported for sunflower by Escalante (1995) and in beans by Escalante et al. (2011). Moreover, in relation to the interaction G*N*DH, the highest BT (920 gm-2) was achieved with the combination CIIN + DC, followed by WN + DC and CIN + DC with 713 gm-2 and 518 gm-2, respectively (Table 2). This indicates that by sowing CII with DC and N was more efficient in the use of space, water, nutrients and sunlight.
Table 1. Analysis of variance in Canola genotypes (B. napus L.) in function of nitrogen and row spacing. Montecillo, State of Mexico. Summer 2011.
| Factor | BT (gm -2 ) | IC (%) | RG (gm -2 ) | NG (m -2 ) | PMG (g) | NT (m -2 ) | CA (%) | RA (gm -2 ) |
|---|---|---|---|---|---|---|---|---|
| G | * | * | ** | ** | NS | * | NS | ** |
| N | *** | NS | ** | ** | NS | * | NS | ** |
| G*N | NS | NS | * | ** | NS | NS | NS | * |
| DH | *** | *** | ** | ** | NS | *** | NS | *** |
| G*DH | NS | NS | NS | NS | NS | NS | NS | NS |
| N*DH | * | NS | * | * | NS | NS | NS | * |
| G*N*DH | * | * | * | NS | NS | NS | NS | * |
Table 2. Biomass, yield and yield components of canola genotypes in function of distance between sowing rows and nitrogen (main effects). Montecillo, State of Mexico. Summer 2011.
| Trat | BT gm -2 | IC (%) | RG (gm -2 ) | NG m -2 (miles) | PMG (g) | NG (m -2 ) | NT (m -2 ) | CA (%) | RA (gm -2 ) |
|---|---|---|---|---|---|---|---|---|---|
| CII | 469 a | 20 | 107 a | 26.7 a | 4.0 | 1068 a | 65 a | 47 | 50 a |
| West | 363 b | 18 | 73 ab | 19.7 b | 3.7 | 788 b | 44 b | 48 | 35 ab |
| CI | 327 b | 24 | 62 b | 15.9 c | 3.9 | 636 c | 58 a | 47 | 29 b |
| Tukeyα= 0.05 | 105 | 8 | 43 | 3 | NS | 98 | 10 | 2 | 18 |
| N10 | 508 a | 19 b | 101 a | 26.6 a | 3.8 | 1064 a | 65 a | 47 | 48 a |
| N0 | 265 b | 22 a | 61 b | 15.6 b | 3.9 | 624 b | 46 b | 47 | 29 b |
| Tukeyα= 0.05 | 57 | 2 | 11 | 5 | NS | 150 | 9 | 0.7 | 5 |
| DC | 558 a | 23 a | 121 a | 31.0 a | 3.9 | 1240 a | 80 a | 47 | 58 a |
| DA | 215 b | 18 b | 40 b | 10.5 b | 3.8 | 420 b | 31 b | 47 | 19 b |
| Tukeyα= 0.05 | 57 | 2 | 11 | 7 | NS | 162 | 9 | 0.7 | 5 |
| Media general | 387 | 21 | 81 | 20.8 | 3.9 | 832 | 56 | 47 | 38 |
| CV (%) | 24 | 16 | 23 | 10 | 12 | 15 | 28 | 2 | 23 |
As for IC, genotype CI was more efficient in distributing larger amount of MS towards the grain and showed the highest IC (24%) which was higher by 20% and 33% to IC of CII and West, respectively (Table 1). However, as will be seen later, this was not reflected in higher RG. Moreover, N influenced canola to show higher IC than control. Similar response has been reported in beans (Escalante and Rodriguez, 2010) and broad bean (Escalante and Rodríguez, 2011). Such behavior is probably due to the formation of more demand organs (siliques and grain), which manage the distribution of MS towards grain.
Also, shortening DH led canola to show higher IC regarding planting under wide DH. Regarding the interaction, treatment CIIN0DC showed the highest IC with 30%, followed by WN0DC with IC of 24% and CIN + DC with 22% and CIIN + DC with 21%. The lowest IC (15% -18%) corresponded to treatment CIN + DA, WN + DA, CINODA, overall G and N that combined with DA (Table 2).
Grain yield, oil yield and its components
RG and NT showed significant differences due to G, N, DH and interaction N *DH, G*N*DH (Table 1). CII genotype had the highest RG with 107 g m-2 and exceeded by 46% and 72% to West and CI, respectively. With N, canola had the highest RG, possibly due to increased demand generated by the larger number of grains and fruits (Escalante and Rodríguez, 2010). Canola planted at DC with consequent increase in DP, showed higher RG. These results contrast with those reported by Díaz et al. (2011), who report that RG from cv Monty, decreased as DP was increased from 3 to 10 plants m-2, due in first instance to different planting pattern that was only 0.80 m between rows and genetic material.
Note that the effect of the interaction G*N*DH was determined mostly by the interaction N*DH withn each genotype. Thus, the highest RG and RA corresponded to the combination CIIN+DC with 197 gm-2 and 92 gm-2, which was higher by 45 and 44%; and 74 and 73% to WN+DC and CIN+DC, respectively. The lowest values (<40 g m-2) corresponded to plantings in DA and combinations CIN+DA, CIIN0DA, WN0DA, WN+DA and CIN0DA (Table 3). Such increases in RG and RA were associated with increases in BT, NG, NF and NT. Grain size (PMG) and CA were not affected by the interaction (Table 3).
Table 3. Biomass yield and yield components of canola in function of genotype, nitrogen and distance between sowing rows interaction. Montecillo, State of Mexico. Summer 2011.
| Trat | BT (gm -2 ) | IC (%) | RG (gm -2 ) | NG m -2 (miles) | PMG (g) | NF (m -2 ) | NT(m -2 ) | CA (%) | RA (gm -2 ) |
|---|---|---|---|---|---|---|---|---|---|
| CIIN+DC | 920 a | 21 bc | 197 a | 49.2 a | 4.1 | 1968ª | 111 a | 47 | 92 a |
| WN+DC | 713 ab | 19 bc | 136 b | 36.7b | 3.7 | 1468b | 85 ab | 48 | 65 b |
| CIN+DC | 518 bc | 22 abc | 113 bc | 28.9bc | 3.9 | 1156bc | 86 ab | 47 | 53 bc |
| WN0DC | 457 cd | 24 ab | 109 bc | 29.4bc | 3.7 | 1176bc | 60 bcd | 48 | 53 bc |
| CIIN+DA | 494 cd | 21 bc | 103 bc | 25.1bc | 4.1 | 1004bc | 54 cde | 47 | 48 bc |
| CIIN0DC | 310 cde | 30ª | 93 bc | 24.5bc | 3.8 | 980bc | 63 bcd | 47 | 44 bc |
| CIN0DC | 432 cd | 19 bc | 81 cd | 19.3bc | 4.2 | 772bc | 77 abc | 48 | 39 cd |
| CIN+DA | 262 de | 15 c | 38 de | 9.7de | 3.9 | 388cd | 40 cde | 47 | 18 e |
| CIIN0DA | 154 e | 22 abc | 34 de | 8.3de | 4.1 | 332cd | 33 de | 47 | 16 e |
| WN0DA | 142 e | 19 bc | 27 e | 7.9e | 3.4 | 316d | 18 e | 48 | 13 e |
| WN+DA | 142 e | 16 bc | 22 e | 5.8e | 3.8 | 232d | 15 e | 48 | 11 e |
| CIN0DA | 98 e | 18 bc | 18 e | 4.9e | 3.7 | 196d | 27 de | 47 | 9 e |
| CV (%) | 24 | 16 | 23 | 10 | 12 | 15 | 28 | 2 | 23 |
| Media general | 387 | 21 | 81 | 20.8 | 3.9 | 832 | 56 | 47 | 38 |
| G*N*D | 234 | 8 | 47 | 8 | 0.4 | 350 | 40 | 2.7 | 22 |
| Tukeyα= 0.05 |
Relations between yield and its components
Table 4 shows that RG and RA showed high relationship with NG, NF, NT and BT. In contrast, the relationship between RG with grain size (represented here by PMG) and CA was low and not significant, this indicates that both RG components exhibit stability to changes in FN and DH. Thus, to achieve increases in RG of canola, must seek plants with larger canopy (BT), higher NT, NF and NG. Note that by applying the Stepwise procedure, the variable that best explained the changes in RG and RA was NF. Thus, the model was RG= -0.49 + 0.098 NF; with R2= 0.99**; and the equation RA= 0.25 + 0.046 with R2= 0.99 NF** was the best model to estimate RG.
Table 4. Pearson correlation coefficients (r) between grain yield, oil yield, biomass, harvest index and its components in canola in function of the genotype, nitrogen and row spacing. Montecillo, State of Mexico. Summer 2011.
| BT | IC | RG | NG | PMG | NF | NT | CA | RA | |
|---|---|---|---|---|---|---|---|---|---|
| BT | 0.12NS | 0.97** | 0.97** | 0.30NS | 0.96** | 0.92** | -0.13NS | 0.97** | |
| IC | 0.34NS | 0.34NS | -0.006NS | 0.36NS | 0.29NS | -0.31NS | 0.34NS | ||
| RG | 0.97** | 0.27NS | 0.97** | 0.93** | -0.21NS | 0.99** | |||
| NG | 0.21NS | 0.99** | 0.92** | -0.17NS | 0.99** | ||||
| PMG | 0.2NS | 0.4NS | -0.49NS | 0.26NS | |||||
| NF | -0.17NS | 0.98** | |||||||
| NT | -0.23NS | 0.93** | |||||||
| CA | -0.85NS |
Water use efficiency (EUA)
Water use efficiency (EUA) for RG (EUARG), RA (EUARA) and BT (EUAB), ANOVA showed significant differences between genotypes (G), N levels, DH and by the interaction between these factors (Table 5). Table 6 shows that CII had a EUA for RG, RA and BT, higher than West and CI showing similar efficiency. Also, with N and planting at DC, EUA was higher. Such increased EUA may be related to the size of the canopy, also induced by nitrogen fertilization and by planting short distances, as was also demonstrated by Escalante (1995) in sunflower. As for the interaction G*N*DH; the treatment with highest EUA for RG, RA and BT was CIIN + DC, followed by WN+DC and CIN + DC. The lowest values corresponded to WN0DA, WN+DA and CIN0DA (Figure 3). It should be noted that overall the highest EUA was found in genotypes with N and DC (Table 6).
Table 5. Analysis of variance for water use efficiency in biomass, grain yield and oil in Canola genotypes (B. napus L.) in function of nitrogen and row spacing. Montecillo, State of Mexico. Summer 2011.
| Factor | EUARG (gm -2 mm -1 ) | EUARA (gm -2 mm -1 ) | EUAB (gm -2 mm -1 ) |
|---|---|---|---|
| G | *** | *** | ** |
| N | ** | ** | *** |
| G*N | NS | NS | * |
| DH | *** | *** | *** |
| G*DH | *** | *** | *** |
| N*DH | ** | * | ** |
| G*N*DH | ** | * | ** |
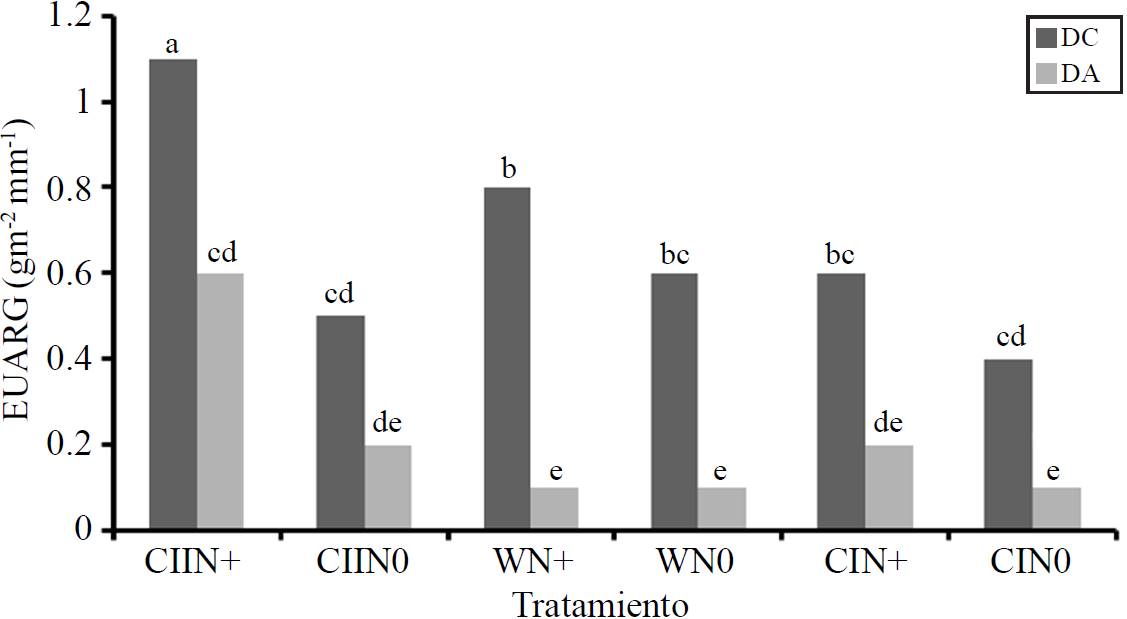
Figure 3. Water use efficiency for grain yield (EUARG, g m-2 mm-1) of canola genotypes in funcetion of nitrogen and planting distance between rows. Montecillo, State of Mexico. Summer 2011.
Finally, for the study region, the highest RG and RA from CII was associated with a greater number of grains, siliques, stems and greater water use efficiency and radiation generated by a larger canopy, as evidenced by the highest BT. Also, with N and planting at DC achieved higher EUA due to the increase in the size of the canopy, as indicated by the highest BT, which could lead to increased soil cover from early growth stages and as consequence higher intercepted radiation as demonstrated in sunflower (Escalante, 2001) and beans (Escalante and Rodríguez, 2011).
Conclusions
Days to occurrence of phenological stages were not affected by the nitrogen application and changes in distance between rows for canola genotypes under study. Canada II genotype showed a water use efficiency, biomass, grain yield and oil higher than Westar and Canada I. With nitrogen application and planting at short distances between rows achieves greater water use efficiency, biomass, both grain and oil yield. Canada II in plantings at short distances with nitrogen had the highest water use efficiency, biomass, grain yield and oil .The number of siliques was the component that showed greater relationship with yield. Grain oil content was not affected by treatments.
Literatura citada
Aguilar, G. L.; Escalante, E. J. A.; Tijerina, Ch. L.; Engleman, E. M. y Fucikovsky, L. 2005. Área foliar, tasa de asimilación neta, rendimiento y densidad de población en girasol. Terra Latinoamericana. 23(3):303-310. [ Links ]
Díaz, H. R.; Jiménez, L. A. y González, H. A. 2011. Efecto de la densidad de siembra sobre el rendimiento y usos en canola cultivar Monty. Ciencias Agrícolas Informa. 20(2):73-86. [ Links ]
Doorenbos, J. y Pruitt, W. O. 1986. Las necesidades del agua para los cultivos. Estudio FAO. Riego y drenaje. Manual 24. 194 p. [ Links ]
Escalante, E. J. A. 1995. Aprovechamiento del recurso agua en cultivos de secano. Agroproductividad. 3:28-32. [ Links ]
Escalante, E. J. A. 2001. Biomasa, rendimiento, eficiencia en el uso del agua y nitrógeno en girasol de humedad residual. Terra. 19(1):19-27. [ Links ]
Escalante, E. J. A. y Rodríguez, G. Ma. T. 2010. Biomasa, índice de cosecha y componentes del rendimiento en frijol y nitrógeno. Revista Ciencias Agrícolas Informa. Facultad de Ciencias Agrícolas. Universidad Autónoma del Estado de México (UAEM). 19(1):5-11. [ Links ]
Escalante, E. J. A. S. y Rodríguez, G. Ma. T. 2011. Biomasa y rendimiento en haba en función de la densidad de población, nitrógeno y fósforo. Ciencias Agrícolas Informa. 20(1):16-25. [ Links ]
Hernández, R.; González, A. y Rivera, P. 2008. El cultivo de la canola (Brassica napus y B.rapa) en el estado de Jalisco, México. I. Características Agronómicas. Bioagro. 20(3):185-191. [ Links ]
Morris, H. D. 2004. Diet and risk of ischemic heart disease in India: J. Clinic Nutr. 79:582-592. [ Links ]
Morriso, M. J.; McVetty, P. B. and Shaykewick C. F. 1989. The determination and verification of a baseline temperature for the growth of Westar summer rape. Can. J. Plant Sci. 69:455-464. [ Links ]
Morrison, M. J. and Stewart, D. W. 2002. Heat stress during flowering in summer Brassica. Crop Sci. 42:797-803. [ Links ]
Muñoz, V. S.; Buzza, G. and Avalos, P. R. 2002. Performance of canola in southern Sonora, Mexico. In: Janick, J. and Whipkey, A. (Eds). Trends in new crops and new uses. ASHS Press. Alexandria, VA. 131-134 pp. [ Links ]
Olsson, G. 1960. Some relations between number seeds per pod, seed size and oil content and the effects of selection for these characters in Brassica and Sinapsis. Hereditas. 46:27-70. [ Links ]
Ortegón, M. A.; Díaz F. A. y Rodríguez, C. A. 2002. Rendimiento de híbridos de canola (Brassica napus L.) en diferentes métodos de siembra. Agr. Téc. Méx. 28:151-158. [ Links ]
Ortegón, M. A. S.; Díaz F. A. y Ramírez, de L. A. 2006a. Rendimiento y calidad de semilla de variedades e híbridos de canola en el norte de Tamaulipas, México. Rev. Fitotec. Méx. 29(2):181-186. [ Links ]
Ortegón, M. A. S.; Díaz F. A.; González, Q. J. y Garza, C. 2006b. La temperatura en la etapa reproductiva del cultivo de canola (Brassica napus L.). Agric. Téc. Méx. 32(3):259-265. [ Links ]
Panozzo, L. E.; Zuchi, J.; da Silva, F. D.; Barros, P. L.; Fernandes dos Santos, D. F. C.; Silva, B. W. and Omar, T. G.2014.Evaluation of some hybrids of canola in function of sowing dates in Viçosa, MG, Brazil. Afric. J. Agric. Res. 9. (32):2488-2494. [ Links ]
Pass, E. and Pierce, G. 2002. Canola oil national centre for agri- food research in medicine. St. Boniface General Hospital Research. Winninpeg, Manitoba, Canada. 1-18 pp. [ Links ]
Seyedmohammadi, N. S.; Allahdadi, I.; Seyedmohammadi, S. A. and Sarafraz E. 2011. Effect of different amounts and irrigation intervals on some agronomic characteristics of spring canola varieties (Brassica napus L.). Int. J. AgriSci. 1(1):26-31. [ Links ]
Snyder, R. L. 1985. Hand calculating degree days. Agric. Forest Meteorol. 35:353-358. [ Links ]
Starner, D. E.; Hamama, A. A. and Bhardwaj, H. I. 1999. Canola oil yield and quality as affected by production practices in Virginia. In: Perspectives on New Crop and New Uses. J. Janick (Ed). ASHS Press, Alexandria; VA: 254-256. [ Links ]
Servicio de Alimentación Agroalimentaria y Pesquera (SIAP). 2011. http://www.siap.gob.mx/aagricola_siap/ientidad/index.jsp. [ Links ]
Received: June 2016; Accepted: August 2016
 Este es un artículo publicado en acceso abierto bajo una licencia Creative Commons
