


Servicios Personalizados
Revista
Articulo
 texto en
  Inglés (pdf)
 Artículo en XML
 Referencias del artículo
 Enviar artículo por email
Indicadores
-
 Citado por SciELO
 -
 Accesos
Links relacionados
-
 Similares en
SciELO
Similares en
SciELO
Compartir

 Permalink
Revista mexicana de ciencias agrícolas
versión impresa ISSN 2007-0934
Rev. Mex. Cienc. Agríc vol.7 no.3 Texcoco abr./may. 2016
Articles
Aerodynamic characteristics of anti-insect mesh windows used in greenhouses in Mexico
1 Postgrado en Ingeniería Agrícola y Uso Integral del Agua-Universidad Autónoma Chapingo. Carretera México-Texcoco, km. 38.5. Chapingo, Texcoco Estado de México. C. P. 56230. Tel: 595 95 215 51. (ilopez@correo.chapingo.mx; ariasar_mx@yahoo.com.mx).
They were analyzed by tests microscopy and wind tunnel, geometric characteristics, porosity and pressure drop, respectively seven different meshes commonly used as physical barriers windowing Mexican greenhouses to determine its effect on the ventilation rate, permeability and the inertial factor. The meshes were analyzed in the Chapingo in May 2013 were: anti-thrips (M1), anti- thrips bicolor (M2), anti-aphid (M3), anti-aphid bicolor (M4), zenithal (M5), green-black windbreaker (M6) and anti-aphid white (M7), whose porosities were 0.36, 0.35, 0.47, 0.45, 0.54, 0.29 and 0.43 respectively. The geometry of the meshes is performed by measuring the areas of the pores with an optical microscope to determine the porosities and calculate the decrease in ventilation rate. Subsequently, the most important aerodynamic characteristics; i. e. inertial factor and permeability were determined using a wind tunnel to measure the relationship between the pressure drop caused by each mesh and the speed of the airf low. The results showed that the zenithal mesh (M5) has the least resistance to air flow with 21% decrease in ventilation rate, while the green- black windbreaker mesh (M6) was 50%. Greenhouses in Mexico typically use anti-aphid mesh with porosity between 0.43 and 0.47 for the side windows and zenithal type.
Keywords: inertial factor; permeability; porosity; pressure drop
Se analizaron mediante pruebas de microscopía y en túnel de viento, las características geométricas, porosidad y la caída de presión, respectivamente de siete diferentes mallas comúnmente usadas como barreras físicas en ventanas de invernaderos mexicanos para determinar su efecto sobre la tasa de ventilación, la permeabilidad y el factor inercial. Las mallas se analizaron en la Universidad Autónoma Chapingo en mayo de 2013 y fueron: anti-trips (M1), anti-trips bicolor (M2), anti-áfidos (M3), anti-áfidos bicolor (M4), cenital (M5), rompevientos verde-negro (M6) y anti-áfidos blanca (M7), cuyas porosidades fueron 0.36, 0.35, 0.47, 0.45, 0.54, 0.29 y 0.43 respectivamente. La geometría de las mallas se realizó midiendo las áreas de los poros con un microscopio óptico, para determinar las porosidades y calcular el descenso de la tasa de ventilación. Posteriormente, las características aerodinámicas más importantes; es decir, permeabilidad y factor inercial, se determinaron usando un túnel de viento para medir la relación entre la caída de presión causada por cada malla y la velocidad del flujo de aire. Los resultados mostraron que la malla cenital (M5) presenta la menor resistencia al flujo de aire con 21% de descenso en la tasa de ventilación, mientras que la malla rompevientos verde-negra (M6) fue de 50%. Los invernaderos en México normalmente usan la malla del tipo anti-áfidos con porosidad entre 0.43 y 0.47 para las ventanas laterales y cenitales.
Palabras clave: caída de presión; factor inercial; permeabilidad; porosidad
Introduction
The production of vegetables in protected environments of the humid tropics and in warm climates, is vulnerable to climatic stress (high values of temperature and humidity), pests and viral diseases transmitted by them (Von Zabeltitz, 2011). The use of plastic mesh in windows greenhouses, macrotunnels and mesh-shade is recommended to prevent serious damage to crops caused by insects (Romero-Gómez et al., 2010). Its main function is to act as a physical barrier that prevents the entry of insects into the greenhouse and therefore, a low incidence of diseases, minimizing the need for phytosanitary treatments (Alvarez et al., 2006). The use of nets is widespread, but have a negative influence by lowering the rate of natural ventilation, and therefore increase the temperature and humidity within protected environments (Valera et al., 2006).
The efficiency of these screens depends mainly on the size of the mesh (must be less than thoracic diameter of the smallest insect you want to exclude), its cross section and optical properties (such as color) (Teitel, 2007; von Zabeltitz, 2011; Castilla, 2013). The porosity of the mesh is the ratio of pore area and total area; it depends on the wire diameter and the number of threads per unit area, and determines the reduction in the rate of natural ventilation (Castilla, 2013).
Because of this resistance air velocity, temperature and humidity inside the greenhouses are modified (Fatnassi et al., 2003) and light transmission (von Zabeltitz, 2011) is reduced, adversely affecting the growth and development crop, and favoring the onset of disease (Teitel et al., 2008). Meshes normally used in greenhouses ventilation rate decreased about 40% by anti-insect mesh, and 70-80% in anti-trips meshes (Montero and Anthony, 2000), although this decrease can be higher if the wind speed it is very low (Castilla, 2013).
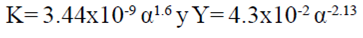
To analyze the flow characteristics of air through the meshes usually employed in greenhouses is important to determine its permeability (K, m2) and inertial factor (Y, dimensionless), two key parameters to model the air flow through a porous medium. Thus, Miguel et al. (1997) and Miguel et al. (1998) evaluated different meshes in a wind tunnel and found that the best correlations with porosity are those of the equation (1):
 1)
1)
Where: α= porosity of the mesh (m2 m-2).
Meanwhile, Valera et al. (2005) studied 11 meshes in a wind tunnel and found the following correlations (Equation 2):
 2)
2)
In studies Miguel et al. (1997), Miguel et al. (1998) and Valera et al. (2005), the pressure drop was plotted as a function of air velocity before the mesh, and second-degree polynomial was f itted to the measured curve to calculate the permeability and the inertial factor (Teitel, 2010). In this regard, Flores-Velázquez and Montero (2008) proposed different relationships for K and Y (Equation 3), based on data published by Miguel et al. (1997), Teitel (2001) and Valera et al. (2006).
 3)
3)
When the Navier-Stokes equations are solved numerically in simulations of computational fluid dynamics (CFD), the source term in the momentum equation is represented by the Forchheimer equation. Different authors (Campen y Bot, 2003; Fatnassi et al., 2003; Molina-Aiz et al., 2004) used this approach to determine the values of K and Y.
The aim of the study was analyzed by microscopic and wind tunnel measurements, porosity and pressure drop, respectively, of seven commercial meshes commonly used in windows mexican greenhouses, to determine its effect on ventilation rates, permeability and the inertial factor each.
Materials and methods
Experimental site
The study was conducted in laboratories Energy DIMA and Engineering Laboratory Timber DICIFO of Autonomous University Chapingo (UACH) in Chapingo, Mexico during 2013. The microscopic measurements of pore geometry of different meshes with a light microscope (Leica Microsystems Model DM500) were performed. And experimental tests in a wind tunnel C15-10 (Armfield Inc. NJ, USA) to determine the pressure drop in different meshes.
Geometrical characterization of mesh
Selection and preparation of samples. Samples of anti-trips meshes (M1), anti-thrips bicolor (M2), anti-aphid (M3), anti-aphid bicolor (M4), zenithal (M5), green-black windbreaker (M6) and anti- aphids (M7) were selected randomly in new products marketed by manufacturers of plastic fibers and builders of greenhouses in Mexico. The sample preparation consisted of placing a small rectangular portion of each mesh analyzed over the entire surface of a microscope slide, held by transparent tape. Thus, the mesh is adjusted to a plane and ensures that the region scanned is the same for all samples. Five randomly selected surfaces of each mesh were analyzed. Areas of each sample were taken 2.5 mm2 with a target to 4 x an optical microscope (Leica Microsystems model DM500) and a camera Leica ICC50 3MP.
Image processing. The Leica Application Suite (LAS) EZ software used to simplify camera control, image capture, annotation, measurement and documentation. The digitized samples were converted to grayscale images to black and white. After marking measurements with the mouse pointer inside the pore in both vertical and horizontal direction for dimensions thereof and, at the edges of the wire to determine its diameter they were performed (Figure 1).
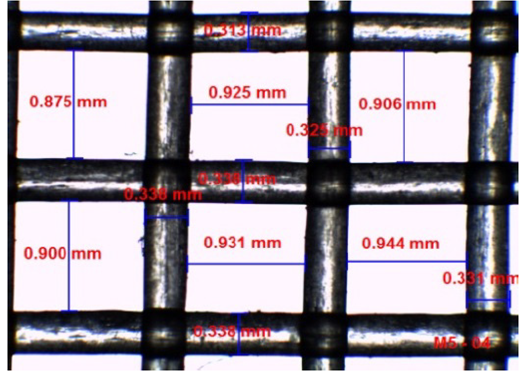
Geometric analysis methodology widely used in various jobs reported on anti-insect mesh geometric characterization was selected (Cabrera et al., 2006; Alvarez et al., 2012). By taking digital images of samples using an optical microscope. The geometric base is considered that each hole (pore) of the mesh represents a parallelogram is defined by four monofilament yarns that are interwoven together to form the net or mesh. Finally, the porosity is determined based on the relationship between the pore area and the total area of mesh.
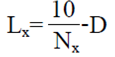
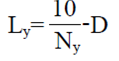
Number of threads per unit length. According to Cabrera et al. (2006), it is considered that the meshes anti-insects commonly used in greenhouses typically are manufactured with one type of thread of constant diameter D (mm), and knowing the number of threads cm-1 in both directions X and Y (NX, NY), the average pore size in both directions LX (mm) and LY (mm) can be calculated using equations (4) and (5):
 4)
4)
 5)
5)
Álvarez et al. (2012), extending its analysis meshes can have a wire diameter different in the directions of the weft and warp, proposed that the number of threads per unit length (wire cm-1) in the directions frame (ρx) and warp (ρy) of the mesh is calculated using equations (6) and (7):
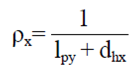 6)
6)
 7)
7)
Where: lpy and lpx= the characteristics of the pores of the mesh size; dhx and dhy= thickness of the threads of the warp and weft, respectively.
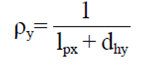
Calculation of the porosity. The separation of the strands forming a mesh fabric anti-insect defines a porous matrix of rows and columns of pores. This can be observed by a microscope as a flat surface. One of the most important geometrical properties of these materials is their porosity α (m2 m-2) defined as the area occupied by the holes with respect to the total area of the mesh (Cabrera et al., 2006; Valera et al., 2006; Alvarez et al., 2012) and can be calculated by equation (8) for a mesh with the same type of thread in both directions of fabric.
 8)
8)
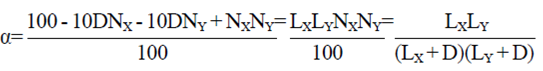
Reducing ventilation rate. Reducing ventilation rate (R, %), which cause the nets used in protected environments windows can be determined through empirical equation (9) given by Pérez-Parra et al. (2004).
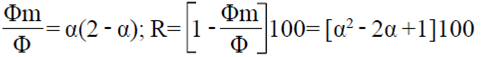 9)
9)
Where: Φ= volumetric flow of air through a mesh window (m3 s-1); Φm = volumetric flow of air through a window without mesh (m3 s-1).
Aerodynamic characterization of the mesh. The wind tunnel C15-10 (Armfield Inc. NJ, USA), which has a working section in transparent acrylic material (150 mm x 150 mm x 455 mm) and fan (Ziehl-Abegg model was used THCL155 IP54 ) alternating current (AC) controlled by inverter which allows precise control of the air speed up to 34 m s-1 free of obstacles. The air flows through the working section driven by a variable speed fan located at the end of the tunnel exit. Incorporates a honeycomb straightener flow at the inlet, and the shrinkage ratio of 9.4:1 ensures a continuous flow of air through the working section.
Preparation and installation of wind tunnel samples. The samples used in the wind tunnel were cut and placed on a metal frame. The frame is constructed with aluminum the same dimensions as the cross section of the wind tunnel (150 mm x 150 mm) in the work area. The meshes were placed and tightened by a clamping device around the perimeter of the frame to simulate placed in greenhouses. The samples were installed in the central part of the working section of the wind tunnel for testing.
Operation of the wind tunnel. Once installed the sample of the mesh in the working section of the wind tunnel, the electronic pressure sensor (0 - 178 mm H2O) was installed on the wall of the working section before and after the mesh, to perform measurements of the static pressure and air velocity. The wind tunnel operation was carried out using the Armfield IFD7 interface, which allows the connection of wind-tunnel personal computer. Using the computer program C15-304 fan control it was carried out in the wind tunnel, including power and control of the rotation speed between 0 to 100% (de 0 a 34 m s-1) to display and record all data presented inside the wind tunnel. After the test the speed of rotation was reduced gradually to 0% to turn off the fan.
Data register. Measurements of static pressure and air velocity during the tests were recorded in a spreadsheet for further analysis, it was considered a sampling time of 2 min for each 1% increase in the rotational speed of the fan.
Algorithm to calculate the pressure drop. Miguel et al. (1997) analyzed the airflow through meshes using equations of flow in porous media. For steady state, the f low of incompressible fluid through a porous material, the pressure drop can be expressed by equation Forchheimer (10):
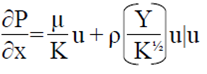 10)
10)
Where: μ= dynamic viscosity (kg m-1 s-1); u= Air velocity (m s-1); ρ= Air density (kg m-3); K and Y = permeability and the inertial factor of the grid respectively.
Experimentally it is possible to determine the aerodynamic characteristics (permeability K and inertial factor Y) of the meshes using the following procedure:
Step 1. Data pressure and air velocity measured in the wind tunnel are arranged in a matrix of two columns (pressure and speed) and n rows (number of data) to be graphed (pressure drop against air velocity) and adjust to a model or second- degree polynomial.
Step 2. Using the graphical interface tool MATLAB curve fitting (cftool, Curve Fitting Tool) data MATLAB workspace tool to imported cftool.
Step 3. The data is graphically explore later adjust using a parametric model of second degree (ΔP=AV2+BV+C), the library cftool and generate statistics.
The second degree model is related Forchheimer equation as follows:
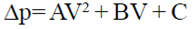 11)
11)
In which the coefficients (A and B) can be calculated according to equation (11).
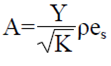 12)
12)
 13)
13)
From (13) it is possible to calculate the permeability using the equation (14).
 14)
14)
Similar procedure is followed for Y with the equation (15).
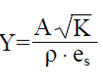 15)
15)
The specific permeability of the medium represents the ability to allow the passage of a fluid through and is dependent on the viscosity and the frequency of contact with the solid walls. The drag coefficient (Y) is influenced by the nature of the medium, in this case porous, defining said inertial factor. An air density of (ρ)= 1.204 kg m-3 and a dynamic viscosity (μ)= 1.7894 x10⁻⁵ [Kg m-1 s-1], both for use in Equations 12, 13, 14 is assumed and fifteen.
Statistic analysis
To determine the statistically significant difference for meshes regarding porosity ANDEVA where seven samples were considered five repetitions was performed. The data obtained in average geometric and aerodynamic characteristics comparison tests were performed Tukey (p≤ 0.05) using the statistical package SAS 9.2 (SAS, 2009). The data obtained from aerodynamic characteristics were analyzed using the cftool tool Matlab program to generate the linear regression models of second grade and adjust to the results of the pressure drop and air velocity (0-4ms-1, 0-6ms-1 y 0-8ms-1),where your best fit was evaluated based on the root mean square error (RMSE), sum of squares due to error (SSE) and coefficient of determination (R2).
Results and discussion
Geometric characteristics of the meshes
In the Table 1 average diameter thread lengths in both directions of the pores, the porosity and reduced ventilation rate for seven screens shown studied. Porosity presented four groups together, highlighting the anti-trips meshes M1 and M2; the anti-aphid M3, M4 and M7; the zenithal M5 and windbreaker M6, obtaining significant differences between types of mesh. The zenithal was the most porous mesh; i.e. presents less resistance to air f low passing through it. This type of mesh is placed in the greenhouse zenithal windows because there high air velocity, which does not allow the flow of insects into the greenhouse is presented.
Table 1 Geometrical characteristics typical of Mexican greenhouses meshes.
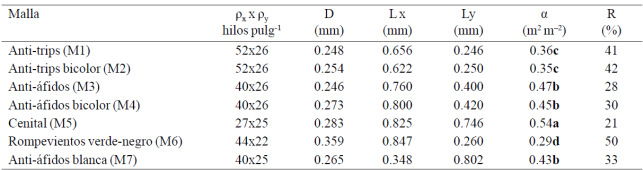
Medias con distinta letra en una hilera son estadísticamente diferentes (Tukey, p≤ 0.05). ρx y ρy= número de hilos por pulgada cuadrada en la dirección x y y; D= diámetro de hilo; Lx y Ly= longitud en la dirección x y y del poro; α= porosidad; R= reducción de la tasa de ventilación.
Romero-Gomez et al. (2010) mention that when zenithal windows are located downwind although some act as air inlets, the remaining function as vents; the air entering through the zenith provides little aeration vents in the area of plants, however high speed air just develops on top of the greenhouse. This phenomenon occurs due to the geometric characteristics of the mesh used in greenhouses windows. Greenhouses in Mexico typically use anti-aphid mesh with porosity between 43 and 47% for the side windows and zenithal type.
Moreover, the meshes are more resistant windbreaker and anti-thrips. The first aim to reduce the harmful effects to the culture by high mechanical action of wind f lows, reducing its speed in the greenhouse; the latter are used in side windows to prevent serious damage to crops caused by insect pests of small size, particularly designed to prevent the entry of Thrips (eg, Frankliniella occidentalis). The anti-aphid nets are the most used in Mexican greenhouses because they are designed to prevent the entry aphid (Aphis gossypii) and whitef lies (eg Bemisia argentifolii, Trialeurodes vaporariorum, B. tabaci) (Teitel, 2007; Romero-Gomez et al., 2010) which are the main transmitters of viral diseases insects.
Aerodynamic characteristics of the meshes. In the Figure 2 shows the complete behavior of the pressure drop as a function of the airspeed produced in the wind tunnel rotation speed of the fan 0 to 100%. The mesh green-black windbreaker, was the least porous, presented a pressure drop of 459.9 Pa and reached a maximum speed of 8.5 m s-1 in the wind tunnel. Unlike the zenithal mesh was the most porous, presented a pressure drop of 371.7 Pa achieving greater air velocity of 15.9 m s-1 in the tunnel. The downtown area of Mexico has an average maximum wind speed of 8.1 m s-1, registered in the Mexico City International Airport, D. F., in February during the period 2001-2008.
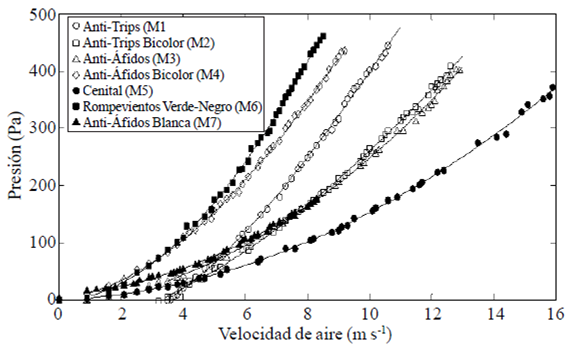
Taking into account the maximum wind speed that can occur in the Valley of Mexico, the analyzes were performed at air speeds in the wind tunnel between f lows from 0 to 4 m s-1, 0 to 6 m s-1 and of 0 to 8 m s-1. Similarly, Romero-Gomez et al. (2010) analyzed anti-insect screens at speeds up to 0 to 4 m s-1, and in turn Valera et al. (2006) air f low rates up to 7 m s-1.
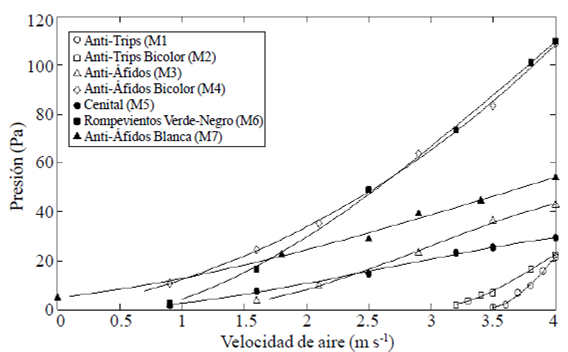
In the Figure 3 shows the relationship between pressure drop and air velocity of 0 to 4 m s-1 for the analyzed meshes. According to the statistical analysis, two groups with speeds up to 4 m s-1, where the meshes M1, M2 and M6 have a pressure drop average of 20.44 Pa, 21.46 Pa y 40.54 Pa respectively were obtained. M3, M4, M5 and M7 meshes with average pressure drop 14.09 Pa, 14.67 Pa, 9.04 Pa y 14.33 Pa respectively, no statistically significant differences.
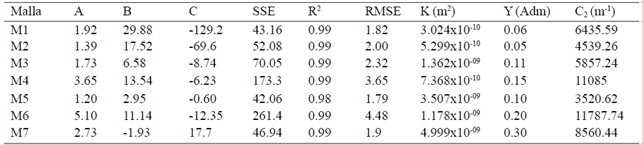
The Table 2 shows the coefficients A, B and C, best-fit result of the pressure drop depending on the air velocity of 0 - 4 m s-1, and K, Y and C2 calculated according to Equations 14, 15 and 16.
Table 2 Coefficients valid for air velocity 0 to 4 m s-1.
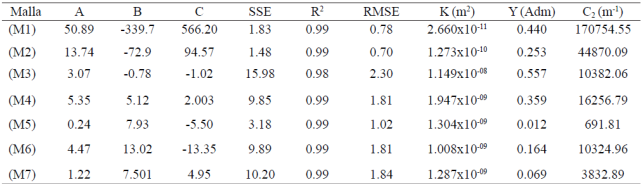
Coeficientes A, B y C para el mejor ajuste de la ecuación (ΔP = Au 2 + Bu + C); RMSE= raíz del error cuadrático medio; SSE= suma de los cuadrados debido al error; R2= coeficiente de determinación; K permeabilidad; Y= factor inercial; C2= coeficiente de perdida inercial.
For the flow of air velocity from 0 to 6 ms-1, the pressure drop measured in the wind tunnel (Figure 4), divided into two statistically different categories based on the Tukey test: 1) in the first group, M4 and M6 mesh (average pressure drops 120.05 and 134.28 Pa, respectively); and 2) in the second group, M1, M2, M3, M5 and M7 (average pressure drop 50.08 Pa, 39.06 Pa, 51.85 Pa, 33.82 Pa, 60.91 Pa, respectively).
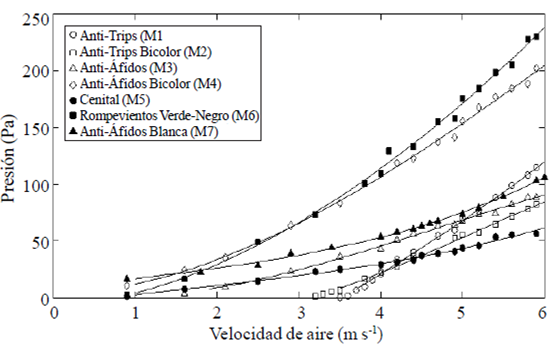
Figure 4 Pressure drop calculated as a function of air velocity (0 to 6 m s-1) for the seven anti-insect mesh.
The coefficients A, B and C of the quadratic polynomial obtained from best fit curves pressure drop against air velocity in the f low of 0 - 6 m s-1, and K, Y and C2 calculated according to equations 14, 15 and 16, are presented in Table 3.
Table 3 Coefficients valid for air velocity of 0 to 6 m s-1.
Coeficientes A, B y C para el mejor ajuste de la ecuación (ΔP = Au2 + Bu + C); RMSE= raíz del error cuadrático medio; SSE= suma de los cuadrados debido al error; R2= coeficiente de determinación; K permeabilidad; Y= factor inercial; C2= coeficiente de perdida inercial.
Figure 5 shows the curves of pressure drop as a function of air velocity of 0 to 8 m s-1, which is grouped into three categories where significant differences. The first group was composed of meshes M4 and M6 with average pressure drops of the 88.86 Pa and 216.55 Pa, respectively; the second group was composed of M1 and M7 with a pressure drop Average 111.69 Pa and 91.95 Pa, respectively; and the third group consisted of M2, M3 and M5 with average pressure drop 76.79 Pa, 83.46 Pa and 53.36 Pa, respectively.
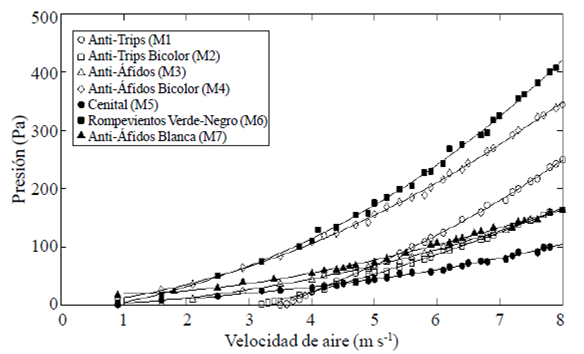
Figure 5 Pressure drop calculated as a function of air velocity (0 to 8 m s-1) seven anti-insect mesh.
In the Table 4 presents the coefficients A, B and C, resulting regression model for the analyzed second degree meshes, valid for air velocities of 0-8 m s-1; coefficients K, Y and C2 are also presented, calculated with equations 14, 15 and 16, for the seven analyzed meshes. The results are similar to those recorded by Alvarez et al. (2006), since in their sample 6 and the M6 the present study are similar in porosity value, to obtain a value of 20% in K and 21% higher in Y.
Table 4 Coefficients valid for air velocity of 0 to 8 m s-1.
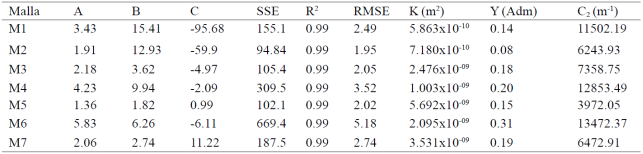
Coeficientes A, B y C para el mejor ajuste de la ecuación (ΔP = Au 2 + Bu + C); RMSE= raíz del error cuadrático medio; SSE= suma de los cuadrados debido al error; R2= coeficiente de determinación; K permeabilidad; Y= factor inercial; C2= coeficiente de perdida inercial.
Conclusions
The geometric analysis identified seven porosities meshes in order to estimate the reduction in the ventilation rate. The porosity of the mesh ranged from 0.29 to 0.54, for a theoretical reduction in the ventilation rate values between 21 and 50%, respectively. Aerodynamic characteristics of the meshes analyzed are affected by the air f low rate, obtaining average values of permeability (2.186 x 10-09) and inertial factor (0.194). At speeds less than 4 m s-1 meshes shown two groups with significant difference. a) anti-thrips and windbreaker; and b) anti-aphid and zenithal . At speeds 6 to 8 ms-1 there were three categories with significant differences. a) windbreaker; b) anti-thrips; and c) anti-aphid and zenith.
Literatura citada
Álvarez, A. J.; Valera, D. L. and Molina-Aiz, F. D. 2006. A method for the analysis of the geometric characteristics of protection screens. Acta Hortic. 719:557-564. [ Links ]
Álvarez, A. J.; Oliva, R. M. and Valera, D. L. 2012. Software for the geometric characterization of insect-proof screens. Comp. Electr. Agric. 82:134-144. [ Links ]
Cabrera, F. J.; López, J. C.; Baeza, E. J. and Pérez-Parra, J. 2006. Efficiency of anti-insect screens placed in the vents of Almería greenhouses. Acta Hortic. 719:605-614 [ Links ]
Campen, J. B. and Bot, G. P. A. 2003. Determination of greenhouse specific aspects of ventilation using three dimensional computational fluid dynamics. Bios. Eng. 84(1):69-77. [ Links ]
Castilla, N. 2013. Greenhouse technology and management. CABI. Second Edition. Boston, MA, USA. 143 p. [ Links ]
Fatnassi, H.; Boulard, T. and Bouirden, L. 2003. Simulation of climatic conditions in full-scale greenhouse fitted with insect-proof screens. Agric. For. Meteorol. 118(1):97-111. [ Links ]
Flores-Velázquez, J. and Montero, J. I. 2008. Computational fluid dynamics CFD study of large scale screenhouses. Acta Hortic. 797:117-122. [ Links ]
Miguel, A. F.; Van de Braak, N. J. and Bot, G. P. A. 1997. Analysis of the airflow characteristics of greenhouse screening materials. J. Agric. Eng. Res. 67(2):105-112. [ Links ]
Miguel, A. F.; Van de Braak, N. J.; Silva, A. M. and Bot, G. P. A. 1998. Physical modeling of natural ventilation through screens and windows in greenhouses. J. Agric. Eng. Res. 70(2):165-176. [ Links ]
Molina-Aiz, F. D.; Valera, D. L. and Álvarez, A. J. 2004. Measurement and simulation of climate inside Almeria-type greenhouse using computational fluid dynamics. Agric. For. Meteorol. 125(1):33-51. [ Links ]
Montero, J. I. and Antón, A. 2000. Buoyancy driven ventilation in tropical greenhouses. Acta Hortic. 534:41-55. [ Links ]
Pérez-Parra, J.; Baeza, E.; Montero, J. I. and Bailey, B. J. 2004. Natural ventilation of parral greenhouses. Biosystems Eng. 87(3):355-366. [ Links ]
Romero-Gómez, P.; Choi, C. Y. and Lopez, C. I. L. 2010. Enhancement of the greenhouse air ventilation rate under climate conditions of central Mexico. Agrociencia. 44(1):1-15. [ Links ]
SAS Institute. 2009. SAS user’s guide. Statistics. Version 8. SAS Inst., Cary, NC. USA. Quality, and elemental removal. J. Environ. Qual. 7886p. [ Links ]
Teitel, M. 2001. The effect of insect-proof screens in roof openings on greenhouse microclimate. Agric. For. Meteorol. 110(1):13-25. [ Links ]
Teitel, M. 2007. The effect of screened openings on green house microclimate. Agric. For. Meteorol. 143(3):159-175. [ Links ]
Teitel, M. 2010. Using computational fluid dynamics simulations to determine pressure drops on woven screens. Bios. Eng. 105(2):172-179. [ Links ]
Teitel, M.; Liron, O.; Haim, Y. and Seginer, I. 2008. Flow through inclined and concertina-shape screens. Acta Hortic. 801:99-106. [ Links ]
Valera, D. L.; Molina-Aiz, F. D.; Álvarez, A. J.; López, J. A.; Terres- Nicoli, J. M. and Madueno, A. 2005. Contribution to the characterization of insect-proof screens: experimental measurements in wind tunnel and CFD simulations. Acta Hortic. 691:441-448. [ Links ]
Valera, D. L.; Álvarez, A. J. and Molina, F. D. 2006. Aerodynamic analysis of several insect-proof screens used in greenhouses. Spanish J. Agric. Res. 4(4):273-279. [ Links ]
Von-Zabeltitz, C. 2011. Integrated greenhouse systems for mild climates: climate conditions, design, construction, maintenance, climate control. Springer. New York. USA. 233-250 pp. [ Links ]
Received: December 2015; Accepted: March 2016
 Este es un artículo publicado en acceso abierto bajo una licencia Creative Commons
