


Servicios Personalizados
Revista
Articulo
 texto en
  Inglés (pdf)
 Artículo en XML
 Referencias del artículo
 Enviar artículo por email
Indicadores
-
 Citado por SciELO
 -
 Accesos
Links relacionados
-
 Similares en
SciELO
Similares en
SciELO
Compartir

 Permalink
Revista mexicana de ciencias agrícolas
versión impresa ISSN 2007-0934
Rev. Mex. Cienc. Agríc vol.7 no.1 Texcoco ene./feb. 2016
Articles
Design and development of a Hellmann-type semiautomatic pluviograph
1Universidad Autónoma del Estado de México-Centro Universitario Texcoco. Av. Jardín Zumpango s/n, Fracc. El Tejocote Texcoco, México, C. P. 56259. Héroes de Chapultepec 30, Col. Jardín de los Reyes. C. P. 5600, La Paz, Estado de México. (ozieluz@gmail.com; joelayala2001@yahoo.com.mx).
The construction of a semiautomatic pluviograph with low-cost materials equivalent to a Hellmann-type with siphon is proposed with the objective of acquiring pluvial precipitation (Pp) data. The development of a software application is presented for the analysis and presentation of the data. In order to automate the pluviograph, an electronic system was built based on a liquid level sensor, a time control module, and a microcontroller for an Arduino system. The system stores the data in a microSD flash memory card. The software is coded in Java and allows for the interpretation of the information captured by the electronic circuit, to consult the data registered by the pluviograph, to display tables with the description of each rain event (storm) and to generate graphs as pluviographs and hyetographs. In the test period of this prototype, a 90% accuracy was confirmed in the total measurements, which allows the use of the device in domestic and professional fields where precipitation readings are required.
Keywords: arduino; hyetographs; java; pluviographs; precipitation
Se plantea la construcción de un pluviógrafo semiautomático con materiales de bajo costo equivalente a uno tipo Hellman de sifón, con el objetivo de adquirir los datos de la precipitación pluvial (Pp). Se presenta el desarrollo de una aplicación de software para el análisis y presentación de los datos. Para automatizar el pluviógrafo se construyó un sistema electrónico con base en un sensor de nivel de líquidos, un módulo de control del tiempo y un microcontrolador de un sistema arduino. El sistema almacena los datos en una tarjeta de memoria flash microSD. El software se codificó en lenguaje de programación Java y permite interpretar la información captada por el circuito electrónico, realizar consultas de los datos registrados por el pluviógrafo, desplegar tablas con la descripción de cada evento de lluvia (tormenta) y generar gráficas como pluviogramas e hietogramas. En el periodo de pruebas de este prototipo se comprobó una precisión de 90% en el total de las mediciones lo que permite el uso del dispositivo en ámbitos domésticos o profesionales donde se requiera la lectura de la precipitación.
Palabras clave: arduino; hietogramas; java; pluviogramas; precipitación
Introduction
Pluvial precipitation (Pp) is any type or state of water that falls on the surface of the ground. Measurement of the Pp quantity is done in order to obtain information on spatial and temporal characteristics, such as intensity, frequency, phase, duration and quantity. The precipitation can be measured through pluviometers or pluviographs. A pluviometer registers information solely on the quantity of rain, whereas a pluviograph creates a hyetograph, a graph that registers the quantity of Pp in relation to time. The Pp can be reported as a sheet of rain (Lp) in a period of time (tp) or rather, as rain intensity (I). The Lp is reported in mm of rain, where 1 mm of rain is equivalent to 1 L of water having fallen in 1 m2.
The problem with the extraction of information from pluviographs is that it has to be interpreted by an expert or someone who has had previous training, and the information is not accurate in signaling the time at which the rain starts.
The pluviograph is designed to determine the rain intensity during long periods of time. These types of measurements are utilized in hydrological, meteorological, climatological, and agricultural studies, among others. Determining the spatial and temporal distribution of precipitation helps to propose policies for flood planning and in general to mitigate the impact of extreme precipitation Vannitsem and Naveau (2007). The development of technology that directly aids in studies regarding the use of water is essential for the development of sustainable agriculture, to increase productivity and to improve product quality.
The pluviograph is an invention from the XIX century; however, the first patent was for the floater pluviograph presented by Chappell in May 1938 (Chappell and Colt, 1938). On April 1966, the first pluviometer with graphic registry and automatic measurements was patented by Barker (Barker, 1966).
There have been research papers where the automation of one of the three types of pluviographs has been proposed. In Méndez et al. (2013), the automation of a balance pluviograph is presented, developed in the Centro de Investigaciónes Hidráulicas (CIH, Center of Hydraulic Investigations in English) in Habana, Cuba, driven by the needs for the development of hydraulic activities in the country. With regard to the automation of Hellmann-type pluviographs with siphon, Sandoval et al. (2010) shows the implementation of an electronic system to compile Pp data making use of a wireless communication system and a software application for the control, storage and analysis of the data.
The measurement of the rain intensity by traditional pluviographs utilizes a clockwork mechanism that moves the drum in which a roll of paper is placed to record the rainfall instantaneously with a pen. The roll of paper is subsequently known as a hyetograph (Figure 1).

Obtaining information shown in a hyetograph is a job that has been sought to be optimized for a long time. Sansom (1987) proposed a method to digitalize the information generated by the pluviographs of the time. Currently, Delitala et al. (2010) exhibits the development of a software developed at the University of Cagliari, Italy, based on image treatment techniques capable of processing graphs from pluviographs, and automatically processing the signal and producing a database with registries of continuous precipitations with a 5 to 10 minute resolution. The objective of this work, beyond that of developing a technique to facilitate the interpretation of the information from the pluviographs, was to create a historical registry of the precipitations of the past century with the purpose of improving the historical characterization of the region's climate.
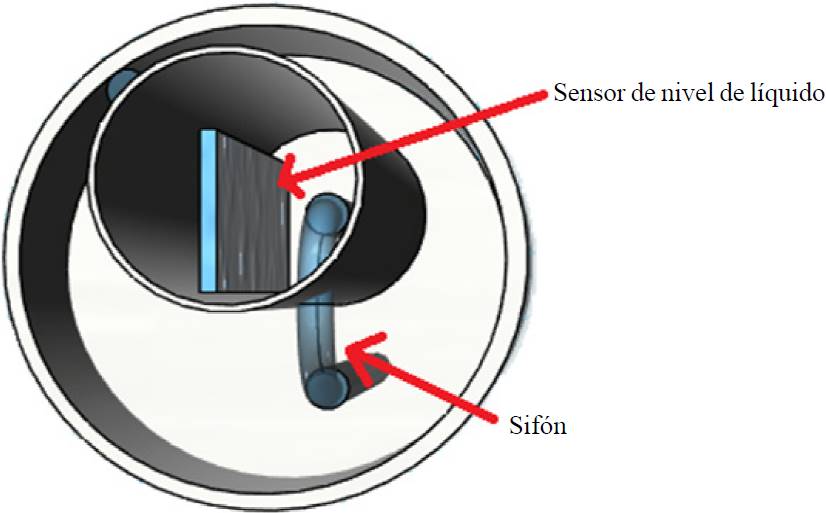
The pluviograph prototype was designed and assembled, first creating a siphon chamber which consists of a PVC tube 40 mm in diameter. The siphon system was constructed with a crystal tube in a U-shape inverted with one side in the siphon chamber and the other side, which must be longer, reaches a container in which the Pp is collected after being measured. The collector is the base of the instrument, above it the siphon chamber is placed and within this chamber the liquid level sensor is inserted. The siphon chamber must be covered to isolate it from the exterior and above it the capturing chamber is fitted, where the Pp instrument with a diameter of 16 cm is inserted; this being the upper part of the pluviograph.
The operation of the electronic circuit is described in the block diagram in Figure 3 and is comprised of a eTape Millone liquid level sensor, which is a solid state variable resistance sensor with the liquid level being present in the container where it is installed. The exit is inversely proportional to the liquid level (Technologies, 2013). In order to control the sensor an Arduino chip is used, which is a free hardware platform based on an electronic plate with 6 analogous inputs and 14 digital inputs/outputs, an Atmel microcontroller, all within an integrated development environment for the programming of the microcontroller (Wilcher, 2012). In order to store the information generated by the sensor, a microSD memory card should be connected to the microcontroller by means of a microSD shield, which is a plate that communicates the Arduino with the microSD card (Banzi, 2011). In order to keep control of time, a DS1307 sensor is utilized. For user interaction, an LCD screen is installed with a capacity to show 32 characters in two rows.

As a fundamental part of this instrument, a program was developed to interpret the data processed by the electronic system. The first phase of this process was to determine a methodology to submit the development process of the program. The Agile methodologies for software development are characterized due to their focus on factors such as the human factor or the software product (Reingart, 2012). For the development of this work, the Personal Software Process (PSP) methodology was chosen due to its focus on the management of the programmers' individual work (von Konsky et al., 2011). The PSP is a methodology that consists of a group of disciplined practices for time management (Salinas et al., 2011) and improvement of the personal productivity of the programmers or software engineers regarding software development tasks (Rodríguez, 2013).
The structure of the PSP process comprises the following phases: requirement analysis, planning, design, codification, compiling, tests and post-mortem (Watts, 1994). The methods used by this methodology have been introduced in a series of seven versions, and each one introduces new elements which are registered in various formats. In this work, the script version PSP0 was utilized which has four forms: PSP0 Project Plan Summary, PSP0 Time Recording Log, PSP0 Defect Recording Log, and PSP0 Defect Type Standard. It is utilized to defy standard defect types (Chávez and Hoyos, 2013).
The final software product is comprised by the components shown in Table 1.
Table 1. Software components of the system.
| Componente | Tecnología empleada | Propósito |
|---|---|---|
| Software principal | Java | Permite comunicar a la computadora y el usuario para que éste pueda llevar un sencillo control de la información. |
| Reportes gráficos | JFreechart | Su objetivo es presentar información en forma de gráficas. |
| Reportes en formato Excel | Apache POI (librería de código en JAVA) | Permite al usuario trasladar a hojas de cálculo la información referente a los eventos de lluvia. |
| Reportes en formato PDF | iText | Permite al usuario generar un documento portátil con la información obtenida por el sistema. |
| Software de microcontrolador | Arduino | Procesa y almacena todas las lecturas del instrumento. |
The electronic circuit permits communication with the user through the LCD screen and the buttons that allow for the adjustment of the date and time in which the measurement of the quantity of pluvial precipitation is to begin (Figure 4).
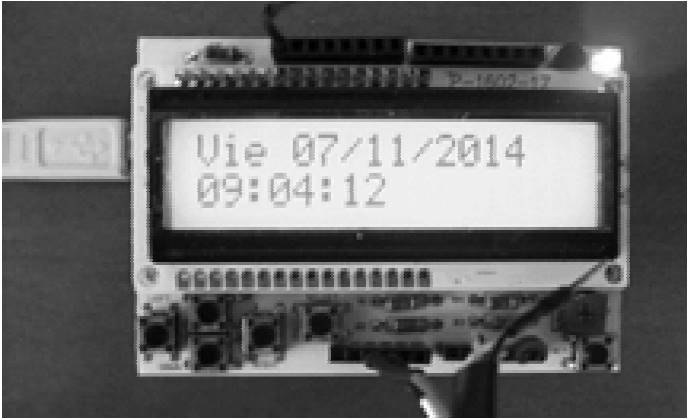
Table 2 shows the cost of each element that comprises the constructed structure.
Table 2. Costs of the instrument.
| Elemento | Costo (en pesos) |
|---|---|
| Estructura PVC con sistema de sifón | $1 000.00 |
| Placa arduino Uno | $400.00 |
| Sensor de nivel de liquidos eTape Millone | $850.00 |
| RealTime clock DS1307 | $120.00 |
| MicroSD Shield para Arduino | $240.00 |
| Pantalla LCD | $280.00 |
| Costo total | $2 890.00 |
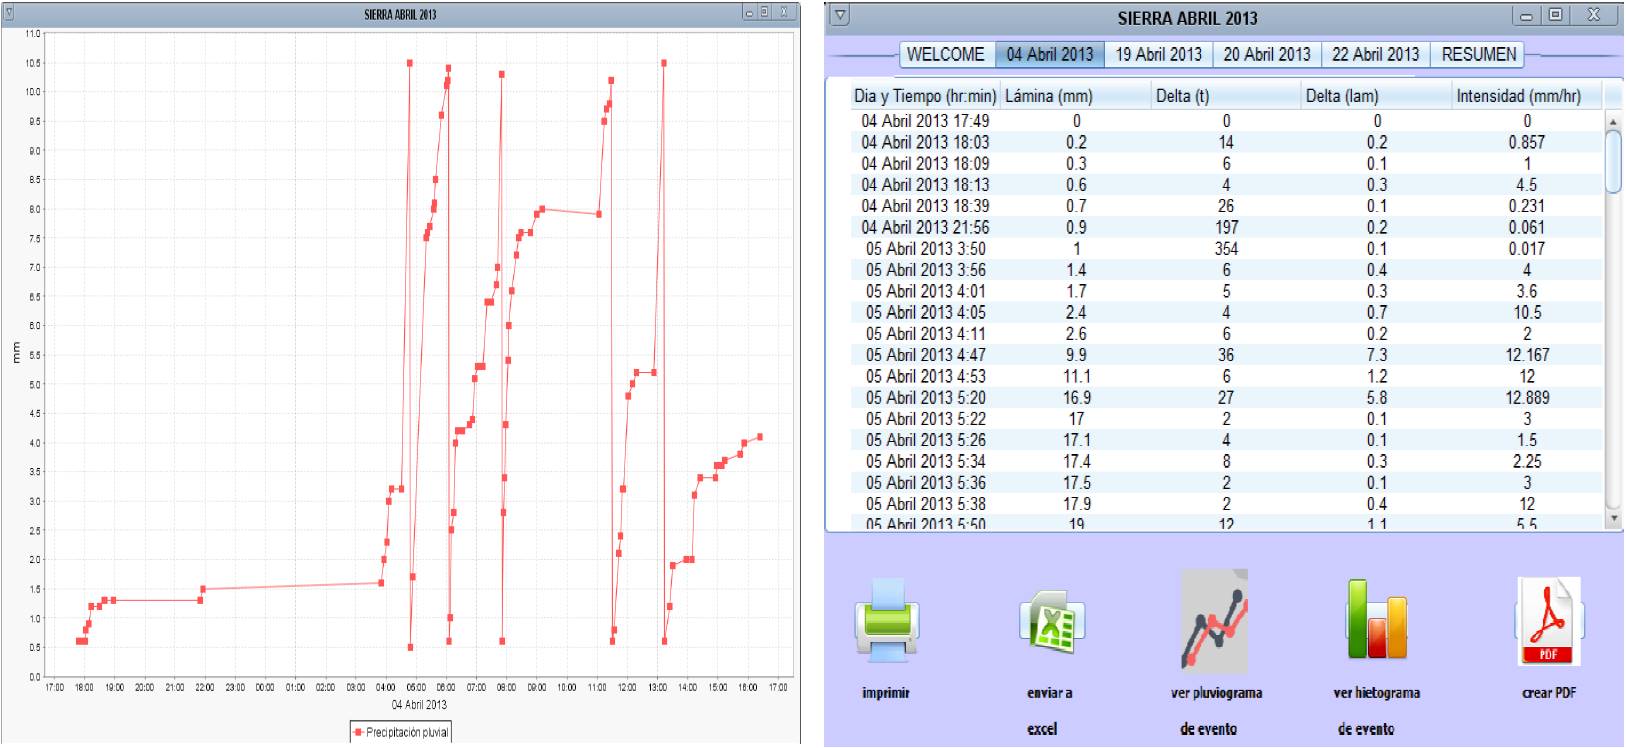
The software developed for this instrument can be executed on portable computing equipment or desk computers and is comprised of the following modules. The main module is in charge of showing the user the information it has stored in the computer equipment, of measurements carried out previously. The rain events module is in charge of calculating how many rain events were registered during the timeframe in which the apparatus was measuring (Figure 5), and for each rain event shown, the date and hour in which it started to rain, the duration of the event in minutes, how many mm of pluvial precipitation were registered, and the kinetic energy of the rain. The Excel module is in charge of storing in a spreadsheet the information for the rain events. The pluviographs module allows for the graphical visualization of how the rain event occurred (Figure 5). The hyetographs module is utilized to visualize the hyetograph corresponding to a rain event.
Literatura citada
Banzi, M. 2011. Getting Started with Arduino. Editorial O´REILLY. 130 p. [ Links ]
Barker, A. 1966. Rain and like precipitation gauges. 3243999. [ Links ]
Capra, M.; Escala, D. and Morisio, M. 1997. Adapting the PSP to an SME context. SPI 97. How to Improve: Practice and Experience, The European Conference on Software Process Improvement. Conference Proceedings. SPI 97. Farnham, UK. 289-296 pp. [ Links ]
Chappell, R. and Colt, R. 1938. Float type rain gauge. 2118459. [ Links ]
Chavez-Soledispa, A. R. and Duran-Hoyos, E. 2011. Aplicación de PSP para el desarrollo de un sistema administrador de códigos de barra. Artículo de Tesis de grado. Facultad de Ingeniería en electricidad y computación, Ecuador. [ Links ]
Delitala, A. M.; Deidda, R.; Mascaro, G.; Piga, E. and Querzoli, G. 2010. Systematic recover of long high-resolution rainfall time series recorded by pluviographs during the 20th century. Geophysical research. 12:801-804 pp [ Links ]
Fiser, O. and Kveton, V. 2006. Stablity of rain-rate distribution: how many years to measure? Electronics letters. 42(10):567-569 pp. [ Links ]
Méndez, A.; Hernández-González, A.; Garrido-Monagas, M. and Gilbert, A. A. 2013. Captación de lluvia con pluviógrafos de cubeta y su postprocesamiento. Ingeniería Hidráulica yAmbiental. 73-87 pp. [ Links ]
Mojardi-Gilan, H.; Ahmadi, H.; Jaafari, M.; Bihamta, M. and Salajegheh, A. 2010. Study of the temporal distribution pattern of rainfall effect on runoff and sediment generation using rain simulator (Case study: Alvand Basin). World Applied Sciences Journal. 11(1):64-69 pp. [ Links ]
Reingart, M. 2012. Plataforma de desarrollo rápido de aplicaciones bajo el proceso de Software personal: en busqueda de agilidad, solidez y disciplina para la Ingeniería de Software. 15 Concurso de Trabajos estudiantiles. Compendio de trabajos de grado. Universidad de Palermo, Buenos Aires, Argentina. 344-367 pp. [ Links ]
Rodriguez-Vazquez, S. 2013. Arquitectura organizacional para soluciones empresariales de software. Revista Cubana de Ciencias Informáticas. 7(3):1-13 pp. [ Links ]
Salinas, E.; Cerpa, N. y Rojas, P. 2011. Arquitectura orientada a servicios para software de apoyo para el proceso personal de software. Ingeniare. Revista Chilena de Ingeniería. 19(1):40-52 pp. [ Links ]
Sandoval, G.; González, L.; Mosquera, V. y Molano, J. 2010. Pluviógrafo electrónico con transmisión de datos inalámbrica. Revista colombiana de Tecnologías de Avanzada. 2(16):67-73 pp. [ Links ]
Sansom, J. 1987. Digitising pluviographs. Journal of Hydrology. 26(2):197-209 pp. [ Links ]
Sen, R. and Singh, M. P. 2007. Effect of ran on millimeter - wave propagation. International Symposium on Rainfall Rate and Radio Wave Propagation. 45-76 pp. [ Links ]
Technologies, M.). Obtenido de Obtenido de http://www.adafruit.com/datasheets/eTapeApp.pdf . Consultado diciembre 2013. [ Links ]
Vannitsem, S. and Naveau, P. 2007. Spatial dependences among precipitation maxima over Belgium. Nonlinear Processes in geophysics. 14:621-630 pp. [ Links ]
Von-Konsky, B.; Ivins, J. and Robey, M. 2005. Using PSP to evaluate student effort in achieving larning outcomes in a software engineering assignment. ACE ’05 Proceedings of the 7th Australasian conference on Computing education. Australian Computer Society, Inc. Darlinghurst, Australia. ISBN: 1-920682-24-4. Volumen 42. 193-201 pp. [ Links ]
Watts, H. 2000. Introduction to te personal Software process. Sydney, Addition-Wesley, ISBN 0201548097. [ Links ]
Wilcher, D. 2012. Learn Electronics with Arduino. Technology in action. Editorial Technology in action. 269 p. [ Links ]
Received: September 2015; Accepted: January 2016
 Este es un artículo publicado en acceso abierto bajo una licencia Creative Commons
