Servicios Personalizados
Revista
Articulo
Indicadores
-
 Citado por SciELO
 -
 Accesos
Links relacionados
-
 Similares en
SciELO
Compartir
Revista mexicana de ciencias agrícolas
versión impresa ISSN 2007-0934
Rev. Mex. Cienc. Agríc vol.6 spe 12 Texcoco nov./dic. 2015
Articles
Design of a fertilization program for chrysanthemum based on extraction of macronutrients
1Universidad Autónoma Agraria Antonio Narro-Departamento de Horticultura. Calzada Antonio Narro 1923, Buenavista, Saltillo, Coahuila., México. (luisalonso.valdez@ uaaan.mx; dalcam_1@hotmail.com; cruzi@live.com.mx).
Studies on nutrient extraction allow establishing the basis to adjust fertilization to crop cycle, optimizing inputs. In the present study macronutrients extraction was modeled for chrysanthemum. Biomass accumulation increased from the start of short days, with a similar pattern in the extraction of N, P, K, Ca and Mg; however, this was much higher during the flowering stage. At the start of short days, there was greater extraction of N and K than P, Ca and Mg, whereas in the flowering stage, extraction of P, Ca and Mg increased. The greatest accumulation of N and K was in the last 30 days of the cycle, but for P, Ca and Mg this was in the last 15 days. Most of the absorbed nutrients accumulated in stems and leaves, followed by inflorescence and root. The nutritional requirements at the start of short days was: K ≈ N ˃ P> Ca ≈Mg while in the development phase of inflorescence was: N ≈ K ˃ P> Ca> Mg. Considering an efficiency of 50%, 40%, 80%, 75% and 75% in the use of N, P, K, Ca and Mg, respectively, and a population density of 69 plants m-2, total nutrient demand in Chrysanthemum is 40.25 g m-2 N, 17.44 g m-2 P, 19.2 g m-2 K, 5.01 g m-2 Ca and 4.4 g m-2 Mg.
Keywords: efficient use of fertilizers; extraction curves; mineral nutrition ornamental; sustainable agriculture
Los estudios de extracción nutrimental permiten establecer las bases para ajustar la fertilización al ciclo de cultivo, optimizándose los insumos a utilizar. En el presente estudio se modeló la extracción de macronutrimentos en crisantemo. La acumulación de biomasa aumentó desde el inicio de los días cortos, con un patrón similar en la extracción de N, P, K, Ca y Mg; sin embargo, este fue mucho mayor en la etapa de floración. Al inicio de los días cortos, se presentó una mayor extracción de N y K que de P, Ca y Mg, mientras que en la etapa de floración la extracción de P, Ca y Mg aumentaron. La mayor acumulación de N y K fue en los últimos 30 días del ciclo, pero para P, Ca y Mg esta fue en los últimos 15 días. La mayor parte de los nutrimentos absorbidos se acumularon en tallos y hojas, seguido por la inflorescencia y la raíz. Los requerimientos nutrimentales al inicio de los días cortos fue: K ≈ N ˃ P > Ca ≈ Mg mientras que en la fase de desarrollo de la inflorescencia fue: N ≈ K ˃ P > Ca > Mg. Considerando una eficiencia del 50%, 40%, 80%, 75% y 75% en el uso del N, P, K, Ca y Mg, respectivamente, y una densidad de población de 69 plantas m-2, la demanda total de nutrimentos en crisantemo es: 40.25 g m-2 N, 17.44 g m-2 P, 19.2 g m-2 K, 5.01 g m-2 Ca y 4.4 g m-2 Mg.
Palabras clave: agricultura sustentable; curvas de extracción; eficiencia en el uso de fertilizantes; nutrición mineral; ornamentales
Introduction
Ornamental species are of great importance in Mexican agricultural sector due to its high value and cut flowers, foliage, and in container that are sold both domestically and internationally. According to a study made by Financiera Nacional de Desarrollo Agropecuario, Rural, Forestal y Pecuario (2014), highlight that for its production value rose (1 480 mdp), chrysanthemum (1 079 mdp), gladiolus (824 mdp) and the poinsettia (431 mdp). Chrysanthemum (Chrysanthemum morifolium Ramat) is the second largest cut flower of the top three grown internationally (Villanueva et al., 2005). In the State of Mexico 2 466.75 ha were cultivated with chrysanthemum (SIAP, 2012) and produced 8,731,240 thick, of which, 60% is for domestic market and 40% external. Chrysanthemum flower production under greenhouse nationwide recorded an average growth of 99.9% between 2004 and 2010, increasing in the last year to 583 654 t.
Overall, growers in Mexico perform cultural activities in a traditional way, since they do not count with adequate infrastructure or with an efficient production system that allows them to reduce production costs and improve quality (Cabrera and Orozco, 2003). A common problem among growers is that they do not follow a fertilization plan according to the real needs of nutrient demand by the crop throughout its production cycle (Quesada-Roldan and Bertsh-Hernandez, 2013). In particular, one of the problems facing chrysanthemum production is a decreased yield and quality due to nutrient imbalances resulting from inadequate fertilization, mainly N, P, K, Ca and Mg.
Generally, growers use excessive amounts of fertilizers in accordance with a predetermined program that repeats each crop cycle, as the application of foliar fertilization every seven days, with products in which water pH is not adjusted for foliar fertilization (Gaytan-Acuña et al., 2006), which reflects in an excessive use of fertilizer, low flower quality and higher production cost, as well as soil and groundwater pollution.
A critical component like mineral nutrition is considered one of the most important factors affecting production (Quesada-Roldan and Bertsh-Hernandez, 2013) because there are problems with fertilizer dosage (Bugarín-Montoya et al., 2002). Current trends indicate that issues such as impact of excessive use of fertilizers (Basheer and Agrawal, 2013; Sepat et al., 2012) should be taken into account, as well as the increase in the cost of these and their availability in the future (Basheer and Agrawal, 2013; Gad and Hassan, 2013; Mehdizadeh et al., 2013). Environmental, economic and availability concerns have increased awareness on precise management of fertilization programs. Under the nutrient management concept known as "4R" (quantity, source of fertilizer, application site and right time of application) as well as nutrient extraction curves are an option to preserve the quality of the environment, while productivity is maintained (Santos, 2011).
Nutrient absorption studies allows to establish the basis to fertilize crops, so it can be adjusted to the crop cycle, which in turn enables to optimize the amount of fertilizer to use, prevent soil degradation and lessen the impact of fertilization on the environment and human health. The increased efficiency of nutrient is mainly based on their applicability according to plant demand and phenological stage (Terry, 2008), for which nutrient extraction curves are studied.
Nutrient absorption curves determine the time or phenological stage of the crop in which a nutrient is extracted to a greater or lesser extent, and at the end of the cycle the total accumulation thereof is obtained. Absorption curves have been used in many crops and open up new possibilities to the producer in terms of efficiency and saving fertilizers, however, for chrysanthemum this information does not exist. Therefore, this study was aimed to model the concentration and extraction of macronutrients in different phenological stages of chrysanthemum under culture conditions without soil, in order to determine more precisely the timely application of fertilizers according to the demand of the plant.
Materials and methods
This study was conducted under greenhouse conditions at the Universidad Autonoma Agraria Antonio Narro (UAAAN) in Buenavista, Saltillo, Coahuila. The average minimum and maximum temperature recorded during the study was 14.3 and 27.6 °C respectively.
Chrysanthemum rooted cuttings (Chrysathemum morifolium Ramat) cv. White Indianapolis with three leaves, root length of 3 cm and stem length of 8 cm. This cultivar belongs to the response group 9 weeks to flowering. The cuttings were transplanted on July 28th 2012 in black polyethylene containers with a volume of 10 L. The containers are filled with a mixture of acid substrate based on peat and perlite in a ratio 4: 1 (v / v). Three rooted cuttings were planted in each container completely covering the roots; the distance between plants was 10 cm and 20 cm between containers.
For plant nutrition a nutritious stock solution with the following concentrations of macronutrients (meq L1) were used: NO3- = 14, H2PO4-= 1, K += 8, Ca2+= 6, Mg2+= 2, same that was prepared with tap water considering its chemical properties for this formulation. The pH was adjusted to 6.1 ± 0.1 with sulfuric acid and the electrical conductivity (EC) was 3.1 dS m-1. Micronutrients were added as chelated-EDTA at a concentration of iron, zinc, manganese and copper at 5 ppm, 0.5 ppm, 0.01 ppm and 0.02 ppm, respectively. The concentration of the aforementioned solution was handled according to EC from the leachate substrate in order to keep the initial level; when EC from the leachate decreased, the concentration of the nutrient solution was increased to 25% or 50%, and conversely, when EC from the leachate increased, the concentration of the solution formulation decreased in the same proportion.
Photoperiod management started from the transplantation day, providing to the plant long days for 25 days through 100 W incandescent lamps, lighted from 22:00 to 02:00 h and placed at 1.5 m height at a distance of 1.5 m. Long days were discontinued when the plant reached a height of 20 cm, thus initiating the short days to induce flowering. Short days were manipulated by placing a black plastic for 9 weeks from 18:00 to 8:00 h until the end of the study.
Flower harvest was performed at 80 days after transplantation, defining the cutoff when these were left to open from 3 to 4 central rings from the disc flowers. During the study period, seven destructive sampling were made, one every 14 days; for this, plants were completely removed from the container and were separated into root, stem, leaf and flower. The roots were washed with water to remove the excess of substrate. Subsequently, separated organs were placed in a drying oven at 70 °C for 72 h, recording dry matter using a digital scale.
To the root, stem-leaf and inflorescence were determined macronutrient concentration. The tissues were digested in a mixture 2:1 of H2SO4: HClO4 and 2 ml of H2O2 at 30% and the digested samples were analyzed for nitrogen (N) with the procedure of microKjeldahl (Bremner, 1996), while the concentration of phosphorus (P), potassium (K), calcium (Ca) and magnesium (Mg) was performed using emission spectrometer inductively coupled plasma (ICP-AES, model Liberty, VARIAN, Santa Clara, CA) (Soltanpour et al., 1996).
The calculation for macronutrient extraction was made considering dry matter and the concentration of these in the different organs of the plant; the sum of the extraction from the different organs represented total plant extraction. Nutrients distribution in different organs, expressed as a percentage, was determined from the nutritional content.
The experimental unit was formed by a container with three plants, with four replications at each sampling. Dry matter and nutrient extraction data were used to estimate the models of three linear segments with the SigmaPlot 12.5.
Results
Biomass accumulation
The greatest root biomass accumulation was recorded from 70 to 80 days after transplanting (ddt) with 71.2% of total dry matter accumulated in this organ, in contrast for stem, this occurred between 56 and 80 ddt with 85.8% of total dry matter (Table 1). Dry matter from leaf had the highest accumulation after 42 ddt with 95.4% of the total, while inflorescence, the greatest accumulation occurred between 70 and 80 ddt (Table 2).
Table 1 Dry matter accumulation in plant organs chrysanthemum (Chrysanthemum morifolium Ramat) cv. Indianapolis White.

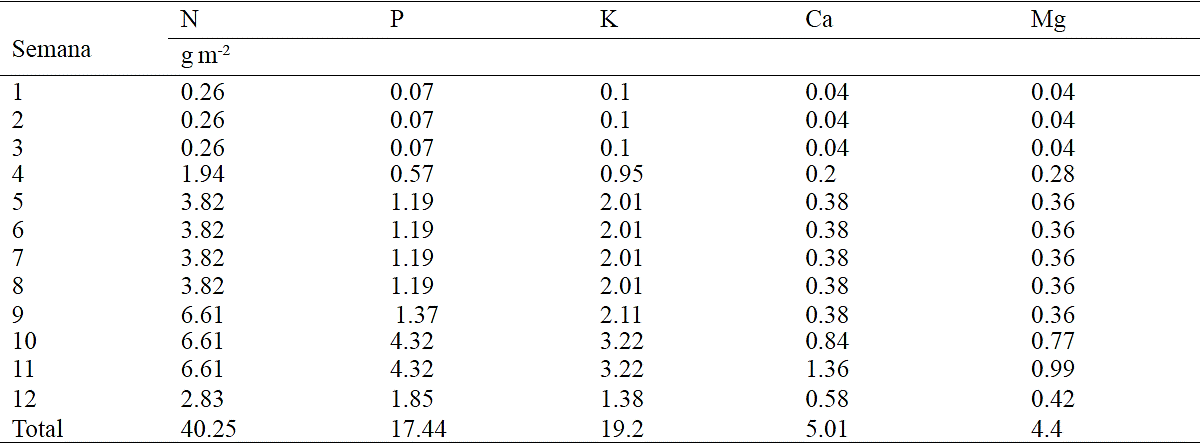
Table 2 Program fertilization obtained from models of nutrient extraction chrysanthemum (Chrysanthemum morifolium Ramat) cv. Indianapolis White. Calculations were made considering density of 69 plants m -2 (12 cm x 12 cm) and an efficiency of 50 %, 40% , 80 %, 75% and 75% by the use of nitrogen (N) , phosphorus (P), potassium (K) , calcium (Ca) and magnesium (Mg) , respectively.
Chrysanthemum cycle is divided into the following phenological phases: vegetative (corresponding to short days phase), inductive (corresponding to the start of short days until flower bud is visible) and flowering (from visible flower bud to harvest) (Figure 1). According to estimated models, the accumulation of total dry matter begins to rise little before the start of short days (after 26 ddt), but this increase is even more pronounced after mid flowering phase (66 ddt), phase corresponding to the development of the inflorescence (Figure 1).
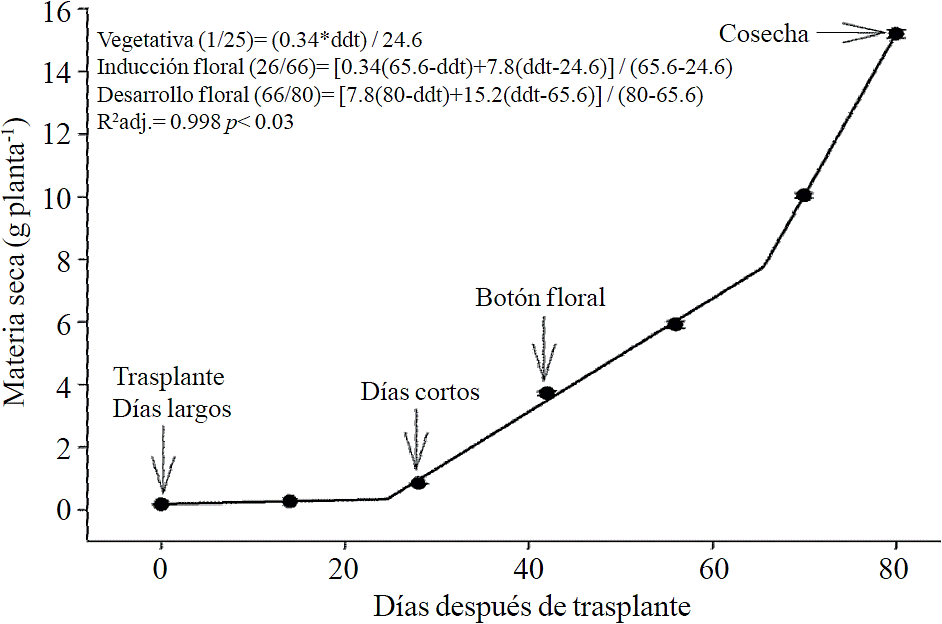
Figure 1 Total dry matter accumulation in chrysanthemum (Chrysanthemum morifolium Ramat) cv. Indianapolis White. Models corresponding to the three detected phenological phases present, and brackets days after transplanting (dat) comprising the respective phase. Bars indicate the standard error of the mean (n = 4).
Nutrient extraction
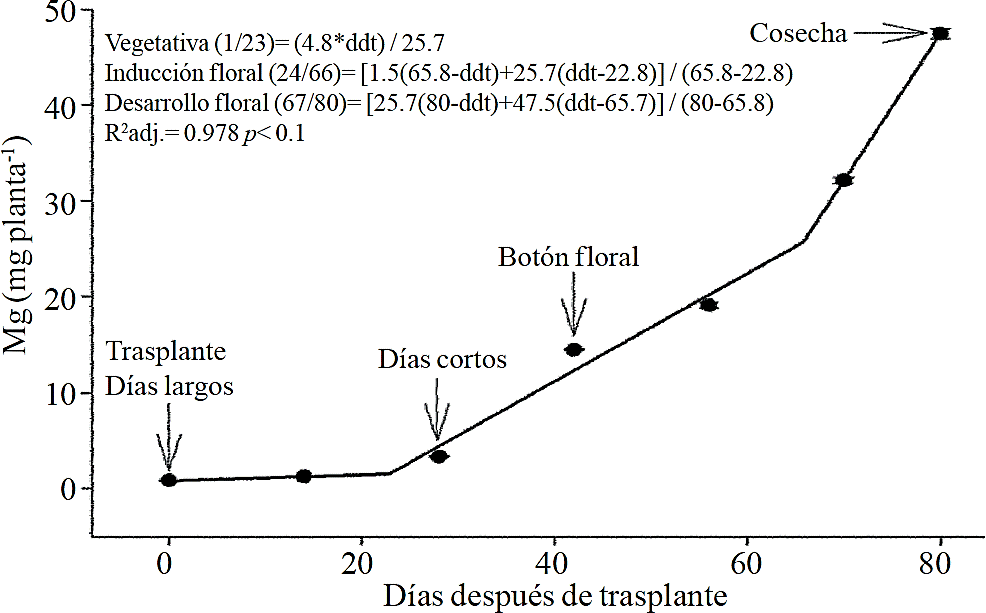
Macronutrient extraction followed a similar behavior to the accumulation of total dry matter. According to estimated models, N (Figure 2) and K (Figure 3) extraction starts after 26 and 25 ddt, respectively, that is, near the inductive phase about to start short days, while at 58 or 63 ddt, virtually in inflorescence development, a minimum change in slope occurs, suggesting a similar absorption rate of this nutrient in both phases. Similar behavior is recorded for P (Figure 4), Ca (Figure 5) and Mg (Figure 6), but at mid inflorescence development phase (67, 68 and 67 ddt for P, Ca and Mg, respectively) a important increase occurs in the absorption rate of these nutrients.
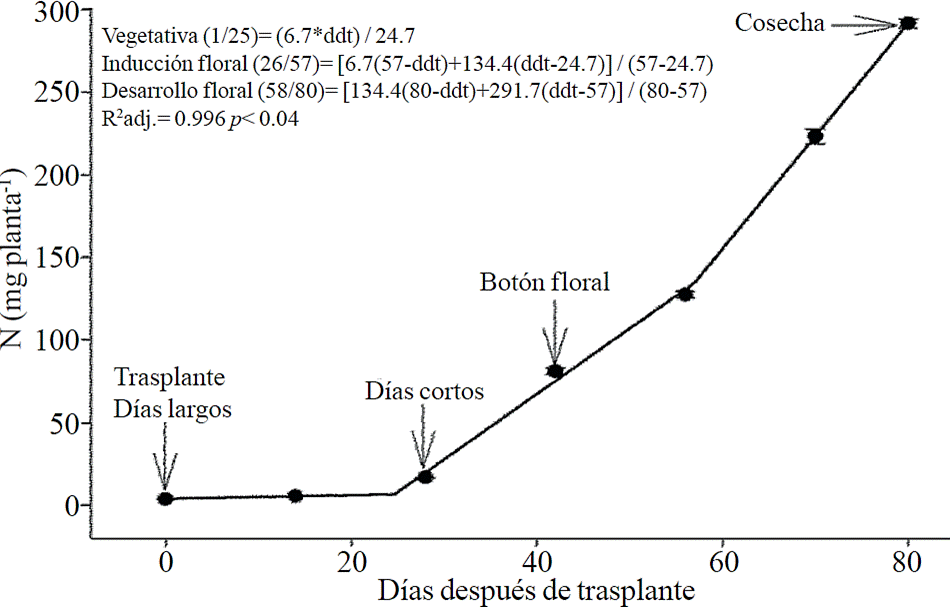
Figure 2 Removing nitrogen (N) in chrysanthemum (Chrysanthemum morifolium Ramat) cv. Indianapolis White. Models for the three phenological phases detected and brackets show the days after transplanting (DAT) comprising the respective phase. Bars indicate the standard error of the mean (n = 4).
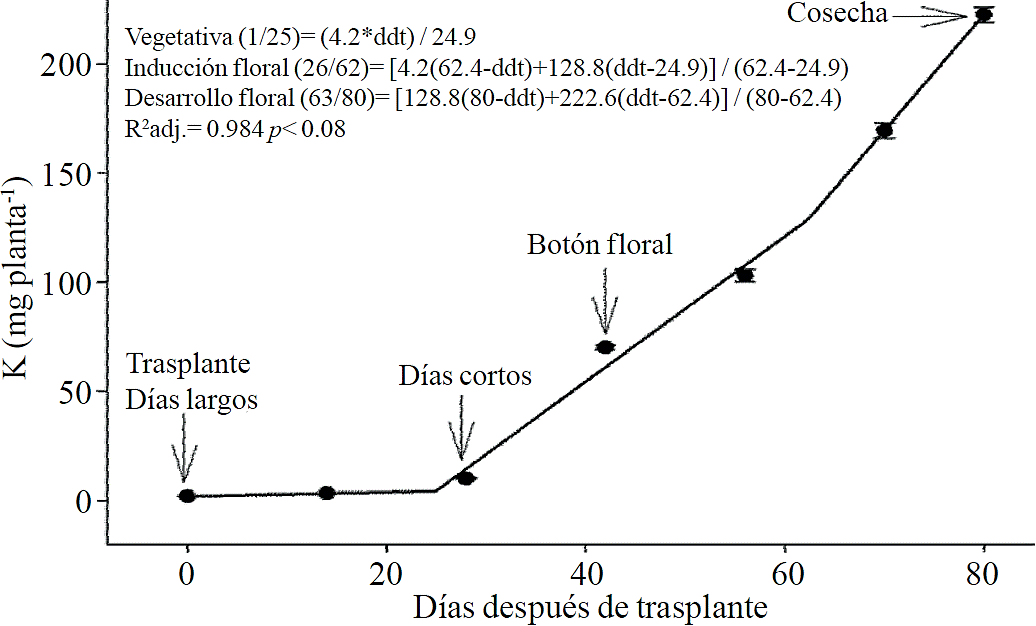
Figure 3 Removing potassium (K) in chrysanthemum (Chrysanthemum morifolium Ramat) cv. Indianapolis White. Models for the three phenological phases detected and brackets show the days after transplanting (DAT) comprising the respective phase. Bars indicate the standard error of the mean (n = 4).
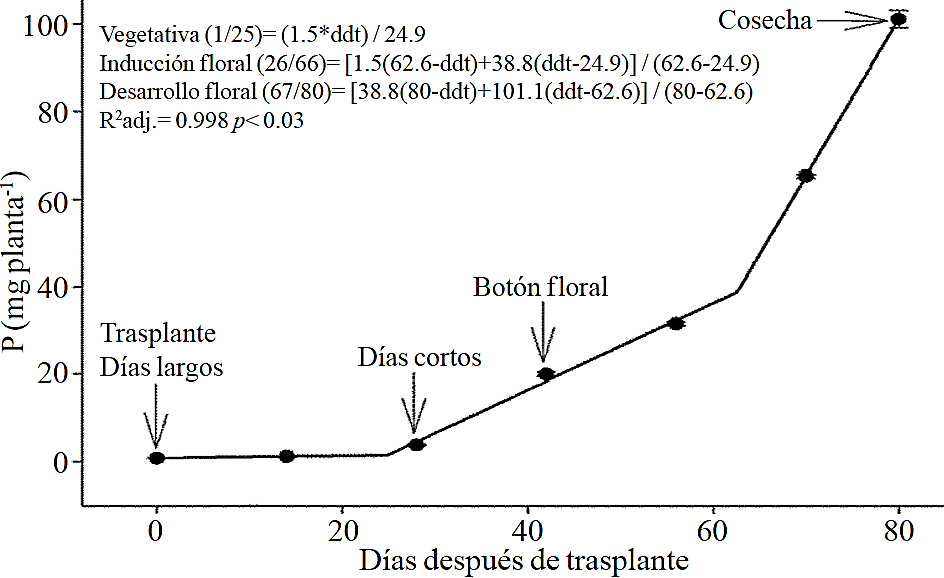
Figure 4 Removing phosphorus (P) in chrysanthemum (Chrysanthemum morifolium Ramat) cv. Indianapolis White. Models for the three phenological phases detected and brackets show the days after transplanting (DAT) comprising the respective phase. Bars indicate the standard error of the mean (n= 4).
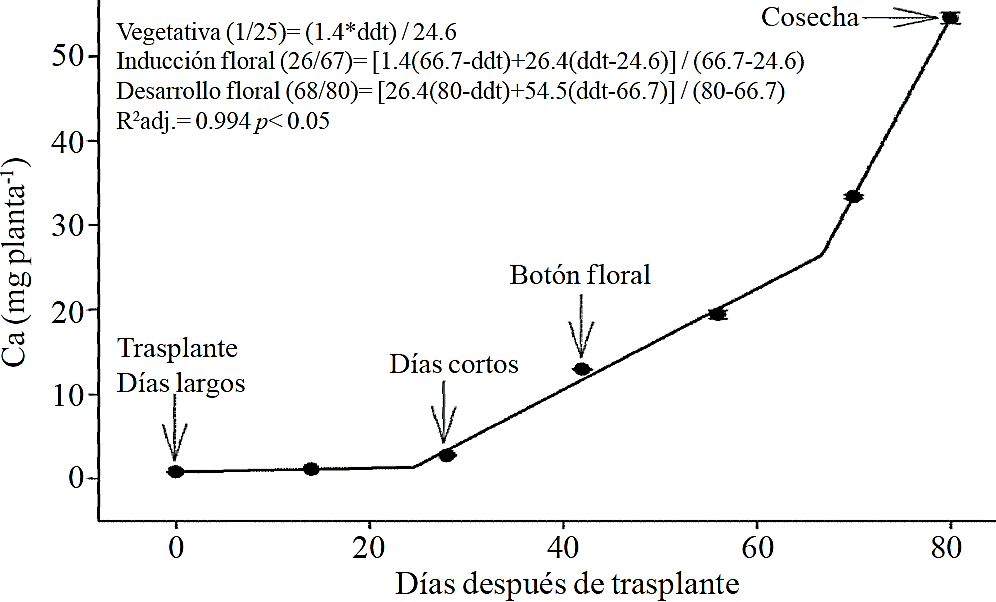
Figure 5 Removing calcium (Ca) in chrysanthemum (Chrysanthemum morifolium Ramat) cv. Indianapolis White. Models for the three phenological phases detected and brackets show the days after transplanting (DAT) comprising the respective phase. Bars indicate the standard error of the mean (n= 4).
Relative macronutrient extraction
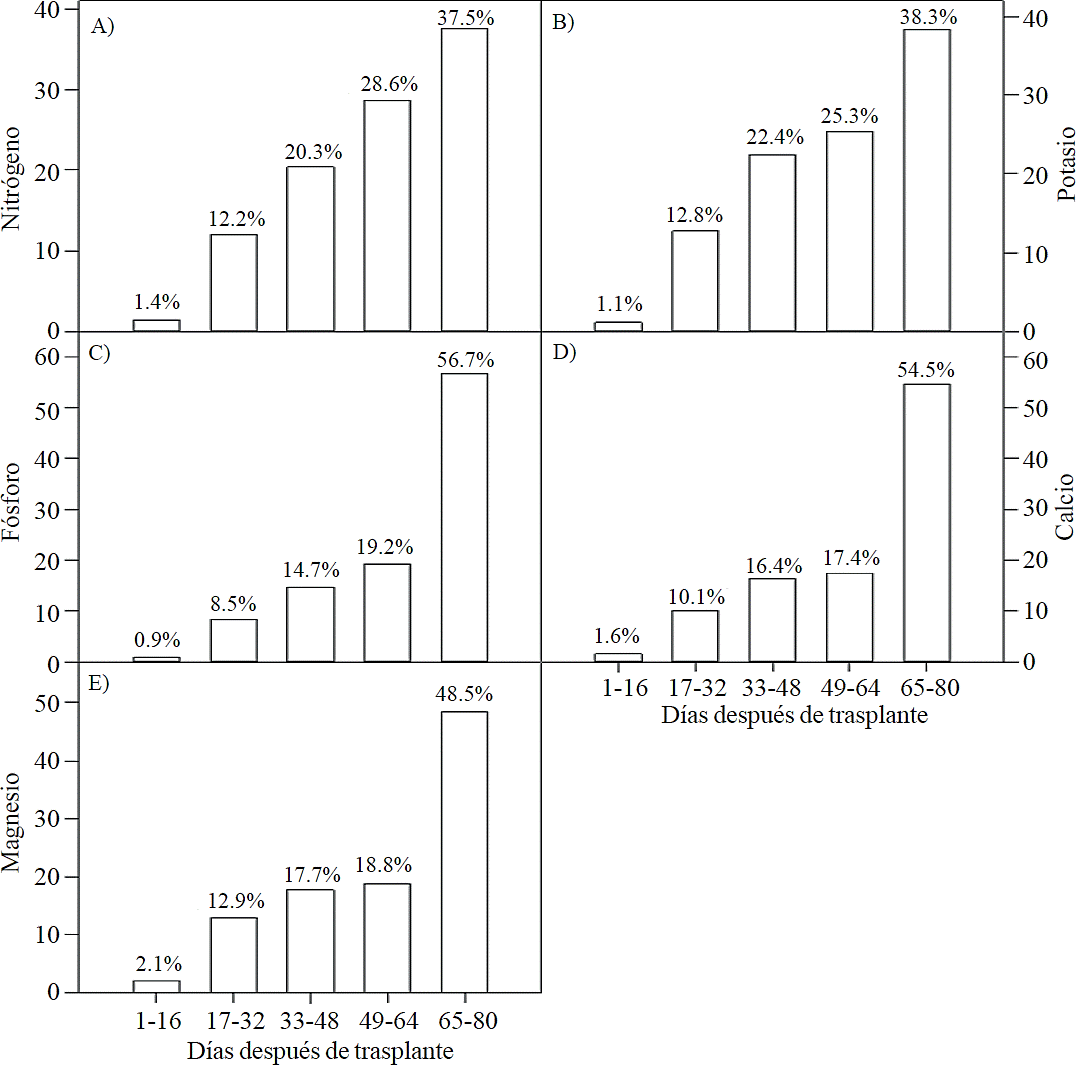
The highest accumulation rate of N (Figure 7A) and K (Figure 7B) was recorded in the last 30 days of the growing season, as from the total absorbed by the plant, 66.1% and 63.6% of total N and K, respectively, was accumulated during inflorescence development. For P (Figure 7C), Ca (Figure 7D) and Mg (Figure 7E), the highest accumulation rate occurred in the last 15 days with 56.7%, 54.5% and 48.5%, respectively.
Nutrient distribution
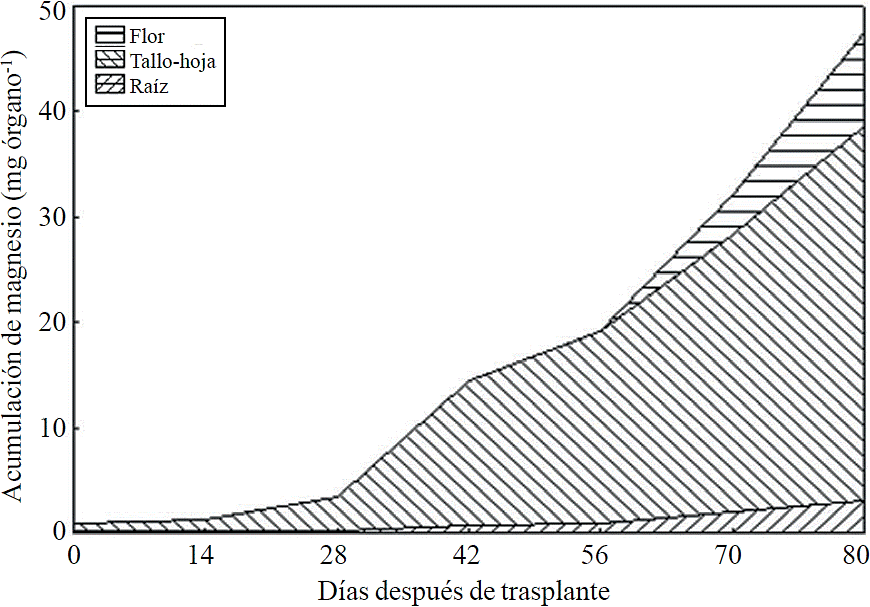
Most of the N absorbed during the growth cycle was mainly accumulated in stems and leaves, followed by inflorescence, while the lowest accumulation of this was in the root (Figure 8). The same effect was recorded for P; however, the accumulation of this nutrient is higher in root than in flower (Figure 9). K (Figure 10) and Ca (Figure 11) accumulated in stems and leaves, whereas in the root and flower there was no difference in the accumulation of these nutrients; Mg distribution (Figure 12) in the different organs was similar to that from N.
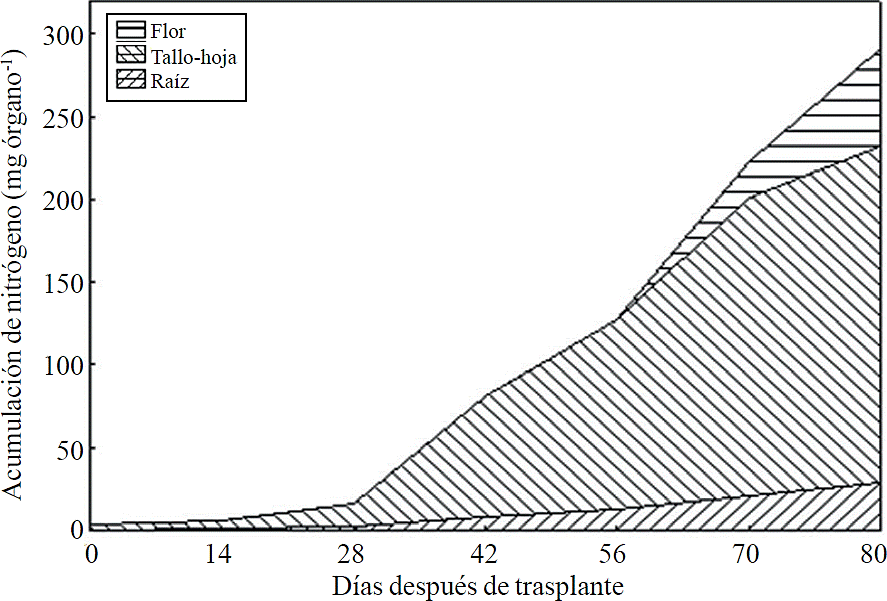
Figure 8 Accumulation of nitrogen in plant organs chrysanthemum (Chrysanthemum morifolium Ramat) cv. Indianapolis White.
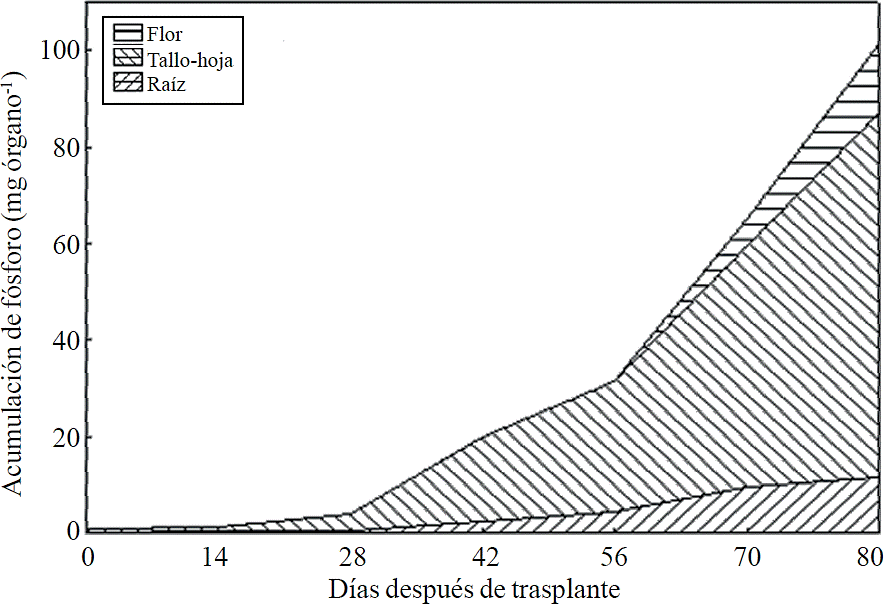
Figure 9 Phosphorus accumulation and distribution in plant organs chrysanthemum (Chrysanthemum morifolium Ramat) cv. Indianapolis White.
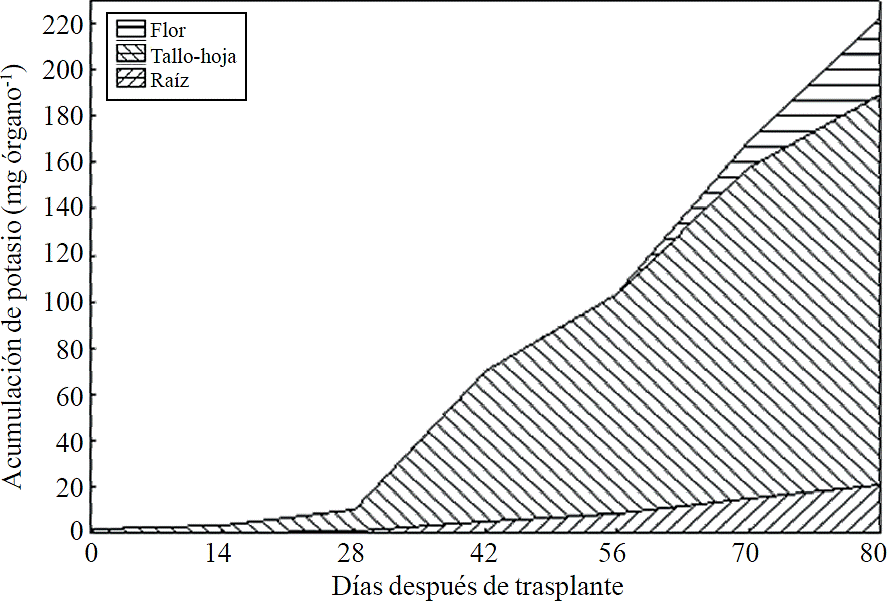
Figure 10 Accumulation and distribution of potassium in the plant organs chrysanthemum (Chrysanthemum morifolium Ramat) cv. Indianapolis White.
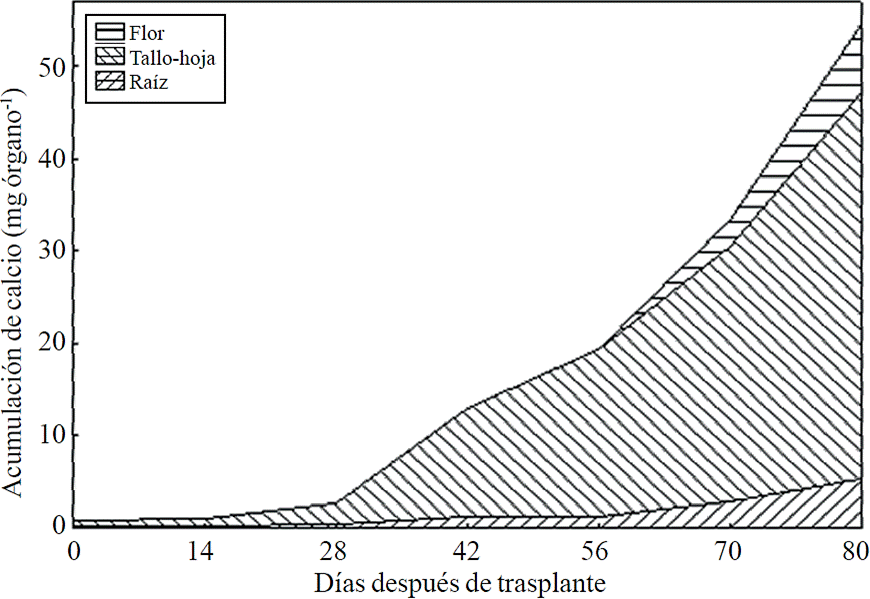
Figure 11 Calcium accumulation and distribution in plant organs chrysanthemum (Chrysanthemum morifolium Ramat) cv. Indianapolis White.
Fertilization program
Based on estimated models it is possible to determine a fertilization program according to a time interval of interest for the grower as well as an efficient use of nutrients, which is determined according to the technological level this counts with and population density. Table 2 shows fertilization program on a weekly basis, considering certain efficiency. As shown, fertilization dosage increases as growth and plant development progresses; however, the first three weeks after transplantation, the amount to be supplied is held constant, while at week 9, 10 and 11, is when the highest amount of N and K is applied, while at weeks 10, 11 and 12 a higher amount of P, Ca and Mg (Table 2) must be applied. Considering a population density of 69 plants m-2, total nutrient demand in chrysanthemum was 40.25 g m-2 N, 17.44 g m-2 P, 19.29 g m-2 K, 5.01 g m-2 Ca and 4.4 g m-2 Mg.
Discussion
In chrysanthemum, biomass accumulation increased substantially from the floral induction phase just when the application of short photoperiod starts, which was mainly associated with high formation of leaves and stem elongation, as well as the eventual appearance of flower bud, about two weeks later and its development. These results agree with those reported by Pineda-Pineda et al. (2008) in red raspberry (Rubus idaeus L.) since this species presented the highest accumulation of dry matter in budding, flowering and fruiting. A further increase in the accumulation rate of biomass was present, according to models, 14 days before harvest, when chrysanthemum is developing inflorescence.
N, P, K, Ca and Mg extraction followed a very similar pattern to biomass accumulation matching with that reported by Liu et al. (2009) who indicate that the increase in dry matter accumulation is linearly proportional to absorption and accumulation of these nutrients in chrysanthemum. Between induction stage and start of inflorescence development a very marked increase in N and K extraction was present, which was between 26 and 57 ddt fro N and 26 and 62 ddt for K; however, during inflorescence growth phase, another increase in the extraction rate of these nutrients was present, though not as pronounced as other nutrients. High demand of N in the induction stage may be due to this nutrient is the main constituent of fixing proteins from CO2 and chlorophyll, required for the formation of new leaves, while K plays an important role in the turgidity and cell expansion (Marschner, 2012).
P, Ca and Mg extraction also increased between the stages of induction and growth initiation of inflorescence, which were between 26 to 66, 26 to 67 and 24 to 66 ddt, respectively. However, the increase in the extraction rate in the last 15 days before harvest was much more important for P, Ca and Mg compared to that observed for N and K. This suggests that N and K extraction begins from early stages, so their application must start along with the long photoperiod and decrease it slightly after 66-67 ddt; the application of P, Ca and Mg should also start at the same time when long photoperiod is applied but must continue during inflorescence growth.
The increase in P extraction before harvest may be due to their involvement in the synthesis of anthocyanins and other pigments, according to Anuradha et al. (1990), the increased supply of P produces greater color intensity to inflorescence in marigold (Tagetes erecta L.), as well as a higher rate of cell division by the rapid growth during the short time period, thus it has been shown that the decrease of P limits the number of cell divisions (Chiera et al., 2002). Mg is also part of some pigments in flowers of Salvia patens (Takeda et al., 1994) and increases the accumulation of anthocyanins in aster (Aster ericoid) (Shaked-Sachray et al., 2002). Furthermore, Ca is very important during inflorescence growth before harvesting since it has been reported that this regulates cell growth and development (Tuteja and Mahajan, 2007) as well as in the formation of new cell walls in meristematic tissues in a very active stage of cell division to complete flowering.
N, P, K, Ca and Mg were mainly accumulated in the aerial parts (stem-leaf) in an average of 81.5%, in the inflorescence 9.3%, and 9.2% in root. In red raspberry, leaf was the organ that accumulated the largest amount of macronutrients, followed by root, stem, fruit and flower (Pineda-Pineda et al., 2008).
Generally, in fertilization programs it is indicated that the highest supply of nutrients should be applied in deep fertilization while the last provision must be applied at the beginning of flowering (ICAMEX, 2003). However, according to our results, in the vegetative phase (1 to 25 ddt) chrysanthemum has a minimum nutrient requirements, so it is unnecessary deep fertilization with high amounts, except for P when applied in the form superphosphate.
In the inductive phase (approximately 26 to 66 ddt) the nutritional requirements increase but demand is even higher during flowering stage (about 67 to 80 ddt), since a greater amount of N and K has to be applied in the last 30 days of the crop cycle, as in this stage it is extracted 66% and 64% from the total extracted throughout the growth cycle. For P, Ca and Mg, requires a higher fertilization in the last 15 days, as in this stage 57% of P, 55% of Ca and 49% of Mg is extracted. During the first 3 weeks after transplantation, nutrient demand remains constant, but at the end of the cycle was the requirements needs order is: N ˃ K> P > Ca ≈ Mg; however, at the beginning of the induction phase the requirements were: N ≈ K ˃ Mg ≈ P > Ca, while at the beginning of floral development was: K ≈ N ˃ P> Ca ≈Mg and at the middle of inflorescence development was: N ≈ K ˃ P> Ca> Mg.
In technical guides to grow chrysanthemum under greenhouse it is suggested a fertilization programs that includes the application of 300 kg ha-1 of triple calcium superphosphate before land preparation, while two weeks after transplantation recommends applying 180 kg ha-1 of phosphonitrate (ICAMEX, 2003). Six weeks after transplantation, it is recommended to apply 180 kg ha-1 phosphonitrate, plus 90 kg ha-1 triple calcium superphosphate and 110 kg ha-1 of potassium nitrate, repeating this formulation every two weeks until the beginning of flowering (ICAMEX, 2003). Transforming these units, it gives a NPK formulation of 363-134-185 + 92 Ca; under the assumption that this fertilization dose is applied only in the useful area (avoiding to apply the fertilizer in the corridors of the growing beds), compared to the formulation obtained in this study, it would be applying in excess 50 % N, 28% P, 61% K and 206% Ca.
Conclusions
According to the estimated models, during floral induction, biomass production increases, but this increase is more marked during the flowering stage. This same trend was recorded for N, P, K, Ca and Mg extraction; however, the highest accumulation rate of N and K was in the last 30 days, but for P, Ca and Mg it occurred in the last 15 days. Considering an efficiency of 50%, 40%, 80%, 75% and 75% in the use of N, P, K, Ca and Mg, respectively, and a population density of 69 plants m-2, the total demand of nutrients in Chrysanthemum is 40.25 g m-2 of N, 17.44 g m-2 P, 19.2 g m-2 K, 5.01 g m-2 of Ca and 4.4 g m-2 of Mg.
Literatura citada
Anuradha, K.; Pampapathy, K. and Narayana, N. 1990. Effect of nitrogen and phosphorus on flowering, yield and quality of marigold. India. Ind. J. Hortic. 47(3):353-357. [ Links ]
Basheer, M. and Agrawal, O. P. 2013. Research article effect of vermicompost on the growth and productivity of tomato plant (Solanum lycopersicum) under field conditions. India. International J. Recent Sci. Res. 3(4):247-249. [ Links ]
Bugarín-Montoya, R.; Galvis, A.; Sánchez, P. y García, D. 2002. Demanda de potasio del tomate tipo saladette. México. Terra Latinoam. 4(20):391-399. [ Links ]
Cabrera, R. J. y Orozco, M. R. 2003. Diagnóstico sobre las plantas ornamentales en el estado de Morelos. SAGARPA-INIFAPCIRCE C.E. Zacatepec, Morelos, México. 38:26. [ Links ]
Chiera, J.; Thomas, J. and Rufty, T. 2002. Leaf initiation and development in soybean under phosphorus stress. Inglaterra. J. Exp. Bot. 53(368):473-481. [ Links ]
Financiera Nacional de Desarrollo Agropecuario, Rural, Forestal y Pesquero (FND). 2014. Panorama de Ornamentales. 2 p. [ Links ]
Gad, N. and Hassan, N. M. 2013. Role of cobalt and organic fertilizers amendments on tomato production in the newly reclaimed soil. Egipto. World Appl. Sci. J. 10(22):1527-1533. [ Links ]
Gaytán-Acuña, E.; Ochoa, D. L.; García, R.; Zavaleta, E. y Mora, G. 2006. Producción y calidad comercial de flor de crisantemo. México. Terra Latinoam. 4(24):541-548. [ Links ]
ICAMEX (Instituto de Investigación y Capacitación Agropecuaria, Acuícola y Forestal del Estado de México). 2003. Guía para cultivar flor de crisantemo en invernadero. Metepec, México. 14446:10. [ Links ]
Liu, D.; Guo, L.; Zhu, D.; Liu, W. and Jin, H. 2009. Characteristics of accumulation and distribution of nitrogen, phosphorus, potassium, calcium and magnesium in Chrysanthemum morifolium. China. Zhongguo Zhong Yao Za Zhi. 34(19):2444-2448. [ Links ]
Marschner, P. 2012. Mineral nutrition of higher plants. Academic Press. 3th edition. London, UK. 684 p. [ Links ]
Pineda-Pineda, J.; Avitia-García, E.; Castillo-González, A. M.; CoronaTorres, T.; Valdez-Aguilar, L. A. y Gómez-Hernández, J. 2008. Extracción de macronutrimentos en frambueso rojo. México. Terra Latinoam. 26(4):333-340. [ Links ]
Mehdizadeh, M.; Darbandi, E. I.; Naseri-Rad, H. and Tobeh, A. 2013. Growth and yield of tomato (Lycopersicon esculentum Mill.) as influenced by different organic fertilizers. Iran. Int. J. Agron. Plant Prod. 4(4):734-738. [ Links ]
Quesada-Roldán, G. y Bertsh-Hernández, F. 2013. Obtención de la curva de extracción nutrimental del híbrido de tomate FB-17. México. Terra Latinoam. 1(31):1-7. [ Links ]
Shaked-Sachray, L.; Weiss, D.; Reuveni, M.; Nissim-Levi, A. and OrenShamir, M. 2002. Increased anthocyanin accumulation in aster flowers at elevated temperatures due to magnesium treatment. Reino Unido. Physiologia Plantarum. 114(4):559-565. [ Links ]
Santos, B. M. 2011. Selecting the right nutrient rate: Basis for managing fertilization programs. USA. HortTechnol. 6(21): 683-685. [ Links ]
Sepat, N. K.; Kumar, A.; Yadav, J. and Srivastava, R. B. 2012. Effect of integrated nutrient management on growth, yield and quality of tomato in trans Himalayan. India. Ann. Plant Soil Res. 2(14):120-123. [ Links ]
SIAP (Servicio de Información de Agroalimentaria y Pesquero) 2012. Anuario estadístico de la producción agrícola. http://www.siap.gob.mx/cierre-de-la-produccion-agricola-por-estado/ . (consultado marzo, 2015). [ Links ]
Takeda, K.; Yanagisawa, M.; Kifune, T.; Kinoshita, T. and Timberlake, C. F. 1994. A blue pigment complex in flowers of Salvia patens. USA y Europa. Phytochemistry. 35(5):1167-1169. [ Links ]
Terry, L. R. 2008. Improving nutrient use efficiency. Turkia. J. Agric. Fores. 3(32):177-182. [ Links ]
Tuteja, N. and Mahajan, S. 2007. Calcium signaling network in plants. Inglaterra. Plant Signal Behav. 2(2):79-85. [ Links ]
Villanueva, C. E.; Sánchez, M. A.; Cristóbal, A. J.; Ruiz, E. y Tun, J. M. 2005. Diagnóstico y alternativas de manejo químico del tizón foliar (Alternaría chrysanthemum Simmons y Crosier) del Crisantemo (Chrysanthemum morifolium Ramat) Kitamura en Yucatán, México. México. Rev. Mex. Fitopatol. 1(23):49-56. [ Links ]
Received: April 2015; Accepted: July 2015


 texto en

