


Serviços Personalizados
Journal
Artigo
 texto em
  Inglês (pdf)
 Artigo em XML
 Referências do artigo
 Enviar este artigo por email
Indicadores
-
 Citado por SciELO
 -
 Acessos
Links relacionados
-
 Similares em
SciELO
Similares em
SciELO
Compartilhar

 Permalink
Revista mexicana de ciencias agrícolas
versão impressa ISSN 2007-0934
Rev. Mex. Cienc. Agríc vol.6 no.8 Texcoco Nov./Dez. 2015
Articles
Effect of five densities in eight maize cultivars planted in three locations in the Valley of Toluca, Mexico
1Centro de Investigación y Estudios Avanzados en Fitomejoramiento, Facultad de Ciencias Agrícolas, Universidad Autónoma del Estado de México. Campus Universitario El Cerrillo. Toluca, México. A. P. 435. Tel: 01 (722) 2965518. Ext. 148. (ireneflores21@hotmail.com; djperezl@uaemex.mx; mrubia@uaemex.mx).
In order to improve grain yield (GY) maize varieties and hybrids could be identified with stable grain production on plants or cobs (GYP or GYC) in high population densities (PD) and contrasting environments. In this study, eight maize cultivars in five PD were evaluated in three locations in the Valley of Toluca, Mexico, to study their effects on the GY and dimensions of plant and ear cob. The three experiments were established in 2013, in an experimental randomized complete block design with three replicates per site, using a split plot arrangement in a series of experiments in space. The most outstanding results showed that: a) the best location was "San Andrés" (9.86 t ha-1); b) the GY difference between the highest and the lowest PD was 1.01 t ha-1, but from 54 524, 69 444 and 104 167 plants, there were no significant differences; c) the best cultivars were AS-722 and "San Andrés" (9.60 and 9.25 t ha-1); d) in the multivariate analyses, three groups of variables were observed (sick pods - prolificacy index and volumetric weight of the grain -GY, plant and ear cob dimensions, vegetative cycle and lodging) or cultivars ("San Andrés" and "San Cristobal" - HC8 - other hybrids). Thus, the PGM and the prolificacy index could be used as indirect selection criteria in breeding programs and two outstanding maize used to generate, validate and apply technology in this region.
Keywords: Zea mays; densities; maize cultivars; Mexico; multivariate analysis; Valle de Toluca
Para mejorar el rendimiento de grano (RG) podrían identificarse variedades e híbridos de maíz con estabilidad en producción de grano por planta o mazorca (RGP o RGM) en altas densidades de población (DP) y ambientes contrastantes. En este estudio fueron evaluados ocho cultivares de maíz en cinco DP en tres localidades del Valle de Toluca, México, para estudiar sus efectos en el RG y en las dimensiones de planta y mazorca. Los tres experimentos se establecieron en 2013 en un diseño experimental de bloques completos al azar con tres repeticiones por sitio usando un arreglo de parcelas divididas en una serie de experimentos en espacio. Los resultados más sobresalientes mostraron lo siguiente: a) la mejor localidad fue San Andrés (9.86 t ha-1); b) la diferencia en RG entre la mayor y la menor DP fue de 1.01 t ha-1 pero entre 54 524, 69 444 y 104 167 plantas no hubo diferencias significativas; c) los mejores cultivares fueron AS-722 y San Andrés (9.60 y 9.25 t ha-1); d) en los análisis multivariados se observaron tres grupos de variables (mazorcas enfermas - índice de prolificidad y peso volumétrico del grano - RG, dimensiones de planta y mazorca, ciclo vegetativo y acame) o de cultivares (San Andrés y San Cristóbal - HC8 - resto de híbridos). Así, el PGM y el índice de prolificidad podrían emplearse como criterio de selección indirecto en programas de fitomejoramiento y ambos maíces sobresalientes utilizarse para generar, validar y aplicar tecnología en esta región mexiquense.
Palabras clave: Zea mays; análisis multivariados; cultivares de maíz; densidades de población; México; Valle de Toluca
Introduction
Of the true grasses, maize (Zea mays L.) is probably the species with the greatest potential to produce grain and over the last 75 years has been one of the crops which have seen higher yields per unit area. In order to explore and exploit its ability to efficiently convert solar radiation into grain is necessary to understand how to interact morphologically and physiologically plants and identify management practices that adequately using available resources (Sangoi, 2000). Globally, it is the third most important cereal in human nutrition, Mexico is the largest market with 11% and per capita consumption of123 kg, higher than the world average of16.8 kg (Agroder, 2012).
Tollenaar and Lee (2011) commented that, the increases in grain production have been achieved in the last 60 years are mainly attributed to breeding (60%) and the application of technological improvements (40%) and using more fertilizers, efficient weed control increases in population density, narrower grooves, and use of superior hybrids. In yield tests have been evaluated from 5.5 to 16.0 plants m-2 and GY ranged from 1.6 to 11.6 t ha-1 (Sangoi et al., 2002; Widdicombe and Thelen, 2002; Paszkiewics and Butzen, 2007; Sarlangue et al., 2007; Single et al., 2010; Abuzar et al., 2011; Morales et al., 2014; Haegele et al., 2014).
The population density (PD) is one of the most important cultural practices that affect grain yield and other yield components (Sangoi, 2000), and the latter highly dependent on the environment, genotype, agronomic management and its interactions (Rodríguez et al., 2002; González et al., 2008; De la Cruz et al., 2009; González et al., 2010; Tollenaar and Lee, 2011; Reynoso et al., 2014). The PD is conditioned mainly by the cultivar, the length of the growing season, planting date, availability of water, the groove width and fertilization (Sangoi, 2000). The choice of the PD is available to farmers in an easy and economical way and their analysis will define the relationship between the amount of optimum plants per unit area and the largest grain yield in different environments (Sangoi et al., 2002).
Although, in other countries such as China, Argentina, Canada and Italy (4.57, 5.65, 6.63 and 9.53 t ha-1) occurs more grain than in Mexico (3.99 t ha-1), the Valley of Toluca, in the State of Mexico, Mexico, is a region with high potential for the planting of hybrid and high yielding varieties; the average is 4.39 t ha-1 (SIAP, 2013), but have been obtained experimentally from 4.01 to 11.56 t ha-1 (González et al., 2007; González et al., 2008; Morales et al., 2014). In recent decades they have released hybrid outstanding but the response to the increase in PD is unknown when one fertility treatment at various locations is applied. Thus, the main objective of this study was to evaluate five densities on grain yield components and other eight cultivars of maize grown in three locations in the Valley.
Materials and methods
Description of the study area
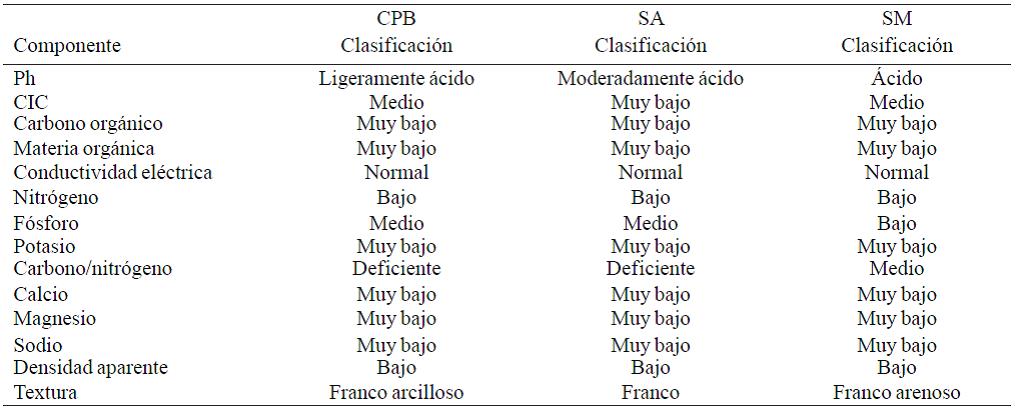
This study was done in 2013, in three towns of the Valley of Toluca, Mexico: "El Cerrillo Piedras Blancas" (CPB), "San Andrés Cuexcontitlán" (SA) and "San Mateo Otzacatipan" (SM). The CPB is located at19° 22' 29.2" N and 99° 35' 13 .2" west longitude at an altitude of2 632 m; the clay loam soils are predominant and its pH is 6.1. SA is located at 19° 22' 27.5" N and 99° 35' 11.4" west longitude at 2 532 meters, the most common soil is franc, and its pH it is 5.86. SM is located at 19° 21' 30" north latitude and 99° 36' 06.8 west longitude at 2 632 meters, the most common soil is sandy loam with a pH of 4.7. The climate of the Toluca Valley is temperate sub-humid, with an annual average temperature of13.7 °C and rainfall between 1 000 and 1 200 mm, 80-140 frost days in the period from October to March (Garcia, 2005).
Genetic material
We used H-40, AS-722, AZ-60, HC-8, HID-17 HIT-11, "San Cristobal" and "San Andrés".
Experimental design and size of the parcel a series of experiments in space was used in a randomized complete block with three replicates per location in divided plots: in the largest plot, the PD were assigned and, the cultivars in the small one. The plot consisted of three rows of 6 x 0.80 m; the middle row was the used unit (UEU= 4.8 m2).
Agronomic management
In CPB, irrigation was applied on pre-planting and in SA and SM there are residual moisture soils. Mechanical preparation consisted of fallow land and two steps of drag. CPB planting took place on April 11 in SA on April 24 and May 2 SM. 250 kg of urea were applied, 150 kg of 18N-46P-00K and 50 kg of potassium chloride (140N-69P-30K); 1/3 of the nitrogen and all phosphorus and potassium at planting and the rest of N in the V8 stage (May 27, June 4 and 7). Two weedings were made in CBS and SA and one in SM. In CPB, the weeds were controlled with 1.0 kg of atrazine 90 and 1 L of 2,4-D amine; in a second application we used 2 L of atrazine 6-chloro-N2-ethyl-isopropyl 1,3,5-2,4 diamine and 1 L dicamba + atrazine; these two, in the same doses were applied in the other two locations on June 18 and 30 and July 4. The harvest took place on December 16, 18 and 26 2013.

Variables registered
Male and female blooms (FM and FF, days from planting to 50% of the plants pollen released or issued stigmata), ear and plant heights (AM and AP measured in cm from the ground to the insertion of ear ligule main or tang), root and stalk lodging (AC, percentage of plants with broken stems or steeper than 45°), diseased pods (ME, in%), ear length (LM, measured in cm Based on its tip), ear diameter (DM, cm middle part), rows of grain from the cob (HM), cob weight and grain per ear (POM and PGM, g), grain yield (GY, t ha-1), volumetric grain weight (PVG, kg L-1) and prolificacy index (IP; ratio of harvested ears and plants UEU). UEU five plants were used to calculate AM, AP, LM, DM, HM, POM, PGM, PVG; for the rest all data were used (González et al., 2008).
Statistical analysis
Outputs combined analysis of variance and Tukey test (p= 0.05) were obtained. The arithmetic procedures and the Programme for SAS (Statistical Analysis System view. 6.01) were described by Martinez (1988). The main component analysis and cluster analysis, described by Sánchez (1995) and Reynoso et al. (2014) were also used. The biplot was developed in Microsoft Excel view. 1997-2003 (González et al., 2010).
Results and discussion
The results shown in Table 3 indicate that evaluation sites (A), cultivars (G) and G x E interaction should be studied in more detail in relation to population densities (PD) or interactions A x PD and A x PD x G. González et al. (2006), González et al. (2008) and Reynoso et al. (2014) concluded that, the localities in Toluca-Atlacomulco Valley are quite heterogeneous; there is also an important genetic variability for developing new breeding programs, but should also be considered the significant interaction genotype x environment, quite common in this region, hiding the true potential of the genetic material (Rodríguez et al., 2002; Torres et al., 2011).
Table 3 Mean squares and statistical significance of the values of F for the combined analysis of variance.
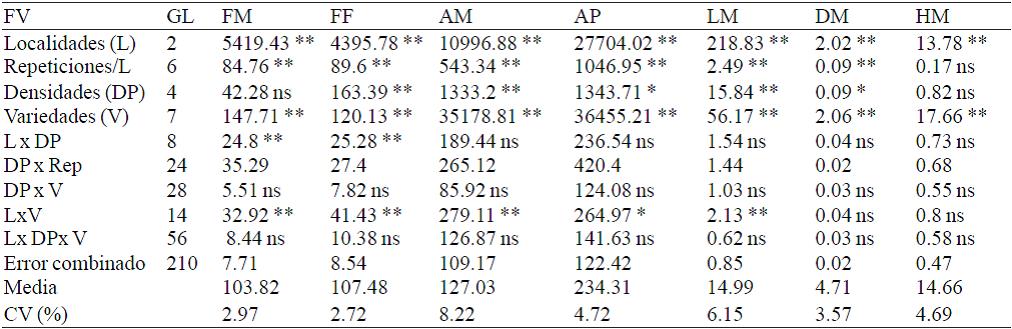
Table 3 Mean squares and statistical significance of the values of F for the combined analysis of variance (Continuation).

*Significativo al 0.05; ** significativo al 0.01; ns= no significativo; GL= grados de libertad
The CPB, SA and SM differ statistically in all variables except AC (Table 4). These results show that the towns of Toluca are quite contrasting, even when the distance between them is less than 20 km. This was highlighted when considering locations in the municipalities of "Calimaya", "Metepec", "Toluca", "Zinacantepec", "Temascaltepec", "Almoloya de Juarez" and "San Felipe"; climate, rainfall, elevation, geographic location, and the type of soil are the main components (González et al., 2006; González et al., 2008; Torres et al., 2011; Reynoso et al., 2014; Perez et al., 2014); also the years originate important temporal variability (Morales et al., 2014).
Table 4 Comparison of means between localities (Tukey, p= 0.05).
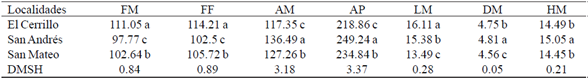
FM y FF= floraciones masculina y femenina; AM y AP= alturas de mazorca y de planta; LM, DM y HM= longitud, diámetro y número de hileras en la mazorca.
Table 4 Comparison of means between localities (Tukey, p= 0.05) (Continuation).
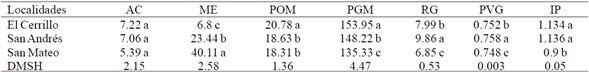
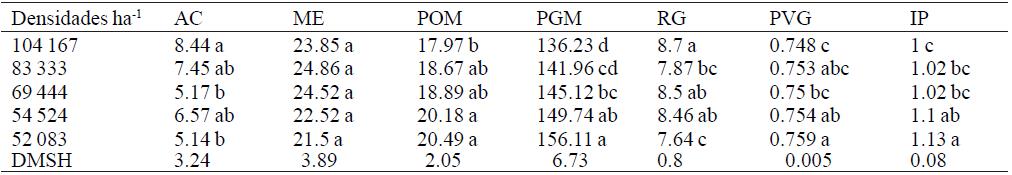
AC= acame; ME= mazorcas enfermas; POM, PGM= pesos de olote y de grano por mazorca; RG, rendimiento de grano, PVG, peso volumétrico del grano; IP= índice de prolificidad.
In SA, he had the highest GY, (9.86 t ha-1), lower growth cycle and higher values in AP, AM, PVG, IP, DM and HM was recorded. In CPB a higher vegetative cycle and lower averages AP AM, ME and GY was recorded, but we had the largest LM, POM and PGM. The lower GY recorded in SM is explained by lower averages in LM, DM, NH, POM, PGM, IP and more ME (Table 5); its sandy loam soils have more acidic pH than the CPB (clay loam) and SA (FR) and are poorer in phosphorus (Table 2). Sotelo et al. (2010) and Garcia (2005) classified them as Feozem, vertisol and Feozem, with rainfall of780, 824 and 810 mm, respectively. Acidic soils favour root rot, stalk and cobs caused by Fusarium spp. This explains why more SM were recorded in ME (40.11%) when there was less AC (5.39%).
Table 5 Comparison of means between population densities (Tukey, p= 0.05). The variables were defined in Table 4.
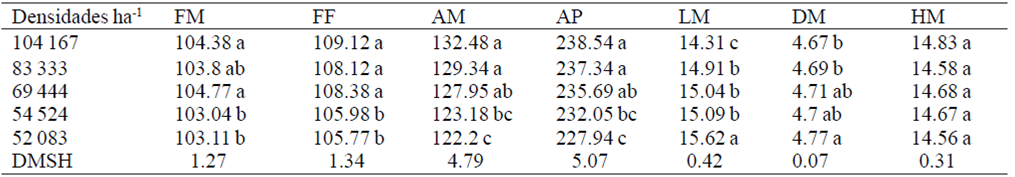
Table 5 Comparison of means between population densities (Tukey, p= 0.05). The variables were defined in Table 4 (Continuation).
ME and HM were not affected significantly varying from 52 083 to 104 167 plants (Table 5), but ear rot is common in the Toluca Valley and relied more on cultivar that PD (Table 4). González et al. (2007) observed that Palomero Toluqueño, Cónico, Chalqueño and Cacahuacintle developed infections and 8.67, 18.06, 3.73 and 6.33%, respectively. The hybrids of Conical-Chalqueño or in the International Centre for Maize and Wheat Improvement (CIMMYT) were more resistant (3.01 and 4.75%). HM is not influenced by the environment and depends on the cultivar (González et al., 2006).
Additionally, the increase in PD resulted in a significant increase in the vegetative stage in AP and AM, and GY and, significantly decreased LM, DM, POM, PGM, PVG and IP (Table 5). These results partially coincide with those published by De la Cruz et al. (2009) and Hokmalipour et al. (2010).
The 52 084 plants originating from the lower and higher PD contributed to a difference of 1.06 t ha-1 (Table 5). This result is relevant as only the fertility treatment was applied (140N-69K-30K). The difference between the best and worst city was 3.01 t ha-1 for which it is concluded that the effects were statistically higher than those caused by the PD or maize cultivars and suggested a larger emphasis on the tests conducted in time and space, as indicated by Reynoso et al., (2014), Torres et al. (2011) and Morales et al. (2014).
In this study we observed that the PD that originated the higher GY was 10.41 plants m-2 (Table 5) but in others ranged from 7.4 to 14.8 plants m-2 (Widdicombe and Thelen, 2002; Paszkiewics and Butzen, 2007; Sarlengue et al., 2007; Single et al., 2010; Morales et al., 2014); in the region Toluca-Atlacomulco was 5.5 plants m-2 for landraces and 7.5 plants m-2 for hybrids (González et al., 2006; González et al., 2008; Torres et al., 2011; Reynoso et al., 2014). These results suggested that, the commercially desirable in the high valleys of Central Mexico hybrids are more competitive in high PD.
However, it should be considered that most of the plants have competition among plants for light, water and nutrients increases and, decreases the GY when stimulated apical dominance, female sterility and reducing the cobs and grains per plant. The decrease in the PGM in the higher densities, the main component of the grain weight per plant and GY is attributed to problems of light and other environmental and agricultural management limiting factors that are two to three weeks before issuance stigmas or one or two weeks into the grain filling; the delay in the issuance of the stigmata, the sterility of flowers or abortion of grains also contribute to this problem (Sangoi, 2000; Tokatlidis and Koutroubas, 2004; Abuzar et al., 2011).
Motto and Moll (1983) commented that has increased the interest in implementing strategies of indirect selection or through selection indexes involving yield components and characteristics of cob that are considered in this study, or other biochemical and physiological variables as an attempt to improve the GY. The number of ears per plant and litter could be used for this purpose because they generally have higher heritability (H2) than the GY. However, in the Valley of Toluca, State of Mexico, there are few studies on this subject (González et al., 2006; González et al., 2008; Reynoso et al., 2014.)
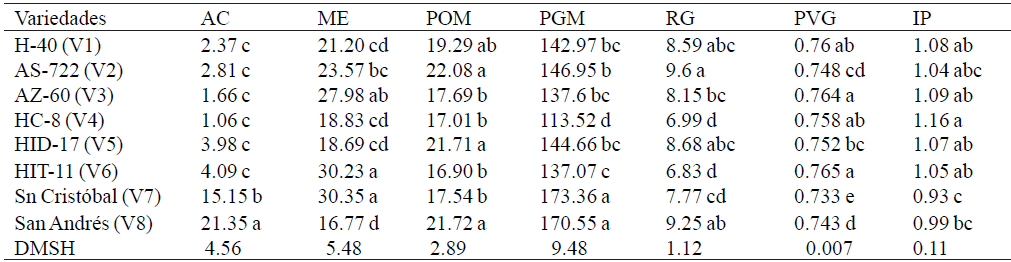
In the present study, the most outstanding genetic material was AS-722 and "San Andrés" (9.60 and 9.25 t ha-1, Table 6); the superiority of the first one is attributed to its intermediate vegetative cycle, characteristics of the cobs and acceptable plants and resistant to AC. González et al. (2008) concluded thatAS-722 produced 7.33 t ha-1 and other landraces of Cónico and Chalqueño yielding 6.55 and 7.50 t ha-1; however, Morales et al. (2014) identified cultivars as "Jiquipilco", "Amarillo" and "Cóndor" with 11.56, 10.76 and 10.47 t ha-1. The landrace "San Andrés" (Table 7) was larger in AP, AM, LM, HM and PGM; also by having more AC and less ME is inferred that is tolerant to Fusarium spp. Its excellent adaptation to the area of study, obtained by visual mass selection practiced by farmers over 15 years and, through life cycle is recommended for planting in irrigated tip, residual moisture or dry.
Table 6 Comparison of means between maize cultivars (Tukey, p= 0.05). The variables were defined in Table 4.
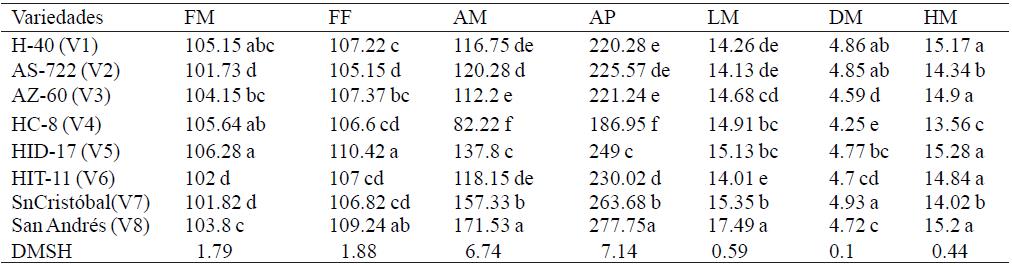
Table 6 Comparison of means between maize cultivars (Tukey, p= 0.05). The variables were defined in Table 4 (Continuation).
The main components (ACP) 1 and 2 explained 73.3% of the original variation (Figure 1) so that the correlations observed in the biplot can be reliably interpreted (Sánchez, 1995). The 14 variables were grouped into: a) IP and PVG, b) ME, c) GY and other features. These results are partly similar to those of by Li et al. (2013); AP, AM, number and internode length, stem diameter and ear height ratio were correlated significantly with GY, tolerance to high densities and AC.
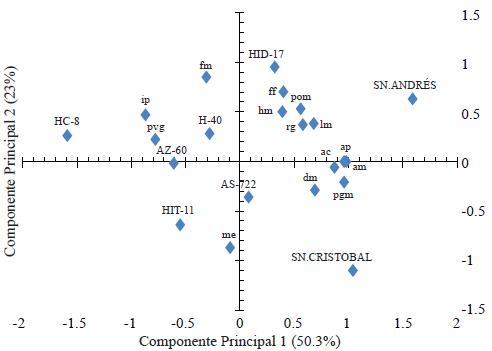
Figure 1 Biplot between eight cultivars of maize (in capital letters) and 14 agronomic variables (lowercase). Genotype x variable method.
The PGM is the main component of the grain weight per plant (PGP) and average grain weight. These facts also suggest that PGM and IP could be used as indirect selection criteria to increase the GY (Motto and Moll, 1983; González et al., 2006; González et al., 2008; Reynoso et al., 2014) even though GY improved in recent release hybrids attributed more to the increase in the range of optimal PD. PD tolerance and high efficiency in the capture and use of resources are some of the causes (Tokatlidis and Koutroubas, 2003; De la Cruz et al., 2009; Tollenaar and Lee, 2011). Thus, an important strategy for improving grain production would choose varieties and hybrids with small differences in GYP, or IP GYC when the PD increased the contrasting environments.
The eight cultivars were grouped as follows: HC-8 (G1); AZ-60, HIT-11, H-40, HID-17 and AS-722 (G2) and both landraces (G3). In G2 and G3 there was a higher grain yield and better plant and ear dimensions (Figure 1). The superiority of AS-722, "San Andrés" HID-17 and H-40 is attributed to the positive and significant correlation existed between GY with LM, DM, HM, POM, PGM, AP and AM, but González et al. (2008) concluded that the higher dimensions in plant, ear and lodging decreased GY. The favourable response showed this genetic material that could be related to the higher stability with the new hybrids in time and space, and specifically at high PD; its components are the potential yield per plant, the tolerances to drought, excess water under nitrogen and root stalk lodging, premature death, insects, weeds and female sterility and a better response to the increased application of inputs (Sangoi et al., 2002; Tokatlidis and Loutroubas, 2004).
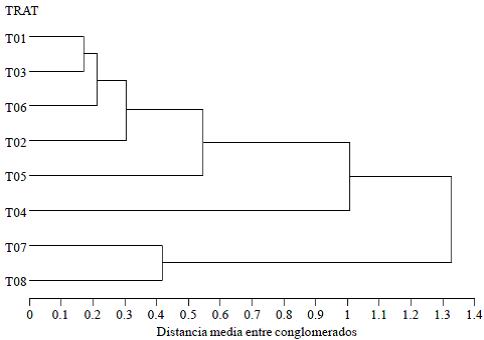
In the dendrogram of Figure 2 an arrangement identical to that observed in cultivars ACP was detected. Due to its geographical location and its values in GY, PGM, AC, AM, AP, ME, LM and DM (Table 6) both natives could belong to the race Cónico (González et al., 2008). Progenitors of H-40, HIT-11 and HID-17 are (CML246 x CML242) x M39, (CML246 x CML242) x IML2 and (CML239 x CML242) x (L10 x L52), respectively; so, these and the other two hybrids could be formed with CIMMYT germplasm, as suggested for other studies by González et al. (2008) and Torres et al. (2011).
Conclusions
The best location was "San Andrés" (9.86 t ha-1). The difference between 104 166 and 52 082 plants was 1.01 t ha-1 but in 54 524 and 69 444 plants, we had yields statistically the same as in the first density. The most outstanding cultivars were AS-722 and "San Andrés" (9.60 and 9.25 t ha-1). In the multivariate analysis, three groups of variables were observed (diseased ear cobs - prolificacy index and volumetric weight of the grain - dimensions of plant an ear cobs, vegetative cycle and lodging) or cultivars (San Andrés and San Cristobal - HC8 - rest of the hybrids); the difference between the groups of higher and lower GY were almost 1.50 t ha-1. d) the weight of grain per ear cob or the prolificacy index could be used as an indirect criteria in new inbreeding programs and both superior cultivars to be used in the generation, application and validation of technology.
Literatura citada
Aguzar, M. R.; Sadozae, G. U.; Batach, A. A.; Shah, I. H.; Javaid, T.; and Hussain, N. 2011.Effect of plant population densities on yield of maize. J. Animal Plant Sci. 21(4):692-695. [ Links ]
Agroder. 2012. Producción de maíz en México. 2010. Comparativo regional de rendimiento de maíz. http://www.agroder.com/documentos/publicaciones/produccion_de_maiz_en_méxico-agroder_2012.pdf. [ Links ]
De la Cruz, L. E.; Córdova, O. H.; Estrada, B. M. A.; Mendoza, P. J. D.; Gómez, V. A. y Brito, M. N. P. 2009. Rendimiento de grano de genotipos de maíz sembrados bajo tres densidades de población. Universidad y Ciencia. 25(1):93-98. [ Links ]
García, E. 2005. Modificaciones al sistema de clasificación climática de Köppen. Talleres Larios. México, D. F. 220 p. [ Links ]
González, H.A.; Sahagún, C. J.; Pérez, L. D. J.; Domínguez, L.A.; Serrato, C. R.; Landeros, F. V. y Dorantes, C. E. 2006. Diversidad fenotípica del maíz Cacahuacintle en el Valle de Toluca, México. Rev. Fitotec. Mex. 29(3):255-261. [ Links ]
González, H. A.; Vázquez, G. L. M.; Sahagún, C. J.; Rodríguez, P. J. E. y Pérez, L. D. J. 2007. Rendimiento del maíz de temporal y su relación con la pudrición de mazorca. Agric. Téc. Méx. 33(1):33-42. [ Links ]
González, H. A.; Vázquez, G. L. M.; Sahagún, C. J. y Rodríguez, P. J. E. 2008. Diversidad fenotípica de variedades e híbridos de maíz en el Valle Toluca-Atlacomulco, México. Rev. Fitotec. Mex. 31(1):67-76. [ Links ]
González, A.; Pérez, L. D.; Sahagún, J.; Franco, O.; Morales, E. J.; Rubí, M.; Gutiérrez, F. y Balbuena, A. 2010. Aplicación y comparación de métodos univariados para evaluar la estabilidad en maíces del Valle Toluca-Atlacomulco, México. Agron. Costarricense. 34(2):129-143. [ Links ]
Haegele, J. W.; Becker, R. J.; Henninger, A. S. and Below, F. E. 2014. Row arrangement, phosphorus fertility, and hybrid contributions to managing incresead plant density of maize. Agron. J. 106(5):1838-1846. [ Links ]
Hokmalipour, S.; Seyedsherifi, R.; Jamaati, S.; Hassanzadeh, M.; Shiri, M. and Zabini, R. 2010. Evaluation of plant density and nitrogen fertilizer on yield, yield components and growth of maize. World Appl. Sci. J. 8(9):1157-1162. [ Links ]
Li, Z.; Jong, Ch.; Ding, L.; Jian, Z.; Ya, H.; Yong, Z.; Zhan, S. and Zhi, L. 2013. QTL mapping for stalk related traits in maize (Zea mays L.) under different densities. J. Integrative Agric. 12(2):218-228. [ Links ]
Martínez, G. A. 1988. Diseños experimentales. Métodos y elementos de teoría. Trillas, México. 756 p. [ Links ]
Morales, R. A.; Morales, R. E. J.; Franco, M. O.; Mariezcurrena, B. D.; Estrada, C. G. y Norman, M.T. H. 2014. Densidad de población en maíz, coeficiente de atenuación de luz y rendimiento. Rev. Mex. Cienc. Agríc. 8:1425-1431. [ Links ]
Motto, M. and Moll, R. H. 1983. Prolificacy in maize: a review. Maydica. 28:53-76. [ Links ]
Pazzkiewicz, S. and Butzen, S. 2007. Corn hybrids response to plant population. Crop Insights. 17:1-4. [ Links ]
Pérez, L. D. J.; González, H. A.; Franco, M. O.; Rubí, A. M.; Ramírez, D. J. F.; Castañeda, V. A. y Aquino, M. J. G. 2014. Aplicación de métodos multivariados para identificar cultivares sobresalientes de haba para el Estado de México, México. Rev. Mex. Cienc. Agríc. 5(2):265-278. [ Links ]
Reynoso, Q. C. A.; González, H.A.; Pérez, L. D. J.; Franco, M. O.; Torres, F. J. L.; Velázquez, C. G. A.; Breton, L. C.; Balbuena, M. A. y Mercado, V. O. 2014. Análisis de 17 híbridos de maíz sembrados en 17 ambientes de los Valles Altos del centro de México. Rev. Mex. Cienc. Agríc. 5(5):871-882. [ Links ]
Rodríguez, P. J. E.; Sahagún, C. J.; Villaseñor, M. H. E.; Molina, G. J. D. y Martínez, G. A. 2002. Estabilidad de siete variedades comerciales de trigo (Triticum aestivum L.) de temporal. Rev. Fitotec. Mex. 25(2):143-151. [ Links ]
Sánchez, G. J. J. 1995. El análisis biplot en clasificación. Rev. Fitotec. Mex. 18:188-203. [ Links ]
Sangoi, L. 2000. Understanding plant density effects on maize growth and development: an important issue to maximize grain yield. Ciencia Rural. 31(1):159-168. [ Links ]
Sangoi, L.; Gracietti, M. A.; Rampazzo, C. and Bianchetti, P. 2002. Response of Brazilian maize hybrids from different eras to changes in plant density. Field Crops Res. 79:39-51. [ Links ]
Sarlengue, T.; Andrade, H. F.; Calviño, A. P. and Purcell, C. L. 2007. Why do maize hybrids respond differently to variations in plant density? Agron. J. 99:984-991. [ Links ]
SIAP (Servicio de Información Agroalimentaria y Pesquera). 2013. Secretaría de Agricultura, Ganadería, Desarrollo Rural, Pesca y Alimentación (SAGARPA). Cierre de producción por estado. Producción nacional de maíz grano. http://www.siap.gob.mx/cierre-de-la-produccion-agricola-por-cultivo/. [ Links ]
Soltero, D. L.; Garay, L. C. y Ruiz, C. J. A. 2010. Respuesta en rendimiento de híbridos de maíz a diferentes distancias entre surcos y densidades de plantas. Rev. Mex. Cienc. Agríc. 1(2):147-156. [ Links ]
Sotelo, R. E. S.; González, H. A.; Cruz, B. G. M.; Moreno, S. F. y Ochoa, E. S. 2010. Clasificación FAO-WRB y los suelos del Estado de México. Instituto Nacional de Investigaciones Forestales, Agrícolas y Pecuarias (INIFAP). Libro técnico Núm. 14. 159 p. [ Links ]
Tokatlidis, I. S. and Koutroubas, S. D. 2004. A review of maize hybrids' dependence on high plant populations and its implications for crop yield stability. Field Crops Res. 88:103-114. [ Links ]
Tollenaar, M. and Lee, E A. 2011. Plant breeding reviews. (Ed.). Janick, J. and Blackwell, W. 94:37-81. [ Links ]
Torres, F. J. L.; Morales, R. E. J.; González, H. A.; Laguna, C. A. y Córdova, O. H. 2011. Respuesta de híbridos trilíneales y probadores de maíz en valles altos del centro de México. Rev. Mex. Cienc. Agríc. 2(6):829-844. [ Links ]
Widdicombe, W. D. and Thelen, K. D. 2002. Row width and plant density effects on corn grain production in the northern Corn Belt. Agron. J. 94:1023-1023. [ Links ]
Received: July 2015; Accepted: November 2015
 Este es un artículo publicado en acceso abierto bajo una licencia Creative Commons
