


Serviços Personalizados
Journal
Artigo
 texto em
  Inglês (pdf)
 Artigo em XML
 Referências do artigo
 Enviar este artigo por email
Indicadores
-
 Citado por SciELO
 -
 Acessos
Links relacionados
-
 Similares em
SciELO
Similares em
SciELO
Compartilhar

 Permalink
Revista mexicana de ciencias agrícolas
versão impressa ISSN 2007-0934
Rev. Mex. Cienc. Agríc vol.6 no.8 Texcoco Nov./Dez. 2015
Articles
Acquisition system in real-time meteorological data with PLC
1Programa de Hidrociencias-Colegio de Postgraduados. Carretera México-Texcoco, km 35.5, C. P. 56230, Montecillo, Texcoco, Estado de México, México.
The objective of this work was to develop a system of acquisition of meteorological data in real time, using a programmable logic controller (PLC) as an alternative within the commercial weather stations. For sensing the air temperature, relative humidity, solar radiation, precipitation, wind speed and direction, commercial sensors were used during 2013, to test the station, in the meteorological station of the Graduate College, Campus Montecillo. The system consists of a PLC (CX1020 model, make Beckhoff), a laptop where an application for real-time monitoring that was developed in Visual Basic 2010 Express and the database MySQL was installed to store information, which can be used for several purposes. The interaction between the PLC and the application of monitoring was performed using wireless communication Wi-Fi. TwinCAT System Manager programs were used (for configuring the hardware) and TwinCAT PLC Control (for programming the PLC). The system operation was evaluated to make comparisons of sensor readings obtained against reference instruments and sensors of a meteorological station Campbell Scientific. The results indicate that it is feasible to use the PLC in the implementation of meteorological stations.
Keywords: automatic stations; meteorology; real time sensors
El objetivo de este trabajo fue desarrollar un sistema de adquisición de datos meteorológicos en tiempo real utilizando un controlador lógico programable (PLC) como una alternativa dentro de las estaciones meteorológicas comerciales. Para sensar la: temperatura del aire, humedad relativa, radiación solar, precipitación, velocidad y dirección del viento, se usaron sensores comerciales, durante 2013, para probar la estación, en la estación meteorológica del Colegio de Postgraduados, Campus Montecillo. El sistema se compone de un PLC (modelo CX1020, marca Beckhoff), una Laptop donde se instaló una aplicación de monitoreo en tiempo real que se desarrolló en Visual Basic 2010 Express y la base de datos en MySQL para almacenar la información, que se puede usar para fines diversos. La interacción entre el PLC y la aplicación de monitoreo se realizó mediante comunicación inalámbrica Wi-Fi. Se usaron los programas TwinCAT System Manager (para la configuración del hardware) y TwinCAT PLC Control (para la programación del PLC). Se evaluó el funcionamiento del sistema al realizar comparaciones de las lecturas obtenidas de los sensores, contra instrumentos de referencia y sensores de una estación meteorológica Campbell Scientific. Los resultados indican que es factible el uso del PLC en la implementación de estaciones meteorológicas.
Palabras clave: estaciones automáticas; meteorología; sensores; tiempo real
Introduction
Climate and weather directly affect the environment of the human being, involved in various aspects such as biological, social and economic. On the one hand, climate allows to know the long-term average of the elements of weather, and the latter in turn, allows to know the atmospheric behaviour in the short term (one to several days). Hence, the importance of studying to have representative information that could help in the development of various activities such as urban development, agriculture, transportation, health, recreation, prevention of disasters, weather, global warming and climate change , among others.
Some basic concepts are defined, for example according to Ahrens et al. (2012), meteorology (Greek meteors "high in the sky" and logos "study" is the interdisciplinary science for studying weather, the atmospheric environment, the phenomena produced there and the laws that govern it, and which uses the weather station as an instrument for measuring the weather elements. The World Meteorological Organization (WMO) defines a weather element as an atmospheric variable or phenomenon that characterizes the weather in a specific place and at any certain time (air temperature, pressure, wind, humidity, storms, fog, cyclones and anticyclones, etc.). The temperature is defined as a physical quantity that characterizes the movement of molecules through a body (WMO, 1992).
The relative humidity as "the reason expressed in percentage, between the observed pressure steam saturation voltage at the same temperature and pressure steam" (WMO, 1998). The precipitation as liquid or solid condensation of water vapuor falling from clouds or the air and deposited on the ground product includes snow, sleet, rain mist and dew (WMO, 2008).
Solar radiation is the energy in the form of electromagnetic waves from the sun and the earth receives. Atmospheric pressure is the force exerted per unit area, as a result of the weight of the atmosphere above the measuring point (WMO, 2008). Mozarrela (1972) defined the wind like a three-dimensional vector quantity with small random fluctuations in space and time, superimposed on a larger scale organized flow, and secondly Günter (2002) defines it as "the compensation of differences in atmospheric pressure between two points".
In Mexico, it mainly depends on meteorological stations of foreign manufacturing, making it necessary to develop competitive systems taking advantage of new technologies and thus have the ability to develop and implement new requirements, with the PLC one of those technological alternatives that were implemented in this paper.
Regarding functions that should have a weather station must have 1) meteorological sensors to provide an electronic signal; 2) electronics to convert the sensor signal to a digital value; 3) storage media for backup site; and 4) telecommunications hardware for data transmission, preferably (Tanner, 1990).
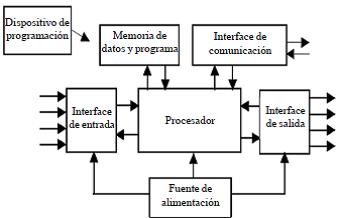
The programmable logic controller (PLC) is defined as a digitally operated electronic system designed for the use in an industrial environment, which uses a programmable memory for storing instructions to implement specific functions such as logic, sequence, timing, counting and arithmetic to control through inputs and outputs, digital or analogue, various types of machines or processes (NEMA, 2005). Typical components in a system PLC are: processor, memory, power supply section input/output communication interface, and the device programming (Boltón, 2009). Figure 1 shows the basic arrangement.
The PLC is able to work with both digital and analogue signals, with the first variable with two distinct levels representing the "false" and "true" logic states and that only the PLC's work with 0 V dc and 24 V dc respectively. Moreover the analogue signals are variables that vary with time in a manner analogous to a physical variable that carry information and include physical quantities such as voltage, current and intensity (Ambardar, 2002).
Regarding the classification of the PLC's stand mainly two criteria, the first criterions is according to their structure, divided into compact and modular, where the compact has all elements integrated into a main module, while the modular contains your items individually and together make up the controller. The second criterion for classification is according to its processing power. They are classified into low, medium and high end, where the low range comprises a maximum of 128 inputs/outputs and up to 4K instruction; the average range comprises a maximum of 512 inputs/outputs and up to 16 K instructions; and finally high-end, that supports more than 512 inputs/outputs and 16K instructions (Peña, 2003). According to these criteria, the CX1020 PLC that was used in this project is the modular high-end and according to their characteristics (Beckhoff, 2013).
Materials and methods
For the design and construction of the acquisition system, we used a programmable logic controller (PLC - Programmer Logic Controller) CX1020 and digital and analogue input modules Beckhoff brand; power supply 24 Vdc, Weidmüller brand; solar radiation sensor LI-200 model brand LICOR; Sensor of air temperature and relative humidity, HO2NVSTA1 model, Veris brand; Campbell Scientific TE525 gauge mark; speed sensor Model 03101 and Model 03301 wind direction wind sensor, both Campbell Scientific brand.
We built a slotted aluminium structure, on which the meteorological sensors and control cabinet with IP65 water protection were mounted (according to IEC 60529, 2001-2002). Inside the cabinet, the components were installed: PLC, power supply, digital and analogue cards inputs, thermo-magnetic switch and some other ancillary components, such as terminals, din rail for mounting elements, channelling chute for wiring and connectors for outer wires (Figure 2 and 3).


The EtherCAT, which is a protocol that uses a "EtherType" officially assigned within the frame of Ethernet (EtherCAT, 2013), which works on Ethernet networks and where the EtherType is used for communication between the PLC and input modules, in a field of two octets within the Ethernet frame that is used to indicate the nature of the client protocol (IEEE 802.3, 2005). Also with a wireless access point, TP-Link for a remote connection from a central computer, where an application for real-time monitoring of values read it ran and that has a MySQL database for storage and later reference (Figure 4).

The Software "TwinCAT System Manager" is used to configure the digital and analogue input modules and establish the communication protocol between the PLC Ethercat CX1020 and the aforementioned modules, also to set the link between the hardware and the user program. The "TwinCAT PLC Control" software code for implementing the program, which was published with the programming language "Structured Text" (ST-Structure Text) operating under the IEC 61131-3 (John, 2010 was also used ; IEC, 2013). The application of real-time monitoring was performed with Visual Basic Express 2010 software and communication between the PLC program and this application was made by the ADS specification Beckhoff, through a component that is installed in Visual Basic Express 2010. The Figure 5 shows an overview of the information flow.

Results and discussion
The development of the system of acquisition of meteorological data once concluded was tested at different atmospheric sensing variables with the corresponding sensors. 2013 data were recorded in the MySQL database; also readings reference instruments were recorded, and then the comparison was made. It is necessary to indicate that this comparison only shows how similar or different sensors are being compared, because the data acquisition system worked when sensing and sending data.
Temperature: compared to readings of the HO2NVSTA1 sensor against Assman psychrometer ventilated type. Readings for four days, were taken every hour, between the hours ranging from 9:00 am to 3:00 pm and the information obtained was adjusted to a linear regression, where the model shown in Figure 6 was obtained was obtained a determination coefficient R2= 0.9583 indicating that there is a good relationship between the sensor measurements.
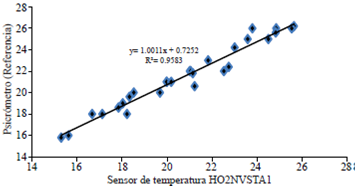
Figure 6 Relationship between the temperature sensor (H02NVST1) and dry thermometer of the psychrometer.
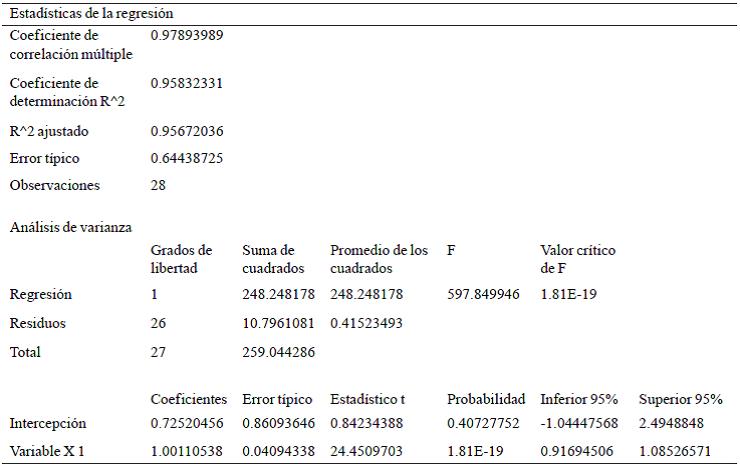
Stating the hypothesis testing H0: b1=0 y Ha: b1≠0 (where b1 is the slope depending on model y= b0 + b1x). H0. H0 means that the slope of the linear regression line is zero, or that the two variables are in-correlated. Obtaining (Table 1) that the value-p= 1.81E-19 <significance level (0.05), therefore the null hypothesis is rejected and the alternative hypothesis is accepted that sets the slope b1≠0 and therefore there correlation.
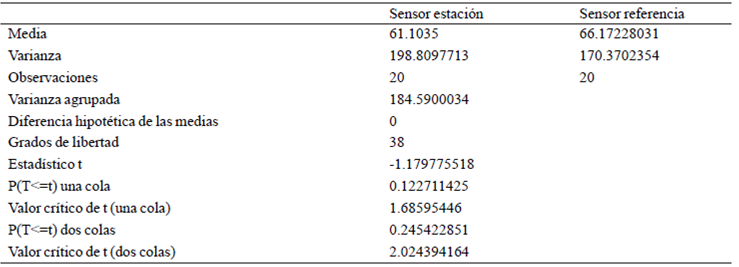
Also making a t-test (Table 2), establishing the hypothesis H0: μ1= μ 2 and Ha: μ1≠ μ2 (where μ1 and μ2 are the sample means). H0 assumes no statistically significant between the mean temperature difference samples. It was found that |tcalculada|= 0.9138 <ttables= 2.0048 and that the value-p= 0.3648 > 0.05, therefore the null hypothesis is accepted and affirmed that there is no statistically significant difference between the mean of the samples for a level of significance α= 0.05.

Relative humidity: comparing the readings of the sensor HO2NVSTA1 against moisture calculated from the temperature on dry and wet bulbs thermometers of the ventilated Assman psychrometer with its correction voltage steam by the atmospheric pressure (Herrera et al., 2012). The adjusting model is shown in Figure 7. Obtaining a determination coefficient R2= 0.8352, indicating that there is an acceptable ratio between both measurements.

Stating the test hypothesis H0: b1=0 y Ha: b1≠0. H0, which means that both variables are in-correlated. (Table 3) was obtained that the value-p= 1.79E-08 <significance level (0.05), so the null hypothesis is rejected and the alternative hypothesis is accepted that sets the slope b 1≠ 0 and therefore A correlation between the two samples.
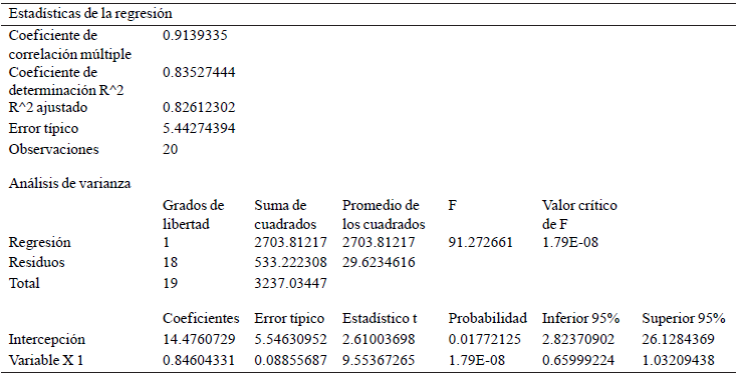
Also, a t-test (Table 4) was performed and, the test hypothesis was stablished H0: b1=0 y Ha: b1≠0. H0, which means that there is no statistically significant difference between the means of RH samples. It was found that |tcalculated|= 1.1797 <ttables= 2.0243 and, that the value-p= 0.2454 > 0.05, therefore the null hypothesis is accepted and affirmed that there is no statistically significant difference between the mean of the samples for a level of significance α= 0.05.
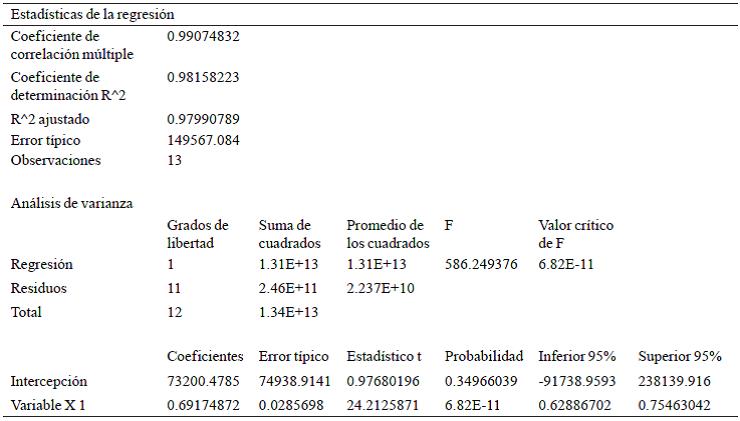
Radiation: the radiation sensor readings were compared against the bimetallic actinograph, Robitzsch type (Figure 8). From the actinograph's graph, the area under the curve for one-hour periods through an integrated leaf area was determined, then conversion was performed on cal/cm2 from the conversion factor (1 cm2= 19.22 cal/ cm2), for finally turning W/m2 (1 cal/cm2= 41868 W/ m2). Although both instruments work in different spectral range, the first in the global radiation and the second in the photosynthetically active radiation (PAR), both responses are related (determination coefficient R2= 0.9815).

Stating the test hypothesis H0: b1=0 y Ha: b≠0. H0, which means that both variables are not correlated at all. (Table 5) that the value-p= 6.82E-11 <significance level (0.05) therefore the null hypothesis is rejected and the alternative hypothesis states that the slope b1≠ 0 and therefore accepted there was obtained correlation between both samples.
Precipitation: the amount of precipitated rain was measured in two days with the TE525 sensor and automatic station using Campbell Scientific, obtaining similar values (with less variation of 3%) shown in Table 6.

Wind direction and speed. In this case, the magnitude and direction of the wind did not compare because the sensors are configured differently. One is configured to measure wind direction from 0 to 355 degree (model 03301, automatic station based on PLC) and the other from 0 to 360 degrees. In terms of instantaneous wind speed variation is obtained on average 0.2 m/s velocity relative to the reference station.
So the development of data acquisition system based on PLC allows sensing of meteorological variables besides quoted transmit via Wi-Fi for storage or other use.
Economic evaluation
An economic comparison was performed between the railway stations developed into a commercial Campbell Scientific, taking into account only the components for measuring the same variables and real-time monitoring. The Table 7 shows the cost of the station developed with PLC (cost in Mexican pesos), and Campbell Scientific equivalent cost was $13 US $928. If we consider a price equal dollar to 13 pesos (OctobeR2013), it has an equivalent cost of $181 064.00 pesos for Campbell Scientific station and $72 971.40 for the developed PLC, which has a difference more than $ 100 000.00 pesos, and thus we conclude that the present work represents an economical alternative to commercial automatic stations.

Conclusions
The developed acquisition system of meteorological data senses and records correctly, the readings of the weather elements: temperature, humidity, radiation, precipitation, wind speed and direction, which is an alternative to a weather station. The modular structure of the system hardware helps for an easy replacement of components in case of damage; also, the processing capacity cannot only perform functions of acquisition, but has the ability to perform other functions such as irrigation control calculating evapotranspiration, etc.
Literatura citada
Ahrens, C. D.; Jackson, P. L. and Jackson, C. E. 2012. Meteorology today: an introduction to weather, climate, and the environment. First Canadian Edition. Canada: Nelson Education Ltd. [ Links ]
Ambardar A. 2002. Procesamiento de señales analógicas y digitales. Segunda Edición. México. Thompson Editores, S. A. de C. V. 15 p. [ Links ]
Beckhoff. 2013. Hardware documentation for CX1020 / CX1030 Embedded PC. Disponible: Disponible: http://download.beckhoff.com/download/Document/EPC/CX1020_HWen.pdf Consultado el 10 de Agosto de 2013. [ Links ]
Bolton W. 2009. Programmable logic controllers. Fifth Edition. Oxford. Elsevier Newnes. 3-4 pp. [ Links ]
Ethercat. 2013. http://www.ethercat.org . (consultado enero, 2013). [ Links ]
Günter, D. R. 2002. Meteorología: formaciones nubosas y otros fenómenos meteorológicos, situaciones meteorológicas generales, pronósticos del tiempo. Barcelona. Ediciones Omega. [ Links ]
Herrera, V. G.; Restrepo, L.A.; Quevedo, N.A.; Crespo, P. G. y Portocarrero, R.A. 2012. Manual Teórico práctico del observador meteorológico de superficie. México. Servicio Meteorológico Nacional. CONAGUA. 70-73 pp. [ Links ]
IEC 60529. 2001-2002. Degrees of protection provided by enclosures (IP Code). Edition 2.1. Geneva: International Electrotechnical Commission. [ Links ]
IEC 61131-3. 2013. Programmable controllers - part 3. Programming languages. Ed. 3.0. International Electrotechnical Commission. [ Links ]
IEEE Std 802.3. 2005. Carrier sense multiple access with collision detection (CSMA/CD) access method and physical layer specifications. New York: Institute of Electrical and Electronics Engineers. 37 p. [ Links ]
John, K. H. and Tiegelkamp, M. 2010. IEC 61131-3: Programming Industrial Automation Systems. 2nd Edition. Germany, Springer. [ Links ]
Mazzarella, D. A. 1972. An inventory of specifications for wind-measuring instruments. Bulletin of American Meteorological Society. 860-871 pp. [ Links ]
NEMA I. A. 2.1. 2005. Programmable Controllers - part 1. General information. National Electrical Manufacturers Association. [ Links ]
Peña, J. D.; Gámiz, C. J.; Grau, S. A. y Martínez, G. H. 2003. Introducción a los autómatas programables. Primera Edición. Barcelona, Editorial UOC. 293 p. [ Links ]
Quevedo, N. A. 2005. La información meteorológica en México. Reporte noviembre para AGROASEMEX. Colegio de Postgraduados. [ Links ]
Quintas, I. 2000. Fuentes de datos meteorológicos. Memorias del 5 Congreso de Meteorología de CFE. 23 y 24 de marzo, Museo Tecnológico de CFE. [ Links ]
Tanner, B. D. 1990. Remote sensing reviews. Vol. 5 (1). United Kingdom. Harwood Academic GmbH. 73 p. [ Links ]
Tanner, B. D. 2001. Evolution of automated weather station technology through the 1980s and 1990s. Automated weather stations for applications in agriculture and water resources management: current use and future perspectives. Hubbard, K. D. and Sivakumar, M. (Eds.). WMO publication (in press). High Plains Regional Climate Center, Nebraska. University of Nebraska - Lincoln. [ Links ]
WMO. 1972. Measurement of temperature and humidity. WMO-No. 759. Geneva: World Meteorological Organization. [ Links ]
WMO. 1998. Technical Regulations. Volume I. Geneva. World Meteorological Organization. [ Links ]
WMO. 2008. Guide to Meteorological Instruments and Methods of Observation. WMO-No.8. Ed. 2008. Geneva: World Meteorological Organization. [ Links ]
Received: June 2015; Accepted: October 2015
 Este es un artículo publicado en acceso abierto bajo una licencia Creative Commons
