


Servicios Personalizados
Revista
Articulo
 texto en
  Inglés (pdf)
 Artículo en XML
 Referencias del artículo
 Enviar artículo por email
Indicadores
-
 Citado por SciELO
 -
 Accesos
Links relacionados
-
 Similares en
SciELO
Similares en
SciELO
Compartir

 Permalink
Revista mexicana de ciencias agrícolas
versión impresa ISSN 2007-0934
Rev. Mex. Cienc. Agríc vol.5 no.spe10 Texcoco nov./dic. 2014
Articles
Sensitivity of bioclimatic zones of Mexico facing climate change
1Campo Experimental Centro Altos de Jalisco-INIFAP. Tepatitlán de Morelos, Jalisco, México. C. P. 47600 .Tel: 01 378 7820355. (flores.hugo@inifap.gob.mx; delamora.celia@inifap.gob.mx; ruiz.ariel@inifap.gob.mx; ramirez.gabriela@inifap.gob.mx; rubio.ernesto@inifap.gob.mx).
The weather is critical for the development of ecosystems and life on the planet, prolonged changes in its components cause changes in all living beings. In our country, concerning studies on the vulnerability of ecosystems against climate change information is scarce, usually focused on particular plant or animal species. This paper aims to delineate areas of the Mexican Republic that are sensitive to climate change. For this reason, we made a bioclimatic zoning based on the methodology Holdridge, identifying areas that correspond to transitional zones warm and dry-warm within the living spaces. We found that 29.61% ofthe continental area ofthe Mexican Republic is within transitional zones, where the temperature increases stipulated in RCP2.6 scenario for the period 2016 to 2035 of the IPCC cause considerable changes in the bioclimatic classification. A temperature increase of 0.3 °C will bring about changes in 17.25% ofthe estimated transition zones and 34.65% area if the increase was 0.7 °C, causing that its climatic characteristic locate them in warmer latitudinal regions and regions of drier humidity. The demarcation of sensitive areas to climate changes provides valuable information for research concerning adaptive capacity of ecosystems and the effects that climate change can cause a large scale.
Keywords: climate change; living areas; sensitivity; transitional
El clima es determinante en el desarrollo de los ecosistemas y la vida en el planeta, cambios prolongados en sus componentes provocarán alteraciones en todos los seres vivos. En nuestro país la información referente a estudios sobre la vulnerabilidad de los ecosistemas frente al cambio climático es muy escasa, generalmente enfocada a especies muy particulares de plantas o animales. El presente trabajo tiene como propósito delimitar zonas de la república mexicana que sean sensibles al cambio climático. Para ello se realizó una zonificación bioclimática basada en la metodología de Holdridge, identificando las áreas que corresponden a las zonas de transición cálida y cálida - seca dentro de las zonas de vida. Se obtuvo que 29.61% de la superficie continental de la república mexicana se encuentra en zonas de transición, en las que incrementos de temperatura estipuladas en el escenario RCP2.6 para el periodo 2016 - 2035 del IPCC provocará cambios considerables en la clasificación bioclimática. Un incremento de temperatura de 0.3 °C provocará cambios en 17.25% del total de la superficie estimada en zonas de transición y de 34.65% si el incremento fuera de 0.7 °C, provocando que sus características climáticas las ubiquen en regiones latitudinales más cálidas y regiones de humedad más secas. La delimitación de zonas sensibles a las variaciones climáticas proporciona una valiosa información para investigaciones referentes a las capacidades de adaptación de los ecosistemas y los efectos que el cambio climático puede causar a gran escala.
Palabras clave: cambio climático; sensibilidad; transición; zonas de vida
Introduction
The climate is a set ofweather conditions specific to a place, consisting of the amount of precipitation and temperature whose action influences the existence ofbeings subject to it. The changes experienced by the climate on climate history in a region and that persists for an extended period are called climate change and is due to both natural and anthropogenic causes (Crowley and North, 1988).
According to the Intergovernmental Panel on Climate Change (IPCC, 2013) the occurring climate change will impact different regions of the world, the warming of the climate system is unequivocal and since the 1950's, many observed changes is unprecedented. For all scenarios considered representative concentration pathways (RCP), except for RCP2.6 scenario is likely to have a temperature higher than 2 °C increase by 2100.
Future estimates of the effects of climate change predict that in Latin America are significant, irreversibly affecting ecosystems and the services they provide (Vergara et al., 2007). Figures from the World Bank (Bank) for disaster risk reduction indicate that Mexico is among the countries most vulnerable because its territory is highly exposed to the risk of direct adverse effects of climate change. Among the effects of climate change are reducing the availability ofwater, increased flooding, droughts, reduced agricultural yields and loss of biodiversity (Herran, 2012).
In countries within Central and South America have been studies on the effect on climate change on life zones Holdridge (Mendoza et al., 2001), with estimates reflected in his involvement on ecosystems. This is because in the living areas of Holdridge partnership as a natural unit proposed in which vegetation, animal activity and climate are all interrelated in a single recognized combination (Holdridge, 1996).
It is important to consider that a life zone represents the climatic conditions that influence the potential vegetation and ecosystem functioning and not the state of vegetation cover in a given time. The variables used for classification are factors that represent ecophysiological restrictions on plant growth (Lugo et al, 1999).
In our country there have been significant efforts in order to estimate the spatial distribution of climatic conditions under different models and scenarios developed by the IPCC (Roeckner et al, 1996; UNIATMOS, 2014) where the general trends are evident of increases in temperature (Trejo et al., 2007); however, information regarding studies on the vulnerability of ecosystems is quite low, usually focused on very particular plant or animal species.
One of the main constraints that exist, even in works where we have used the bioclimatic zoning system Holdridge experimental unit to the climate change scenarios, is the omission of the bioclimatic zones of transition, where ecosystems are particularly sensitive to climate change (Jiménez et al, 2010). An ecosystem is the set of species in a given area interacting with each other and with their environment. Mexico has a land area of 1 964 375 km2 therefore for analysis focused on the behaviour of ecosystems to changes in climate, it is convenient to define areas of study that yield meaningful information even with small variations of temperature increase and decrease rainfall.
In response to this need, the objective of this study is to perform a bioclimatic zoning based on model life zones Holdridge, defining the transition areas prone to warm-dry and warm which are particularly sensitive to increases in temperature and decreases in precipitation.
Materials and methods
A computer system bioclimatic zoning for the Mexican republic based on the methodology of Holdridge (Holdridge, 1996) was conducted. Biotemperature, potential evapotranspiration and the average annual precipitation was calculated. The estimation of climatic factors for zoning as a source of information was the data contained in the Quick Climatological Information Extraction (ERIC, III), container for the stations of the Mexican Institute of Water Technology (IMTA, 2013).
A historical series of climatological data was processed 1961-2003 range and spatial distribution of monthly maximum temperature, monthly minimum temperatures and
total annual precipitation was estimated, the result was a set of raster files with spatial resolution of0.001665 degrees of units arc. Estimating the sequence of the living areas was performed as shown in Figure 1.

Figure 1 Diagram of the sequence descriptor estimation living areas (CU) regions of humidity (RH), latitudinal regions (RL) and altitudinal regions (RA).
Biotemperature estimation, which is defined as the air temperature, about 0 °C and 30 °C, which determines the rate and intensity of the physiological processes of the plants (plant photosynthesis, respiration and transpiration are performed ) and the rate of direct evaporation of water contained in the soil and vegetation (Crivelli and Dzendoletas, 2002).
To calculate the average monthly biotemperature (BMM), there are three cases using the average monthly temperature (TMM):
If TMM is between 6 °C to 24 °C, the BMM equals TMM
If TMM is higher than 24 °C, the BMM equals f or the following formula:
 1)
1)
Where: BMM= monthly average biotemperature; TMM= Monthly average temperature; and Lat= latitude ofthe study area in degrees.
If TMM is less than 6 °C, the BMM equals f or the following formula:
 2)
2)
Where: BMM= monthly average biotemperature; TMaxM= maximum monthly temperature; and TMinM= minimum monthly temperatura
The mean annual bio-temperature (BMA) was estimated using the following equation.
 3)
3)
Where: BMA= annual average biotemperature; BMM= monthly average biotemperature; and n= number of months.
Potential evapotranspiration, which is the amount of water that can be evaporated directly from the soil and transpires natural vegetation in a stable state that is located on a soil of good characteristics and optimum moisture content was calculated (Samani, 2000). It was estimated by the following equation.
 4)
4)
Where: EP= potential evapotranspiration; and BMA= annual average biotemperature.
The ratio of potential evapotranspiration is a function of biotemperature and precipitation, is an index ofthe humidity that reflects the availability of water for plant growth and ecological processes (Holdridge, 1996; Lugo et al., 1999). It was estimated by the following equation.
 5)
5)
Where: REP= ratio of potential evapotranspiration; EP= potential evapotranspiration; and PMA= annual rainfall.
Once estimated each of the components required proceeded to use the nomogram "Holdridge" to identify bioclimatic zones. One of the main drawbacks of the classification system Holdridge is the use of logarithmic progressions in the nomogram, which limits its use practically only graphic interpretations. To correct this situation logarithmic nomogram units were transformed to linear units using the following equations:
 6)
6)
Where: Da= distance in linear scale; Vb value= transform; Li= lower limit ofeach range logarithmic scales; and 2/log2= constant associated with the spacing between the values of the logarithmic scales. 2 ensures that the distance between logarithmic graphs is 2 cm intervals.
 7)
7)
Where: Ci= corrected linear distance; Da= distance in linear scale; and Di= cumulative spacing intervals from the origin to the desired position.
The units conversion chart nomogram allowed to play in a Cartesian plane with linear units since its basic structures. The software used for this activity was the AutoCad®. Start assigning a coordinate (x, y) was possible to reconstruct each of the components of the nomogram in an environment that combines graphical and analytical tools (Figure 2).

Once plotted hexagons that make up the living areas and expressed in a Cartesian plane linear units was possible to obtain the centroids in x, y coordinates of each of them as well as the ranges that define each of the latitudinal regions altitudinal and moisture classification system.
A method to estimate the spatial location ofthe REP and PMA units developed coordinates x, y. For this it is first necessary to find the location of each value on its line of origin of the nomogram by equations.
 8)
8)
Where: x= X coordinate of the line of origin of the nomogram; 0= angle between the lines REP and PMA (60°); and Di= spacing intervals accumulated from the source to the desired position.
 9)
9)
Where: ya= Y coordinate of the line of origin of the nomogram; 0= angle between the lines REP and PMA (60°); and Di= spacing intervals accumulated from the source to the desired position.
We have that:
 10)
10)
Where: b= intercept m= slope of the line; and 0= ordinate of the origin of the nomogram.
Obtained values (xa, ya and b) for REP and PMA proceed to make use of the equation of the line for each of them.
 11)
11)
Where: y= value corresponding to the y-axis, x= X coordinate of the line of origin; nomogram; m= slope of the line; and b= intercept.
Finally, the equation system is solved and the result is a pair of coordinates (x, y) corresponding to a location within the nomogram.
Each of the hexagons of living areas has a centroid coordinates (x, y) therefore, the closest pair of coordinates resulting system of equations REP and PMA centroid will correspond to hex the living area that concerns. The altitudinal and latitudinal soils are well defined by the coordinate axis and within the grid while the moisture region is defined directly by the values of REP (Figure 3).

One of the most important characteristics of the nomogram Holdridge is the ability to identify areas hexagons transitional living areas (Figure 4). The main lines of the hexagons are the limits of each area of life. The biotemperature guide, precipitation and potential evapotranspiration ratio, lines form six triangles in each hexagon. These triangles are the transition areas. Within each triangle, two of the three main factors correspond to the same region, the same province of moisture or precipitation band corresponding to the main body of the hexagon. The third factor relates to the region, girdle, province or precipitation regime of the neighbour hexagon (Jiménez, 1993).

A software system written in C language, which performs the operations described above to pixel level, once we supply climate information in raster format was developed. This allows us to play the automated procedure being in a position to repeatedly test data both current and future scenarios of precipitation and temperature caused by climate change. In the analysis were not considered corrections for soil, water and atmospheric associations.
Validation of the model
In order to verify the veracity of the living areas, a comparison between the estimated and measured data areas directly in the field through the upheavals of the National Forest Inventory and Soil Project (INFyS) (CONAFOR, 2011) was performed. 24 sampling sites for each information regarding geographic location, dominance and species richness were selected (Table 1). By using the geographic location of each site was removed from the map of life zones and grade accordingly proceeded to make an assessment of the correlation as shown in the Table 2.


Concordance evaluation was performed by the Kappa coefficient (Cohen, 1960), using equation 12.
 12)
12)
Where: K = Kappa coefficient, N = number of elements; Xij = sum of the diagonal; Xc = sum of columns; and Xl = sum of lines.
According to the evaluation of agreement made, a value of 0.95 was obtained. The theoretical Kappa coefficient takes values between 0 (total disagreement) to 1 (full agreement) thus obtained the degree of agreement is almost perfect (Landis and Koch, 1977), demonstrating the validity of bioclimatic zoning.
Similarly, to assess the sensitivity of the transition zonez to climate change, we proceeded to make a comparison of the current status of bioclimatic zones regarding expected changes with temperature varations specified in the scenario for RCP2.6 period 2016-2035 the IPCC (IPCC, 2013)
Results and discussion
As a result of bioclimatic zoning a map was obtained with the areas of life that correspond to the Mexican republic, with other regions with humidity and latitudinal regions according to climatic characteristics.
According to the classification of areas of modern life, the classification forest dominates Mexico with 56.58% of the territory, followed by the thorny bush with 30.56%, 8.69% is desert scrub, 4.05% is made up ofdesert and finally 0.12% corresponds to steppe (Figure 5).

The distribution of moisture regions of the country are estimated at 37.32% in the humid sub region; 33.61% is semiarid; 9.88% is the arid region; 4.01% is extremely arid and 0.5% is dried. Furthermore, 1.21% the country belongs to the humid region and only 0.0005% is super humid region (Figure 6).

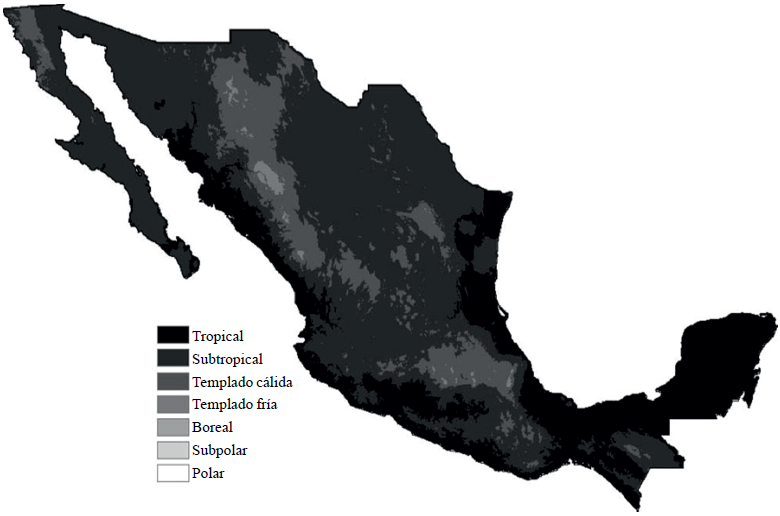
The estimated latitudinal regions correspond to 21.96% of the country as tropical; 48.44% were classified as subtropical; 28.25% corresponds to the warm temperate region; 1.28% belongs to the cold temperate region and finally 0.07% correspond to boreal regions, subpolar and polar (Figure 7).

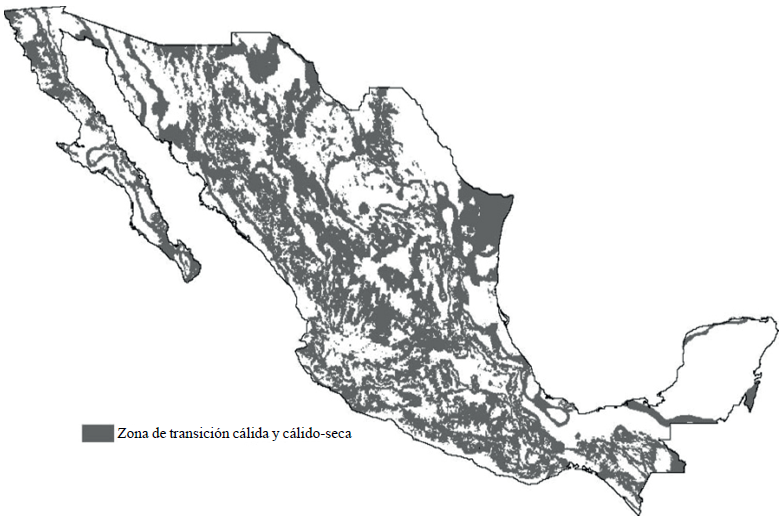
Using triangles correspond to areas of warm and dry-warm transition within areas of life, it was found that almost a third of the country (29.61%) is located in these transition zones; i.e. 581 613.86 km 2 of our country are particularly vulnerable to climate change, they consider small reductions in rainfall or temperature rises, will cause great changes in the composition of the ecosystems (Figure 8).
Result of the comparison ofthe current status ofbioclimatic zones regarding expected changes with temperature variations stipulated in the scenario RCP2.6 for the period 2016 to 2035 the IPCC are presented in Table 3. We can see the temperature increase of 0.3 °C will cause changes in current bioclimatic zones in 17.25% ofthe estimated surface as a transition zone, causing to locate its climatic latitudinal regions as warmer and drier regions of moisture. When the increase is 0.7 °C, changes in the transition surface increases to 34.65%. In Figures 9, 10 and 11, we can display the distribution of bioclimatic regions that would experience the Mexican republic, but these changes are more pronounced in the transition zones.
Table 3 Percentage ofchange experienced by transition zones in the presence ofsmall variations in temperature and precipitation.


According to the above, sensitivity was observed for bioclimatic transition zones against small changes in temperature and precipitation, thus confirming the importance of its delimitation.
Conclusions
Bioclimatic zoning system under the methodology of Holdridge was developed. By zoning was obtained 29.61% of the land area of Mexico was located in transitional areas, which makes them particularly sensitive to climate variations. An increase of 0.7 °C can produce changes to 34.65% causing said surfaces located in warmer regions and regions latitudinal drier moisture. The demarcation of sensitive areas to climate changes provides valuable information for future research concerning the adaptive capacities of ecosystems and the effects that climate change may cause on a large-scale.
Literatura citada
Centro de Ciencias de la Atmósfera Universidad Nacional Autónoma de México (UNIATMOS). 2014. Escenarios de cambio climático. 65 p. [ Links ]
Cohen, J. 1960. A coefficient of agreementfor nominal scales. Educ.Psycho. l Meas. 20:37-46. [ Links ]
Comisión Nacional Forestal (CONAFOR). 2011. Manual y procedimientos para el muestreo de campo re-muestreo 2011. Dirección Nacional. Guadalajara, Jalisco. 54 p. [ Links ]
Crivelli, E. y Dzendoletas, M. 2002. Una propuesta para extender el rango de aplicación de la clasificación climática de Holdridge. Ecología Austral. 12(1):49-53. [ Links ]
Crowley, T. J. and North, G. R. 1988. Abrupt climate change and extinction events in earth history. Science. 240:1095-9203. [ Links ]
Herrán, C. 2012. El cambio climático y sus consecuencias para América Latina. Proyecto Energía y Clima de la Fundación Friedrich Ebert - FES. México. 321 p. [ Links ]
Holdridge, L. R. 1996. Ecología basada en zonas de vida. Editorial IICA. San José, Costa Rica. 219 p. [ Links ]
Instituto Mexicano de Tecnología del Agua (IMTA). 2013. Extractor rápido de información climatológica. Eric III Versión 3.2. [ Links ]
Intergovernmental Panel on Climate Change (IPCC). 2007. Climate Change 2007, synthesis report. contribution of working groups I, II and III to the Fourth Assessment Report of the Intergovernmental Panel on Climate Change. IPCC, Geneva, Switzerland. 104 p. [ Links ]
Intergovernmental Panel on Climate Change (IPCC). 2013. Climate change 2013: the physical of working group i to the fifth assessment report of the intergovernmental panel on climate change. Stocker, T. F.; Qin, D. G.-K.; Plattner, M. Tignor, S.; Allen, K. Boschung, J.; Nauels, A.; Xia, Y. Bex, V. and Midgley, P. M. (Eds.). Cambridge University Press, Cambridge, United Kingdom and New York, NY, USA, 1535 p. [ Links ]
Jardel, P. E.; Morfín, R. E.;Alvarado, C. E.; Pérez, S. D. y Rodríguez, G. J. 2011. Memoria técnica caracterización, clasificación y mapeo de los regímenes potenciales de incendios en los ecosistemas forestales de México. 65 p. [ Links ]
Jiménez, M.; Chain, A. y Locatelli, B. 2010. Efectos del cambio climático en la distribución de zonas de vida en Centroamérica. Rec. Nat. Amb. 59(60):32-40. [ Links ]
Landis, J. R. and Koch, G. G. 1977. The measurement of observer agreement for categorical data. Biometrics. 33:159-174. [ Links ]
Lugo, A. E.; Baron, J. S.; Frost, T. P.; Cundy, T. W. and Dittberner, P. 1999. Ecosystem processes and functioning. Ecological stewardship: a common reference for ecosystem management. 2. Elsevier Science, New York. 30 p. [ Links ]
Mendoza, F.; Chévez, M. y González, B. 2001. Sensibilidad de las zonas de vida de Holdridge en Nicaragua en función del cambio climático. Revista Forestal Centroamericana. 443 p. [ Links ]
Oreskes, N. 2004. Beyond the ivory tower. The scientific consensus on climate change. Science.1103618. [ Links ]
Roeckner, E.; Arpe, K.; Bengtsson, L.; Christoph, M.; Claussen, M.; Dümenil, L.; Esch, M.; Giorgetta, M.; Schlese, U. and Schulzweida, U. 1996. The atmospheric general circulation model ECHAM-4: model description and simulation ofpresent-day climate Max-Planck Institute for Meteorology, Report Núm. 218. Hamburg, Germany. 90 p. [ Links ]
Samani, Z. 2000. Estimating solar radiation and evapotranspiration using minimum climatological data . J. Irrig. Drainage Eng. 126(4):265-267. [ Links ]
Tosi, J. A. 1997. An ecological model for the prediction of carbon offsets by terrestrial biota. Tropical Science Center. San José, Costa Rica. 32 p. [ Links ]
Trejo, I.; Hernández, L. J. y Villers, L. 2007. Afectación de las comunidades vegetales de México ante el cambio climático. Geopolítica, globalización y cambio ambiental: retos para el desarrollo latinoamericano. Bogotá, Colombia. 45 p. [ Links ]
Vergara, W.; Kondo, H.; Pérez, E.; Méndez, P. J.; Magana, R. V.; Martínez, A. M.; Ruiz, M. J.; Ávalos, R. G. and Palacios, E. 2007. Visualizing future climate in LatinAmerica: results from the application of the earth simulator. In: Latin America and Caribbean Region Sustainable Development Working Paper No. 30. The World Bank, Washington, DC. 82 p. [ Links ]
Received: October 2014; Accepted: January 2015
 Este es un artículo publicado en acceso abierto bajo una licencia Creative Commons
