


Servicios Personalizados
Revista
Articulo
 texto en
  Inglés (pdf)
 Artículo en XML
 Referencias del artículo
 Enviar artículo por email
Indicadores
-
 Citado por SciELO
 -
 Accesos
Links relacionados
-
 Similares en
SciELO
Similares en
SciELO
Compartir

 Permalink
Revista mexicana de ciencias agrícolas
versión impresa ISSN 2007-0934
Rev. Mex. Cienc. Agríc vol.5 no.spe10 Texcoco nov./dic. 2014
Articles
Climate change impact on the evaporation trends in the dam La Vega, Teuchitlán, Jalisco, Mexico
1Instituto Nacional de Investigaciones Forestales Agrícolas y Pecuarias-Campo Experimental Centro Altos de Jalisco. INIFAP. Carretera Tepatitlán-Lagos, Tepatitlán de Morelos, Jaliscokm 8. (flores.hugo@inifap.gob.mx; ruiz.ariel@inifap.gob.mx; chavez.alvaro@inifap.gob.mx).
2Universidad de Guadalajara. Centro Universitario de Ciencias Exactas e Ingenierías. Av. Revolución 1500. S. R. Guadalajara Jalisco. (arturo.figueroa@cucei.udg.mx).
Climate change impact on water resources is predicted as a potential problem, reducing the amount of water for agriculture, the industry and domestic use as well. A number of studies are underway to better understand this problem. In this research, five decades of meteorological data (1961-2009) were analysed to assess the effect of climate change on evaporation trends in the dam La Vega. The Mann-Kendall statistic was used to identify the trend of the meteorological variables; maximum temperature, minimum temperature, precipitation and evaporation as well as the potential evaporation of the dam La Vega. The results showed that during the period 1961-1969, only the evaporation showed significant upward with a value of S of 24 and a correlation coefficient of 0.7015. The period 1970-1979 showed positive and negative trends, for the maximum temperature the S value corresponded to 24, with a correlation coefficient of 0.4613, which represents a significant upward trend. Evaporation in this period had a negative trend with an S value of -25, with a correlation coefficient of0.4877, and a significant trend for decreasing. In the period of 1980-1989, the precipitation showed a negative trend with S value of -27 and correlation coefficient of 0.5324 with a significant decreasing trend. The periods 1990-1999 and 2000-2009, showed similar trends for maximum temperature and evaporation of the reservoir. For 1990-1999, the maximum temperature showed a positive trend with S value of 25, and a correlation coefficient of0.5447 and a significant upward trend. For the same period, the reservoir evaporation also showed a positive trend with S value of 29, correlation coefficient of0.6404 and significant upward trend. In the period 2000-2009, the maximum temperature presented an S value of 24 with correlation coefficient of0.6684 and significant upward trend. The evaporation ofthe reservoir had the same tendency with S value of 25, coefficient of correlation of 0.5911 and significant upward trend. We concluded that, the periods between 1961-1989 showed no significant trends in meteorological variables, on the contrary, the period 1990-2009 presented clear trends for the increasing maximum temperature and the evaporation ofthe reservoir. However, it is an expected behaviour due to the evaporation of a body of water depends largely on the ambient temperature and other environmental variables and characteristics of a natural water body. However, according to the results, the increased temperature might adversely affect evaporation loss in the dam La Vega.
Keywords: climate change; dam La Vega; evaporation
El impacto del cambio climático sobre los recursos hídricos se predice como un problema potencial, reduciendo la cantidad de agua para la agricultura, la industria y el uso doméstico. Una serie de estudios se están llevando a cabo para entender mejor este problema. En ésta investigación cinco décadas de datos meteorológicos (1961-2009) fueron analizados para evaluar el efecto del cambio climático en las tendencias de la evaporación en la presa La Vega. Se utilizó la estadística de Mann-Kendall para identificar la tendencia de las variables meteorológicas; temperatura máxima, temperatura mínima, precipitación y evaporación, así como la evaporación potencial de la presa La Vega. Los resultados mostraron que el periodo 1961-1969 sólo la evaporación del reservorio presentó tendencia significativa al incremento con un valor de S de 24 y un coeficiente de correlación de 0.7015. El periodo de 1970-1979 presentó tendencias positivas y negativas, para la temperatura máxima el valor S correspondió a 24, con un coeficiente de correlación de 0.4613, lo cual representa tendencia significativa al incremento. La evaporación en este periodo presentó tendencia negativa con un valor S de -25, con coeficiente de correlación de 0.4877 y tendencia significativa a disminuir. En el periodo de 1980-1989 la precipitación mostró tendencia negativa con valor de S de -27 y coeficiente de correlación de 0.5324 con tendencia significativa a disminuir. Los periodos 1990-1999 y 2000-2009, mostraron tendencias similares para el caso de temperatura máxima y evaporación del reservorio. Para 1990-1999 la temperatura máxima presentó tendencia positiva con valor de S de 25, coeficiente de correlación de 0.5447 y tendencia significativa al incremento. Para el mismo periodo la evaporación del reservorio también presentó tendencia positiva con valor S de 29, coeficiente de correlación de 0.6404 y tendencia significativa al incremento. En el periodo de 2000 2009 la temperatura máxima presentó un valor S de 24 con coeficiente de correlación de 0.6684 y tendencia significativa al incremento. La evaporación del reservorio presentó la misma tendencia con valor S de 25, coeficiente de correlación de 0.5911 y tendencia significativa al incremento. Se concluye que los periodos comprendidos entre 1961-1989 no mostraron tendencias notables en las variables meteorológicas, por el contrario el periodo comprendido entre 1990-2009 presentó tendencias claras al incremento para el caso de la temperatura máxima y la evaporación del reservorio. Sin embargo es un comportamiento esperado debido a que la evaporación de un cuerpo de agua depende en gran medida de la temperatura en el ambiente, así como otras variables ambientales y físicas propias de un cuerpo de agua superficial. Sin embargo, de acuerdo con los resultados obtenidos el incremento de la temperatura puede afectar de manera negativa la pérdida por evaporación en la presa La Vega.
Palabras clave: cambio climático; evaporación; presa La Vega
Introduction
Climate is a major factor for the activities that take place in the communities ( Charlton and Arnell, 2011; Murray et al, 2013). Scientific evidence has shown that climate change begins to manifest in various forms, including the intensity of rainfall and increased temperature and the sea level by the melting ofglaciers (Dunn et al, 2012; Koutroulis et al, 2013). When talking about climate change, temperature and precipitation are the most important components with alterations in behaviour patterns (Chaouche et al, 2010). The impacts of climate change can be reflected in changes in ecosystems by altering the diversity of plants and animals alike (Ostendorf et al., 2001; Gian-Reto et al, 2002; Haines et al, 2006; Heubes et al, 2013 ).
In addition, changes in temperature can also cause adverse effects on human health, higher numbers may result in heat waves causing illness and even death in susceptible communities (Paulin and Xiaogang, 2005; Onoz and Bayazit, 2012). Increasing trends in precipitation may also result in an increase in the frequency of floods negatively impacting water quality (Dore, 2005; Lensing and Wise 2007; Arnell et al., 2011; Lal, 2013).
There have been a large number of investigations related to climate change in developed countries which have experienced with supporting tools for the timely knowledge of certain events. On the other hand, it is important to note that, the developing countries are the ones that seem most affected by climate change globally. The affect has been observed in a broad context that has contributed to social changes (Gasper et al, 2011; Brugger and Crimmins, 2013). The effects of climate change on water resources in the United States have been studied by several authors. McBean and Motiee (2008) used 70 year old databases and analysed the trends in precipitation, temperature and flows in the Great Lakes of North America, using regression and statistics by Mann-Kendall. The results showed statistically significant increases in precipitation in the 1930-2000 period.
In Mexico, De La Mora-Orozco et al. (2011) estimated the effect of climate change in the concentration of dissolved oxygen (DO) in the Lake Chapala. Based on data from 1961-2003, 2031-2014 and projections for 2050-2060 performed using the model of Thomas Muller and variables including altitude, coefficient of reaeration, photosynthesis and respiration. OD results for 1961-2003 were homogeneous, but the model predicts that the OD at the Lake Chapala will be influenced by the temperature gradient and water circulation patterns in Lake Chapala. However, the model does not predict anoxic conditions in the lake for the simulated years. In addition, Martínez-Austria (2007) mentioned that water resources in Mexico are already under great pressure mainly due to population growth, social and economic development that have generated an increased demand.
Changes in climate can cause a significant negative effect on the quality and quantity ofwater (Moghaddasi and Mushtaq, 2011; Luo et al, 2013) and surface water bodies such as the dam La Vega are not exempt from the negative impacts that these changes may cause. As mentioned, the study of climate change impacts on water resources is of significant importance. This work focused on determining the annual trends in temperature and precipitation over a period of 5 to determine the impact of climate change on water resources ofthe dam La Vega in Teuchitlán Jalisco, Mexico.
Methodology
Study área
The dam La Vega is located in the municipality of Teuchitlán, in the centre of the State of Jalisco, in the geographical coordinates 20° 33' 50' and 20° 47' 40' north latitude; and 103° 47' 30' to 103° 51' 20' west longitude, at an elevation of1 300 meters. Bordering at the north with the municipalities, Tequila and Amatitán; south, Tala, Ameca and San Martín Hidalgo; east, Tala andAmatitán; and west, and Ahualulco de Mercado andAmeca, built for irrigation and flood control between 1952 and 1956. The total capacity of the vessel is 44 mm3 and the associated reservoir area is 1 950 hectares. It is vital that the dam service grants to agricultural producers in the area, as the main activity in the communities surrounding the reservoir is agriculture, especially the cultivation of sugarcane, maize and wheat (De La Mora-Orozco et al, 2013). The producers of sugarcane of the municipalities Teuchitlán, Ahualulco de mercado and Ameca are the main users; however, the producers of Ameca in the lower part of the dam occupy the largest area of cultivation of about 10 000 hectares, the main users and beneficiaries of the reservoir, Figure 1 shows the runoff of the basin of the dam The Vega.

Data collection
The series of analysed data included in the work were collected from the weather station number 14089, which is the closest to the dam La Vega and located at the following meteorológicos. Los parámetros meteorológicos fueron; precipitación (mm), temperatura máxima y mínima (°C), evaporación (mm) y pérdida por evaporación en la presa La Vega (mm/año), en el periodo 1961-2009 coordinates station: latitude 20° 35' 30' and longitude 103° 51' 30', 1 260 meters above sea level. Evaporation loss was calculated based on meteorological data. The meteorological parameters were; precipitation (mm), maximum and minimum temperature (°C), evaporation (mm) and evaporation loss in the dam La Vega (mm/year) in the period 1961-2009.
Data analysis
All the parameters were subjected to the following tests: statistical analysis and Mann-Kendall analysis. In the statistical analysis the mean, median, standard deviation and variance were determined, the parameters are listed below:
Arithmetic mean: the measure of central trend better known is the arithmetic mean. The average is obtained by summing all the observations divided by the number of n observations determined as follows:
 )1
)1
Median: The median of a finite set of values is the value that divides the set into two equal parts, so that the number of larger than or equal to the median value equals the number less than or equal to this value. The median of the data set is (n+1)/2-th observation, when the observations have been ordered.
Variance: when the values of a set of observations are located near the middle, the dispersion is less than when they are scattered.Accordingly, the dispersion can be measured based on the scattering of the values around their mean.
 )2
)2
Standard deviation: is a measurement of the dispersion of data, for obtain the dispersion measurement, the square root ofthe variance is obtained by the following equation:
 )3
)3
Coefficient of variation: the standard deviation is useful as a measure of variation in a given dataset. The coefficient of variation is the standard deviation expressed as a percentage of the average. The equation is:
 )4
)4
Evaporation calculation in the dam La Vega
Since we have no precise data ofthe tributaries to the dam La Vega to determine the evaporation by mass balance, is was determined using actual temperature data and calculation of solar radiation and relative humidity. Evaporation was determined using the Penman equation (1963) shown below:
 )5
)5
Where: H= solar radiation (cal/cm2); for Ea,Penman (1963) developed an empirical relationship.
Where: Ea=0.47 (0.5 + 0.01 u2) (ea'- (mm/day); u2= wind speed (mi/day); e2= vapour pressure of the water surface (mb); Δ/ γ = is in function of temperature.
Statistical method of Mann-Kendall
The statistical method of Mann Kendall is widely used for the analysis of climatic trends and hydrological time series (Chaouche et al, 2010). Some advantages of using this method is that it is a non-parametric method and therefore requires data normally distributed.Another advantage is that it has low sensitivity to shocks due to inhomogeneous data (Trajkovic and Gocic, 2013). Another advantage is that any undetected data is included giving a common value lower than the lowest measured value in the data series (Ay and Kisi, 2014). According to this method, the null hypothesis H0 assumes no trend and it is tested against the alternative hypothesis Hi, assuming a tendency (Ehsanzadeh et al.,2013).
The procedure for the analysis of Mann Kendall consider time series of a number n of data sites and Ti and Tj as two subgroups where:
i= 1, 2, 3, n-1 and j= i + 1, i + 2, i + 3,..., n each data of Ti is used as a reference point and is compared with all points Tj as:
 )6
)6
The Mann-Kendall statistic (S) is given by:
 )7
)7
A very high positive value of S is an indication of an increasing trend, and a very low value is indicative of a downward trend. However, it is necessary to calculate the probability associated with S ofn number ofsamples in order to quantify statistically significant trends (Hamed, 2008).
The variance of S and o was calculated with the following equation:
 )8
)8
Where=n corresponds to one data, g is the number ofunified groups (a unified group is a group of data with the same value); and tp is the number of data in the pth group.
In the sequence (2,3, not detected, 3, not detected, 3), then n= 6, g= 2, t= 2 for the undetected, and t= 3 for the 3 values unified.
The normalized analysis of Zs was calculated as follows:
 )9
)9
The statistical analysis Zs is used as a measure ofsignificance to this trend. In fact, the statistical analysis is used to analyse the null hypothesis Ho; there is no trend in the data. If Zs is higher than Za/2, where a represents the chosen significance level (typically 5% at Z0025= 1.96), then the hypothesis is null, this means that the trend is significant, therefore the cause of the tendency does not occurs randomly or occasionally ifthere is a factor that brings it.
Results and discussion
The Table 1 shows the results of statistical analysis of the maximum temperature, minimum temperature, precipitation and evaporation for the series of data obtained from the weather station 14089, located in the area of influence of the dam "La Vega" from 1961 to 2009. We observed that the highest value corresponded to the years 1961-1969 to 31.3 °C and the lowest value of 30.2 °C, corresponding with the average for the decade 2000-2009. The range ofthe standard deviation varied between 3.54-3.93 °C. Ruíz et al. (2012) reported similar values of maximum temperature, mínimum temperature, precipitation and average evaporation for the same weather station. The maximum and minimum value for the average minimum temperature corresponded to the decade of 1980-1989 and 2000-2009, with values of 13.4 °C and 11.7 °C, respectively. The range of the standard deviation corresponded to 4.93-7.89 (Table 1). The average precipitation (mm) for the 5 decades analysed showed that, the highest average observed corresponded to the period of 1961-1969 with a 2.63 mm, while the lowest value corresponded to the decade 1980-1989 to 2.42 mm. The standard deviation is presented in a range of 7.32-7.89.
Table 1 Statistics of the average maximum temperature of 1961 to 2009, data series of the weather station 14089 in Teuchitlán, Jalisco.

The maximum evaporation was made in the period 1961 1969 to 4.97 mm, and the minimum value observed corresponded to the period 2000-2009 to 4.08 mm. The range of the standard deviation ranged from 4.60-3.85. The Table 1 also shows the average evaporation of the dam La Vega for the years 1961-2009. The highest value was recorded in the period 1980-1989, with a value of 144 mm, while the lowest value was recorded in the years 2000-2009. The standard deviation fluctuated in a range of 6.46-2.64.
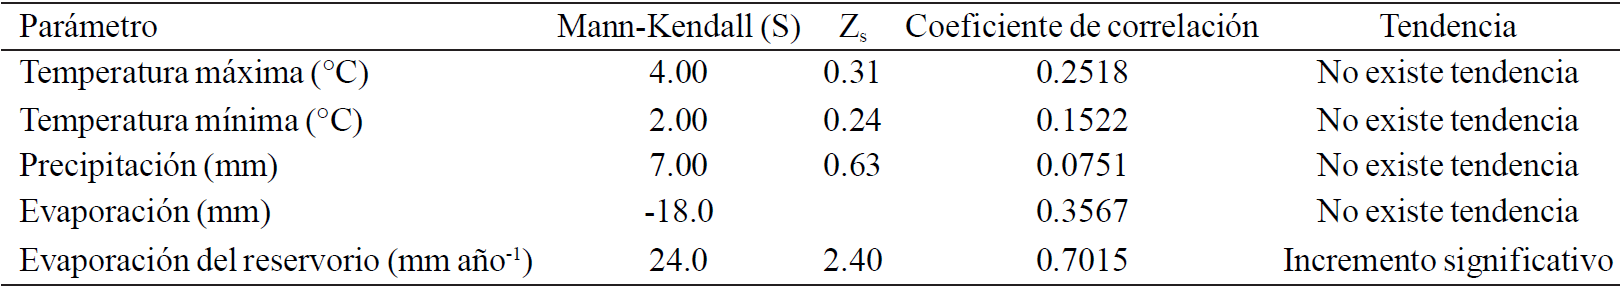
The results of the Mann-Kendall statistic (S) and Zs for the period 1961-1969 are presented in the Table 2 The results showed a positive value S of 24 and Zs of 2.4, for the case of precipitation in this period, with a correlation coefficient of 0.7015. These values indicated a significant increase in the trend in evaporation of the dam La Vega between 1961 and 1969. This trend is shown graphically in Figure 2. The maximum temperature, minimum temperature, precipitation and evaporation showed no trend at all.

In the period comprising 1970-1979, we observed a significant upward trend in the maximum temperature, with a value S of 24 and Zs of 2.06, with a correlation coefficient of 0.4613. While evaporation showed a significant tendency to decrease with a negative S value of -25 and Z s -2.15. Precipitation and evaporation ofthe reservoir showed no trend, the results are shown in the Table 3.

The Table 4 shows the trend of the different meteorological variables included in the analysis for the period 1980-1989. Rainfall had a negative significant trend, indicating decreased rainfall in this period. The Mann-Kendall statistic showed a negative value S of -27 and Zs of -2.33 with a correlation coefficient of 0.5324. The variables ofmaximum temperature, minimum temperature, evaporation, and evaporation of the reservoir showed no trend at all.

The Table 5 shows the trends ofall the variables analysed for the period 1990-1999. During this period, positive values of S to the maximum temperature and evaporation of the reservoir 25 and 29, respectively with Zs value of 2.15 for the maximum temperature and 2.50 for the evaporation of the reservoir. With correlation coefficient of0.5447 for the maximum temperature and 0.6404 for the evaporation of the reservoir. The trend was presented as significant upward for maximum temperature and evaporation loss from the reservoir. The Figure 3 shows the trend of the evaporation of the reservoir for this period. The minimum temperature, precipitation and evaporation showed no trend at all.


The Table 6 shows the trends of weather variables over the period 2000-2009. There were similarities in trends with the period of1990-1999, where only the maximum temperature and evaporation of the reservoir showed positive value S of 24 and 25, respectively. With correlation coefficient of 0.6684 and 0.5870 at the maximum temperature for the evaporation of the reservoir. Both variables showed significant upward trend. The minimum temperature, precipitation and evaporation showed no trend. The Figure 4 shows the trend ofevaporative loss ofthe dam La Vega for the period 2000-2009.


It is noteworthy that, even though in some cases the results showed a positive value of S, the trend was not significant, these results are consistent with those found by Nalley et al. (2013) , using the Mann-Kendall method to analyse the trends in surface temperature in Ontario and Quebec, Canada. Furthermore, Hamed (2008) mentioned that a high value of S is an indicator of an increasing trend; however, a low value of S represents a downward oftrend. This theory is confirmed in this investigation, since the values S of 24 corresponded to the increase significant trends. In contrast, the variables with a value S of 20 showed no trend at all.
Although the results from the analysis of the trend of evaporation at the dam La Vega in this study showed significant tendency to increase, Badawy (2009) mentioned that the evaporation is also determined by other variables such as air temperature and humidity as well as wind speed. Badawy applied a prediction model for 2050 and concludes that while evaporation is expected to increase in 2050 due to the increase of temperature, the results showed a negative increase for evaporation. Furthermore, Liu and Yang (2010) mentioned that precipitation plays a decisive role in evapotranspiration.
Conclusions
The use of the Mann-Kendall method identified trends in data series from 1961-2009 of maximum temperature, minimum temperature, precipitation, evaporation and evaporation of the dam La Vega. The results showed that, the periods between 1961-1989 presented no clear trends in the variables analysed; however, a different behaviour was observed in the period 1990-2009, where the trends of increasing the maximum temperature is determined as significant. According to the results in this research in the analysis of Mann Kendall, the evaporation loss in the dam La Vega was increased in the period 1990-2009 due to the increased maximum temperature. Measurement is recommended in field for the variables such as wind speed, relative humidity and solar radiation for use them as dynamic variables, which will increase the certainty of the trends and forecast models in future researches. Furthermore, the increase in temperature directly affects the evaporation of surface water, thus, increasing evaporation as a response is a expected condition. In general, according to the results, increase s in temperature might adversely affect evaporation at the dam La Vega.
Literatura citada
Arnell, N. W. 1999. Climate change and global water resources. Global Environmental Change, 9(1):31-49. [ Links ]
Arnell, N. W.; Van Vuuren, D. and I. Morna, P. 2011. The implications of climate policy for the impcats ofclimate change on global water resources. Global Environmental Change. 21(2):592-603. [ Links ]
Ay, Murat and Kisi, O. 2014. Comparison of Mann-Kendall and innovative trend method for water quality parameters of the Kizilirmak River, Turkey. J. Hydrol. 513: 362-375. [ Links ]
Badawy, H. A. 2009. Effect of expected climate changes on evaporation. Thirteenth International Water Technology Conference, IWTC, Hurghada, Egypt. 10 p. [ Links ]
Brugger, J. and Crimmins, M. 2013. The art of adaptation: living with climate change in the rural American Southwest. Global Environmental Change. 23(6):1830-1940. [ Links ]
Chaouche, K.; Neppel, L.; Dieulin, C.; Pujol, N.; Ladouche, B.; Martin, E.; Salas, D. and Caballero, Y. 2010.Analyses ofprecipitation, temperature and evaporation in a French Mediterranean region in the context of climate change. Comptes Rendus Geoscience. 342 (3):234-243. [ Links ]
Charlton, M. B. and Arnell, N. W. 2011. Adapting to climate change impacts on water resources in England and assessment of draft water resources management plans. Global Environmental Changes. 21(1):238-248. [ Links ]
De La Mora-Orozco, C.; Flores-López, H. E. y Durán-Chávez, A. A. 2013. Calidad del agua del embalse de la presa La Vega y su impacto en las tierras agrícolas bajo riego. Libro técnico Núm. 6. INIFAP. 171 pp. [ Links ]
De La Mora-Orozco, C., Flores-López, H. E.; Durán-Chávez, A. A. y Ruiz-Corral, J. A. 2011. Cambio Climático y el impacto en la concentración de oxígeno disuelto en el Lago de Chapala. Rev. Mex. Cienc. Agríc. 2:381-394. [ Links ]
Dore, M. H. I. 2005. Climate change and changes in global precipitation patterns: what do we know? Environ. Int. 31(8):1167-1181. [ Links ]
Dunn, S. M.; Brown, I.; Sample, J. and Post, H. 2012. Relationships between climate change, water resources, land use and diffuse pollution and the significance ofuncertainty in climate change. J. Hydrol. 434-435:19-35. [ Links ]
Ehsanzadeh, E.; Saley, H. M.; Ouarda, T. B. M. J.; Burn, D. H.; Pietroniro, A.; Seidou, O.; Charron, C. and Lee, D. 2013. Analysis of changes in the Great Lakes hydro-climatic variables. J. Great Lakes Res. 39(3):383-394. [ Links ]
Gasper, R.; Blohm, A. and Matthias, R. 2011. Social and economic impacts of climate change on the urban environment. Current Opinion in Environmental Sustainability. 3(3):150-157. [ Links ]
Gian-Reto, W.; Post, E.; Convey, E. P.; Menzel, A.; Parmesan, C.; Trevor, J. C.; Beebee, J. C.; Fromentin, J. M.; Hoegh-Guldberg, O. and Bairlein, F. 2002. Ecological responses to recent climate change. Nature. 416:389-395. [ Links ]
Haines, A., Kovats, R. S., Cambell-Lendrum, D. and Corvalan, C. 2006. Climate change and human health: Impacts, vulnerability and public health. Public Health. 120(7):585-596. [ Links ]
Hamed, K. H. 2008. Trend detection in hydrologic data: the Mann-Kendall trend test under the scaling hypothesis. J. Hydrol. 349(3-4):350-363. [ Links ]
Heubes, J.; Schmidt, M.; Stch, B.; García Marquez, J. R.; Witting, R.; Thiombiano, A.; Sinsin, B.; Schaldach, R. and Hahn, K. 2013. The projected impact of climate and land use change on plant diversity: An example from West Africa. J. Arid Environ. 96:48-54. [ Links ]
Koutroulis, A. G.; Tsanis, L. K.; Daliakopoulos, L. N and Jacob, D. 2013. Impact ofclimate change on water resources status: a case study for Crete Island, Greece. J. Hydrol. 479:146-158. [ Links ]
Lal, Rattan. 2013. Food security in a changing climate. Ecohydrol. Hydrobiol. 13(1):8-21. [ Links ]
Lensing, J.R. and D.H. Wise . 2007. Impact ofchanges in rainfall amounts predicted by climate-change models on decomposition in a deciduous forest. Appl. Soil Ecol. 35(3):523-534. [ Links ]
Liu, Q. and Yang, Z. 2010. Quantitative estimation of the impact ofclimate change on actual evapotranspiration in the Yellow River Basin, China. J. Hydrol. 395(3-4):226-234. [ Links ]
Luo, Y.; Ficklin, D. L.; Liu, X. and Zhang, M. 2013. Assessment of climate change impacts on hydrology and water quality with a watershed modeling approach. Science of the Total Environment. 450-451:72-82. [ Links ]
Martínez-Austria, P. F. 2007. Efectos del cambio climático en los recursos hídricos de México. SEMARNAT. Instituto Mexicano de Tecnología del Agua. 61 p. [ Links ]
McBean, E. And Motiee, H. 2008. Assessment ofimpact ofclimate change on water resources: a long term analysis of the Great Lakes of North America. Hydrol. Earth System Sci. 12:239-255. [ Links ]
Moghaddasi, M. and Mushtaq, S. 2011. Evaluating the potentials of deficit irrigation as an adaptive response to climate change and environmental demand. Environ. Sci. Policy. 14(8): 1139-1150. [ Links ]
Murray, S. J.; Foster, P. N. and Prentice, I. C. 2012. Future global water resources with respect to climate change and water withdrawals as estimated by a dynamic global vegetation model. J. Hydrol. 448-449:14-29. [ Links ]
Nalley, D.; Adamowski, J. Khalil, B. and Ozga-Zielinski, B. 2013. Trend detection in surface air temperature in Ontario and Quebec, Canada during 1967-2006 using the discrete wavelet transform. Atmospheric Res. 132-133:375-398. [ Links ]
Onoz, B. And Bayazit, M. 2003. The power of statistical test for trend detection Turkish. J. Eng. Env. Sci. 27:247-251. [ Links ]
Ostendorf, B.; Hilbert, D. W. and Hopkins, M. S. 2001. The effect of climate change on tropical rainforest vegetation pattern. Ecol. Modelling. 145(2-3):211-224. [ Links ]
Paulin, C., and Xiaogang, S. 2005. Identification of the effect of climate change on future design standards of drainage infrastructure in Ontario. Final report. Master University Department of Civil Engineering 1280 Main Street West Hamilton, Ontario, Canada L8S 4L7. 61 pp. [ Links ]
Penman, H. L. 1963. Vegetation and hydrology. Tech. Comm. No. 533. Harpenden, England: Commonwealth Bureau of Soils. 125pp. [ Links ]
Ruiz-Corral, J. A.; Flores-López, H. E.; Regalado-Ruvalcaba, J. R. y Ramírez-Díaz, G. 2012. Estadísticas climáticas normales del estado de Jalisco. Libro técnicoNúm. 2. INIFAP. 350 pp. [ Links ]
Trajkovic, S. and Gocic, M. 2013. Analysis of changes in meteorological variables using Mann Kendall and Sen's slope estimator statistical tests in Serbia. Global and Planetary Change. 100:172-182. [ Links ]
Received: June 2014; Accepted: November 2014
 Este es un artículo publicado en acceso abierto bajo una licencia Creative Commons
