


Services on Demand
Journal
Article
 text in
  English (pdf)
 Article in xml format
 Article references
 Send this article by e-mail
Indicators
-
 Cited by SciELO
 -
 Access statistics
Related links
-
 Similars in
SciELO
Similars in
SciELO
Share

 Permalink
Revista mexicana de ciencias agrícolas
Print version ISSN 2007-0934
Rev. Mex. Cienc. Agríc vol.5 n.spe10 Texcoco Nov./Dec. 2014
Articles
Potential impact of climate change on the peach producing region in Zacatecas, Mexico
1INIFAP-Campo Experimental Zacatecas, Carretera Zacatecas-Fresnillo km 24.5, Calera, Zacatecas, 98600, México.
2INIFAP- Campo Experimental Centro-Altos de Jalisco, Carretera libre Tepatitlán-Lagos de Moreno km 8, Tepatitlán, Jalisco, 47600, México.
4INIFAP-Sitio Experimental Metepec, Carretera Toluca-Zitácuaro km. 4.5, Vialidad Adolfo López Mateos s/n, Zinacantepec, Estado de México, 51350, México.
4INIFAP-Campo Experimental Pabellón, Carretera Aguascalientes-Zacatecas km 32.5, Pabellón de Arteaga, Aguascalientes, 20660, México.
5INIFAP-Campo Experimental Cotaxtla, Carretera Veracruz-Córdoba km 34.5, Medellín de Bravo, Veracruz, México.
In the State of Zacatecas is located the most important region planted with native peach under rainfed conditions of Mexico with a surface of 12 025 ha. Currently, worldwide is accepted that globally there is a phenomenon of global atmospheric warming and that in part is due to the increase in the concentration of the so-called "greenhouse gases". A retrospective analysis of climate change indices for peach under rainfed was conducted. We used temperature anomalies for the period 2011-2060, estimated with an assembly of10 global climate models (GCMs) for generating maps of future temperatures using the climate of reference from 1961 to 2003. With these maps of temperature, we obtained maps of cold hours for five future scenarios. The retrospective analysis showed a trend in the increase of the maximum and minimum temperature and consequently a decrease of cold in the winter period. With future scenarios of cold hours the average hours and decreased surface areas with higher cold accumulation and increase in areas with lower accumulation of cold production areas decrease was quantified. The results show the decline ofthe winter cold; however, since peaches are grown medium to low cold requirement, it is considered that in the short to médium term there will be no impact of the decline in cold hours on the growth and development of peach. However, in the medium term it will be convenient the introduction and evaluation of varieties with low cold requirement such as 'Victoria Temprano', 'Fred' and 'Michele'. In the long term well have to find niches with higher accumulation of cold or varieties with low cold requirement.
Keywords: Prunus pérsica L. Batsch.; cold hours; global warming
En el estado de Zacatecas se localiza la región cultivada con durazno criollo bajo condiciones de temporal más importante de México con una superficie establecida de 12 025 ha. Actualmente a nivel mundial es aceptado que globalmente existe un fenómeno de calentamiento atmosférico global y que en parte ha sido consecuencia del aumento en la concentración de los llamados "gases de efecto invernadero". Se realizó un análisis retrospectivo con índices de cambio climático para la zona duraznera de temporal. Se utilizaron anomalías de temperatura para el período 2011-2060, estimadas con un ensamble de 10 modelos de circulación general, para generar mapas de temperatura futura a partir de la climatología de referencia 1961-2003. Con éstos mapas de temperatura se obtuvieron mapas de horas frío para cinco escenarios futuros. El análisis retrospectivo mostró tendencia en el incremento de la temperatura máxima y mínima y como consecuencia un decremento del frío en el periodo invernal. Con los escenarios futuros de la acumulación de horas frío se cuantificó la disminución promedio de las horas, así como la disminución de la superficie de las áreas con mayor acumulación de frío y el aumento de las áreas con menor acumulación de frío en las zonas de producción. Los resultados evidencian el decremento del frío invernal; sin embargo, dado que los duraznos cultivados son de mediano a bajo requerimiento de frío, se considera que a corto y mediano plazo no habrá impacto de la disminución de las horas frío sobre el crecimiento y desarrollo del durazno. No obstante, a mediano plazo será conveniente la introducción y evaluación de variedades con bajo requerimiento de frío como 'Victoria Temprano', 'Fred' y 'Michele'. A largo plazo, habrá que buscar nichos con mayor acumulación de frío o variedades con bajo requerimiento de frío.
Palabras clave: Prunus pérsica L. Batsch.; calentamiento global; horas frío
Introduction
Many changes have been observed in the global climate over the past century. The increase in the concentration of carbon dioxide has been the main factor that caused warming in the last 50 years. The global average air temperature has increased since 1970. All climate models project that emissions of heat-trapping gases caused by humans, will cause further warming. Based on scenarios that assume no climate policies to reduce emissions of greenhouse gases, it is expected that the global average temperature increases between 2 and 11.5 °C by the end of this century (UNEP, 2009).
Folland et al. (2001) indicated that during the second half of the twentieth century, the global average air temperature increased 0.6 °C. However, this heating was not uniform in space or time. Usually, the detection of climate change is more often associated with the analysis ofchanges in extreme events to changes in the average climate variables (Katz and Brown, 1992). Recently, considerable efforts have been made to estimate not only the changes in average temperature series, but also changes in the frequency, intensity and duration of extreme events (El Kenawy et al, 2011).
It is predicted that, the climate change will significantly affect all human activities, including agricultural productivity mainly in marginal areas (Conde et al., 2004). Recent studies have shown that the temperature of the agricultural areas of Mexico has been increasing noticeably since the early nineties (Ruiz et al., 2010; Zarazúa-Villaseñor et al, 2011). However, trends presented regionally different patterns even locally, detecting increases in temperatures in some cases, while in others decreases were detected (Carlón and Mendoza, 2007; Brito-Castillo et al., 2009; Santillán-Espinoza et al., 2011).
In Mexico, there is a concern about climate change and its potential impacts on the primary production sector, because few documented quantitative studies focused on agricultural areas still exist (Tejeda and Rodríguez, 2007). Studies have been conducted on the subject of climate change and its impact on agriculture, but few have analysed in detail the effects on product systems in particular, limiting the design of adaptation strategies to climate change in this sector (Ruiz et al., 2011).
With regard to temperature anomalies seasonally, four seasons show a general warming since the mid-seventies (Jones et al, 2009). This trend has extended the frost-free period in several regions of middle and high latitudes, with a 10% decrease in the number of days with frost globally (Salinger, 2005).
Fruit trees require cold temperate climate during the winter season, the first to break winter dormancy and second to produce economically viable yields. Global warming has the potential to reduce the available cold in the winter and affect production. Several researchers have predicted a decrease in the accumulation of the cold winter in many regions of the world in future climate scenarios using general circulation models and other methodologies (Jindal and Mankotia, 2004; Baldocchi and Wong 2008; Luedeling et al. 2009; Yu et al., 2010; Luedeling et al., 2011). Medina et al. (2011) found a reduction in cold units in the apple growing region of the State of Chihuahua in Mexico.
In Mexico, the planted region with peach under rainfed conditions in 2012 area was 29 388 ha. The States with the largest areas are Zacatecas, cultivating 12 025 ha (40.9%), Michoacán 2 949 ha (10%) and Puebla 2 880 ha (9.8%), which together account for 60.8% of the planted area and nearly 45% domestic production of this fruit (SIACON, 2013a). In the same year, in the State of Zacatecas 94.6% of the cultivated peach under rainfed surface was located in the municipalities of Sombrerete (4 336 ha), Calera (2 814 ha), Jerez (1 994 ha), Fresnillo (1 778 ha) and Enrique Estrada (450 ha) (SIACON, 2013b).
The peach requires between 400 and 1000 h cold (CH) during the winter period (Westwood, 1993). This is why there are cultivars of low cold requirement (<400 CH) medium requirement (400-650 CH) and high cold requirement (> 750 CH). Regarding the cold requirements in Mexican genotypes, Zacatecas require between 250 and 650 CH (Pérez, 1995). In Mexico the tendency is to grow varieties of peach of low cold requirement such as: San Juan, Azteca and Supremo 200 CH, Cardenal, Diamante, Oro Azteca and Regio 250 CH, Oro San Juan 275, Toro 300 CH and Tlaxcala 450 CH (Espíndola et al., 2009). In the State of Zacatecas so far no problems have been reported of accumulation of cold repeatedly in peach production regions.
In order to have sufficient information to design and implement adaptation measures to avoid or minimize, as possible, the negative impacts of climate change, it is necessary to estimate future climate scenarios, the availability of agroclimatic resources, including the accumulation of cold, in order to achieve proper planning of agricultural development in the short, medium and long term in this region.
Materials and methods
The study was conducted in peach region of the State of Zacatecas, Mexico, which is located between 102° 30' 00" and 103° 52' 12" west longitude and 22° 30' 00" and 24° 00' 00" north latitude and includes the municipalities of Sombrerete, Calera, Jerez, Fresnillo and Enrique Estrada (Figure 1).

Figure 1 Location of peach producing municipalities under rainfed in the State of Zacatecas, Mexico.
The first part of the study was to conduct a retrospective analysis to determine whether they are objective in the region experiencing a change in temperature. For this, a series stations of the National Water Commision (CONAGUA) with the largest number of data located whitin the selected region.
We used the program RClimDex Ver.1.0 developed by Zhang and Yang (2004) , Meteorological Service of Canada, for climate change indices we used the following methodologies by Zhang et al. (2005) and Haylock et al. (2006). RClimDex is a free program (http://etccdi.pacificclimate.org/software.shtml) running on the R platform (http://www.r-project.org/). RClimDex provides a total of 27 indices (including temperature and precipitation indices); however, to better explain the behaviour ofthe temperature in the study region, only seven indices based on data ofmaximum and minimum temperature were chosen (Table 1).

The second part of the study was the estimation of future climate scenarios for the study area. In this part we used the database ofmonthly mean temperature anomalies obtained model assembly (10 global general circulation models) for the emission scenario A2 greenhouse gases (IPCC, 2007) developed by Magaña and Caetano (2007). Values of monthly mean temperature anomalies were obtained at the national level for the years 2000-2060.
Later, we used as a reference of the current climatology the Environmental Information System (CIS) of the National Research Institute for Forestry, Agriculture and Livestock (INIFAP) for the period 1961-2003 (Ruiz et al, 2003). The latter information is worked into raster format algebraically adding future anomalies estimated by Magaña and Caetano (2007) , and thus calculating the values of monthly mean temperature for the years 2011 to 2060. Once the monthly las average temperatures were estimated for each one of those years, monthly average temperatures for the five future scenarios were obtained: 1) 2011-2020; 2) 2021-2030; 3) 2031-2040; 4) 2041-2050; and 5) 2051-2060. For each of these scenarios the minimum temperatures for the months of November to February were estimated using regression models "SIA" from the mean temperature variation, having SIA images of mean and minimum temperatures for the months of November to February in the five future scenarios.
In order to have pictures of cold hours (CH) for the months of November to February and scenarios, these were estimated from daily data of maximum and minimum temperature of 2 642 stations for the period 1961-2003. To this end, first time temperatures were estimated using a sine function (Snyder, 1985), with which the CH was quantified between 0 and 7 °C, temperature range where the fruit accumulate cold (Luedeling et al, 2009) in the months of November to February in the State of Zacatecas (Medina and Ruiz, 2004).
With the H" quantified daily for the entire time series for each station, monthly averages were estimated, generating then nonlinear models (Gompertz) (Eq.1) with the Statistical Analysis System (Version 9.1; SAS Institute, Cary, NC, USA) between the monthly averages of CH and monthly average minimum temperature for the corresponding month, which were used to estimate monthly CH from the minimum temperature maps SIA. The resulting models were applied to the GIS Idrisi (Eastman, 2012). The adjusted model for the month of January is presented.
 )1
)1
Where: a= asymptote; b= rate of development or pending; c= inflection point.
After obtaining the maps CH of the current climatology and the five future scenarios, these maps were obtained from the monthly averages of CH in major agricultural areas of the five municipalities that comprise the region (Figure 2). Within these agricultural areas the peach orchards are located, which does not mean that all agricultural areas are planted with this fruit. Maps CH ranges were also classified into 50 units and the number of acres of each range was obtained in agricultural areas of the region in different scenarios. Finally, based on the analysis of information, some adaptation measures to climate scenarios studied in the Zacatecas area were proposed.

Results and discussion
The slopes of the generated models were found to be positive and others negative; i.e., the temperature behaviour was different in the seven selected stations (Table 2). However, trends clearly indicate that the increase in temperature in the historical series of stations is observed. The first three indices in Table 2 correspond to the maximum temperature and considering together the values of the slopes of these three indices in seven seasons, 13 of 17 slopes were positive; this means a trend toward increasing maximum temperature. Monthly maximum daily minimum temperature index (TNx) and minimum monthly daily minimum temperature index (TNn) taken together, show positive slopes values in 11 of14, suggesting a same way an increase in minimum temperature. The remaining two indices, number of days with frost (FD0) and cold nights (TN10p), were negative trend in December 10 slope values, indicating a decreasing trend in the number of days with icy cold and percentage respectively nights. The retrospective analysis by estimating rates of climate change shows a trend towards increasing the temperature in the study region; which leads to a decrease ofthe CH in the winter period.
Table 2 Slopes of adjusting models of climate change indices for each station.

*,**outstanding significantly different from zero (p≤ 0.05), (p≤ .01); NS Not significant; NE Not estimated; TXx= value maximun dayly temperature percentage of days; TX90p= percentage of days when TX > 90 loeswest percentage; WSDI= for at least 6 consecutive days in wich number in TX > 90 loweste pecentage; FD0= number of days in a year when TN (mínimum daily) < 0 ºC; TNx= value if maximun daily minimum temperature. TNn= value of maximun daily minimum daily temperature; TN10p= percentage of days when TN < 10 iésimo percentile.
The models obtained with normal historical averages (1961-2003) for each of the months of November to February, considering the CH as the dependent variable are shown in Table 3. In all cases the value of R2 was higher than 90%, which means that the predictive models are acceptable.
Table 3 Coefficients of the variables in the models (Gompertz) of prediction for the production of monthly CH.

The application of predictive models with current and future climate scenarios was run with the GIS Idrisi (Eastman, 2012), producing maps of CH accrued for the period from November to February (Figure 3). In the figures is shown that, as we move forward in stages, the area ofthe intervals with as much cold reduces, as are the ranges of 700 to 750 or over 750 CH. In contrast, the area ofthe intervals with fewer CH ranges between 450 and 600, increases. The latter clearly predicts that the amount ofcold accumulated during the winter period will decrease, which supports findings previously noted by Medina et al. (2011) and Jindal and Mankotia (2004) .

Figure 3 Cold hours accumulated for the period from November to February for the current climate (A) and five future scenarios (B, C, D, E and F) in the peach region of the State of Zacatecas.
While the maps of future scenarios for municipalities were obtained, monthly averages of CH estimated specifically in areas already identified in Figure 3. The results suggest that in the current climate (1961-2003) to stage five (2051-2060), the accumulation of CH decrease of 688.2 CH to 558.4 CH, respectively; i.e., there will be a spread of CH ~ 130 between both periods (Table 4); situation that has been presented to other fruit growing areas (Baldocchi andWong, 2008;Yu et al., 2010).
Table 4 Average monthly cold hours in the most important peach regions of the State of Zacatecas, Mexico.
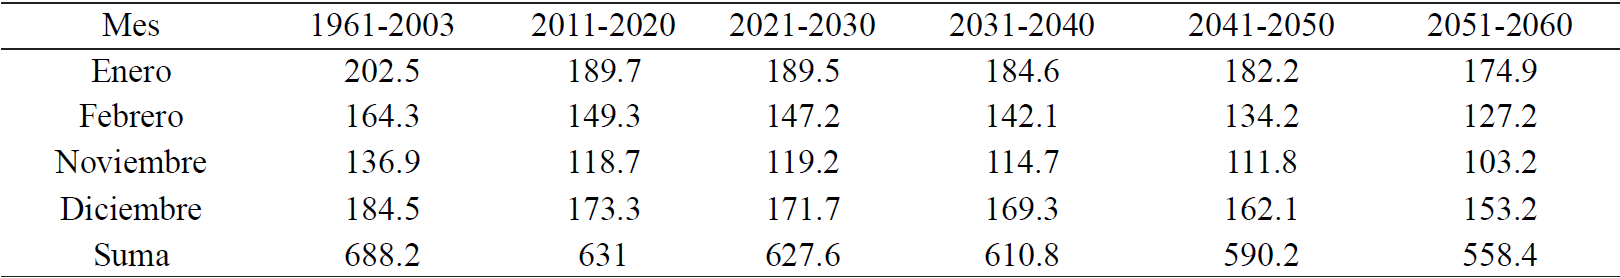
In the peach region of Zacatecas, most of the area planted with native peach is of medium cold requirement (400-650 CH) (Pérez, 1995). According to the results of Table 4, in the period 1961-2003, on average, cold accumulation was enough for peach. In future scenarios, the average accumulated in the cold winter period will decrease to the point that during the period 2041-2050 the CH cumulative average fall below 600 CH.
Even though, the amount of accumulated cold in the winter period will decrease as we move forward in the medium term, CH will be higher than 600, so it is considered that there will be no difficulty in accumulating cold for this fruit in areas where it is currently grown in the State of Zacatecas. In the same Table 4, the results suggest that the four months will have a similar decrease in the cumulative amount of cold, which will be approximately 30 CH for the 2051-2060 scenario.
On the other hand, maps ofcold accumulation were classified by intervals of 50 CH units and the number of acres for each interval was obtained in peach areas in different scenarios (Table 5). In the first two ranges of 500-600 CH as we move on to the future scenarios, the amount of surface increases; that is, the area increases but the cold, since they are with little intervals CH, which increases with decreasing cold surface ofthese areas. On the contrary, the surface at intervals with more cold (from 650 to 750) decreases with decreasing amount of cold. In other words, the surface ranges colder goes toward warmer ranges, showing a clear decrease of cold in the future (Fisher et al, 2002; Luedeling et al., 2009).
Table 5 Number of hectares in different intervals of cold hours in the period from November to February in the most important peach areas in Zacatecas, Mexico.

According to these results, the landrace peach of rainfed in regions where it is currently grown in the State ofZacatecas, apparently of short term will have no problem in meeting the requirements of winter cold as the surface with CH higher than 650 is first to decrease. In contrast, as this fruit requires between 400 and 650 CH, and ranges between 550 and 650 (Table 5) will remain in the future, then it is expected that by then there will be ~ 20 000 hectares that could be cultivated. Despite this, it is desirable in the medium term the introduction of varieties with lower cold requirement than at the present, as could be, Victoria Temprano, Fred and Michele or with lower cold requirements as the varieties Regio or Sol (Fernández et al, 2011).
We can also identify agricultural areas with higher accumulation of cold and meeting other conditions for crop establishment, such as irrigation or a good rainfed, thinking about the possibility of changing the orchards to those places.
Conclusions
The retrospective analysis of climate change indices showed a trend toward increasing the minimum and maximum temperature with a corresponding decrease in the accumulation of the winter cold, suggesting an effect due to climate change.
In the peach areas, the average of CH accumulated during the winter period decreased steadily toward future scenarios, from 688.2 to 558.4 CH from the current scenario to the 2051 to 2060 scenario, respectively.
The surface of the peach areas with over 650 CH will decrease in the 2051-2060 scenario; while the surface between 550 and 650 CH will increase. The latter area is where eventually we could grow peaches in Zacatecas, as long as their winter cold requirements are between 400 and 650 CH.
Since the amount of winter cold is decreasing and this trend will continue in the future, it will be convenient for the medium term the introduction and evaluation of varieties with lower requirement of CH. Similarly we could explore more areas and cold storage facilities and fitness for establishing new orchards.
Literatura citada
Baldocchi, D. and Wong, S. 2008. Accumulated winter chill is decreasing in the fruit growing regions of California. Climatic Change. 87(1):153-166. [ Links ]
Brito-Castillo, L.; Diaz, C. S. C. y Ulloa, H. R. S. 2009. Observed tendencies in maximum and minimum temperatures in Zacatecas, Mexico and possible causes. Int. J. Climatol. 29:211-221. [ Links ]
Carlón, A. T. y Mendoza, M. E. 2007. Análisis hidrometeorológico de las estaciones de la Cuenca del Lago Cuitzeo. Investigaciones Geográficas. México, D. F. 63:56-76. [ Links ]
Conde, C.; Ferrer, R. M.; Gay, C. y Araujo, R. 2004. Impactos del cambio climático en la agricultura de México. In: cambio climático una visión desde México. SEMARNAT-INE. 225-236pp. [ Links ]
Eastman, J. R. 2012. IDRISI selva manual. Clark labs - Clark University. Worcester, Mass. USA. 322 p. [ Links ]
El Kenawy, A.; López-Moreno, J. I. and Vicente-Serrano, S. M. 2011. Recent trends in daily temperature extremes over northeastern Spain (1960-2006). Nat. Hazards Earth Syst. Sci. 11:2583-2603. [ Links ]
Espindola, B. M. de la C.; Elias, R. R. D.; Aguilar, M. J. J. y Campos, R. E. 2009. Guia técnica para la producción de durazno en la región sur del estado de México. Fundación Salvador Sánchez Colin CICTAMEX, S. C. Coatepec Harinas, México. 77 p. [ Links ]
Fernández, M. M. R.; Pérez, G. S.; Parra, Q. R. A.; Mondragón, J. C.; Roa, D. R.; Zacatenco, G. Ma. G.; Chávez, J. A. L. y Rumayor, R. A. F. 2011. Variedades mejoradas y selecciones de durazno del INIFAP. INIFAP-CIRC. Folleto técnico Núm. 15. 32 p. [ Links ]
Folland, C. K.; Karl, T. R.; Christy, J. R.; Clarke, R. A.; Gruza, G. V.; Jouzel, J.; Mann, M. E.; Oerlemans, J.; Salinger M. J. and Wang, S. W. 2001. Observed climate variability and change. In: climate change: the scientific basis. Contribution ofworking group I to the Third Assessment Report of the Intergovernmental Panel on Climate Change. (Ed.). Houghton, J. T.; Ding, Y.; Griggs, D. J.; Noguer, M.; van der Linden, P. J.; Dai, X.; Maskell, K. and Johnson, C. A. Cambridge Univ. Press. 2001. [ Links ]
Haylock, M. R.; Peterson, T. C.; Alves, L. M.; Ambrizzi, T.; Anunciafao, Y. M. T.; Baez, J.; Barros, V. R.; Berlato, M. A.; Bidegain, M.; Coronel, G.; Garcia, V. J.; Grimm, A. M.; Karoly, D.; Marengo, J. A.; Marino, M. B.; Moncunill, D. F.; Nechet, D.; Quintana, J.; Rebello, E.; Rusticucci, M.; Santos, J. L.; Trebejo, I. and Vincent, L. A. 2006. Trends in total and extreme South American rainfall 1960-2000 and links with sea surface temperature. J. Climate. 19:1490-1512. [ Links ]
Intergovernmental Panel on Climate Change (IPCC). 2007. Climate Change 2007: mitigation of climate change. Contribution of working group III to the Fourth Assessment Report of the Intergovernmental Panel on Climate Change. Metz, B.; Davidson, O.; Bosch, P.; Dave, R. and Meyer, L. (Eds.). Cambridge University Press, U. K. and USA. 851 p. [ Links ]
Jindal, K. K. and Mankotia, M. S. 2004. Impact of changing climatic conditions on chilling units, physiological attributes and productivity ofapple in western Himalayas. Acta Hort. (ISHS) 662:111-117. [ Links ]
Jones, P. D.; Parker, D. E.; Osborn, T. J. and Briffa, K. R. 2009. Global and hemispheric temperatures anomalies land and marine instrumental records. In: trends: a compendium ofdata on global change. Carbon dioxide information analysis center. Oak Ridge National Laboratory, U. S. Department of Energy. USA. 354 p. [ Links ]
Katz, R. W. and Brown, B. G. 1992. Extreme events in a changing climate: variability is more important than averages. Climatic Change. 21:289-302. [ Links ]
Luedeling, E.; Zhang, M. and Girvetz, E. H. 2009. Climatic changes lead to declining winter chill for fruit and nut trees in California during 1950-2099. PLoS ONE. 4(7):675-688. [ Links ]
Luedeling, E.; Girvetz, E. H.; Semenov, M. A. and Brown, P. H. 2011. Climate change affects winter chill for temperate fruit and nut trees. PLoS ONE6(5):20155-1371. [ Links ]
Magaña, V. and Caetano, E. 2007. Pronóstico climático estacional regionalizado para la República Mexicana como elemento para la reducción de riesgo, para la identificación de opciones de adaptación al cambio climático y para la alimentación del sistema: cambio climático por Estado y por Sector. Informe Final Proyecto de Investigación. Centro de Ciencias de la Atmósfera-UNAM-Instituto Nacional de Ecologia (INE). Documento no publicado. México, D. F.41p. [ Links ]
Medina, G. G. y Ruiz, C. J. A. 2004. Estadisticas climatológicas básicas del estado de Zacatecas. (periodo 1961-2003). INIFAP-CIRNOC. Libro técnicoNúm. 3. Zacatecas, Zacatecas, México. 240p. [ Links ]
Medina-Garcia, G.; Ruiz-Corral, J. A.; Ramirez-Legarreta, M. R. y Diaz-Padilla, G. 2011. Efecto del cambio climático en la acumulación de frio en la región manzanera de Chihuahua. Rev. Mex. Cienc. Agric. 2:195-207. [ Links ]
Pérez, G. S. 1995. Producción de durazno, ciruelo y chabacano. In: Memorias de la Primera Reunión Nacional e Internacional. Querétaro y Zacatecas, México, D. F., 45-59 p. [ Links ]
United Nations Environment Programme (UNEP). 2009. Climate change. Science compendium. (Eds.) McMullen, P. and J. Jabbour, C. 68 p. [ Links ]
Ruiz, C. J. A.; González, A. I. J.; Regalado, R. J. R.; Anguiano C. J.; Vizcaino V. I. y González, E. D. R. 2003. Recursos edafo-climáticos para la planeación del sector productivo en el estado de Jalisco. Libro técnico Núm. 2. INIFAP-CIRPAC. Ed. Conexión Gráfica. 172p. [ Links ]
Ruiz, C. J. A.; Medina, G. G.; Manriquez, O. J. D. y Ramirez, D. J. L. 2010. Evaluación de la vulnerabilidad y propuestas de medidas de adaptación a nivel regional de algunos cultivos básicos y frutales ante escenarios de cambio climático. Informe Final de Proyecto INIFAP-INE. Guadalajara, Jalisco. 108 p. [ Links ]
Ruiz, C. J. A.; Medina, G. G.; Ramirez, D. J. L.; Flores, L. H. E.; Ramirez, O. G.; Manriquez, O. J. D.; Zarazúa, V. P.; González, E. D. R.; Diaz, P. G. y Mora, O. C. 2011. Cambio climático y sus implicaciones en cinco zonas productoras de maiz en México. Rev. Mex. Cienc. Agric. 2:309-323. [ Links ]
Salinger, M. J. 2005. Climate variability and change: past, present and future -an overview. In: Increasing climate variability and change. Salinger, J. M. Sivakumar, V. K. and Motha, R. P . (Eds.). Springer. 9-29 pp. [ Links ]
Santillán-Espinoza, L. E.; Blanco-Macias, F.; Magallanes-Quintanar, R.; Garcia-Hernández, J. L.; Cerano-Paredes, J.; Delgadillo-Ruiz, O. y Valdez-Cepeda, R. D. 2011. Tendencias de temperaturas extremas en Zacatecas, México. Rev. Mex. Cienc. Agric. (2):207-219. [ Links ]
Sistema de Información Agropecuaria de Consulta (SIACON) 1980-2012. SAGARPA. 2013a. México, D. F. http://www.siap.gob.mx/siacon >. [ Links ]
Sistema de Información Agropecuaria de Consulta (SIACON) 2001-2012. SAGARPA. 2013b. México, D. F. http://www.siap.gob.mx/cierre-de-la-produccion-agricola-por-cultivo/> . [ Links ]
Snyder, R. L. 1985. Hand calculating degree days. Agric. For. Meteorol. 35:353-358. [ Links ]
Tejeda, M. A. y Rodriguez, V. L. 2007. Estado de la investigación de los aspectos fisicos del cambio climático en México. Investigaciones Geográficas. Boletin. 62:31-43. [ Links ]
Westwood, M. N. 1993. Temperate-zone pomology. Timber press. Portland, Oregon. 523 p. [ Links ]
Yu, H.; Luedeling, E. and Xu J. 2010. Winter and spring warming result in delayed spring phenology on the Tibetan Plateau. PNAS107:22151-22156. [ Links ]
Zarazúa-Villaseñor, P.; Ruiz-Corral, J. A.; González-Eguiarte, D. R.; Flores-López, E. H. y Ron-Parra, J. 2011. Cambio climático y agroclimático para el ciclo otoño-invierno en la región Ciénega de Chapala. Rev. Mex. Cienc. Agric. 2:295-308. [ Links ]
Zhang, X. and Yang, F. 2004. RClimDex (1.0). User manual. Climate research branch. environment Canada. Downsview, Ontario, Canada. 23 p. [ Links ]
Zhang, X.; Hegerl, G.; Zwiers, F. W. and Kenyon, J. 2005. Avoiding inhomogeneity in percentile-based indices of temperature extremes. J. Climate 18:1641-1651. [ Links ]
Received: April 2014; Accepted: August 2014
 Este es un artículo publicado en acceso abierto bajo una licencia Creative Commons
