


Serviços Personalizados
Journal
Artigo
 texto em
  Inglês (pdf)
 Artigo em XML
 Referências do artigo
 Enviar este artigo por email
Indicadores
-
 Citado por SciELO
 -
 Acessos
Links relacionados
-
 Similares em
SciELO
Similares em
SciELO
Compartilhar

 Permalink
Revista mexicana de ciencias agrícolas
versão impressa ISSN 2007-0934
Rev. Mex. Cienc. Agríc vol.5 no.spe10 Texcoco Nov./Dez. 2014
Articles
Effect of the ENSO condition in the frequency and intensity of rainfall events in the Baja California peninsula (1998-2012)
1Instituto Nacional de Investigaciones Forestales, Agrícolas y Pecuarias (INIFAP)- Campo Experimental Pabellón, km 32.5, carreteraAguascalientes-Zacatecas, Pabellón de Arteaga, Aguascalientes, C. P. 20660. Tel: +52 465 9580161.
2Instituto Nacional de Investigaciones Forestales, Agrícolas y Pecuarias (INIFAP)-Campo Experimental Altos de Jalisco, km. 8, Carretera Libre Tepatitlán-Lagos de Moreno, Tepatitlán de Morelos, Jalisco, C. P. 47600.
3Instituto Nacional de Investigaciones Forestales, Agrícolas y Pecuarias (INIFAP)-Campo Experimental Calera, km 24.5 carretera Zacatecas-Fresnillo, Calera de Victor Rosales, Zacatecas, C. P. 98500.
4Centro de Investigación Científica y de Educación Superior de Ensenada (CICESE). División Ciencias de la Tierra, Departamento de Geología. Carretera Ensenada-Tijuana Núm. 3918, Zona Playitas, C. P. 22860, Ensenada, B.C. México.
The influence ofthe ENSO condition in the frequency and intensity of rainfall events in the physiographic province Baja California Peninsula was analysed as a historical series of 15 years of daily rainfall records TRMM. The database was stratified into seven categories at intervals of 5 mm; the extreme events considered as > 30 mm day-1. We gathered evidence that, the ENSO condition influences the frequency and intensity of rainfall events. We also observed a certain symmetry between the conditions ENSO-neutral and ENSO-week La Niña and ENSO-weak El Niño with ENSO-moderate La Niña, causing an increase in the frequency ofrain events and a decrease, respectively. Regarding the intensity of the rain, other symmetrical relations were between the condition ENSO-neutral and ENSO-weak El Niño and asymmetrical between the conditions ENSO-moderate La Niña and ENSO-Strong La Niña. The rainfall intensity was higher during the conditions Neutral and Weak El Niño and lower during the conditions Moderate La Niña and Strong La Niña. These results are important because changes in the frequency and intensity of extreme events are the most dramatic consequence of climate variability, directly affecting the functioning of ecosystems, their landscape formation and spatial boundaries ofthe land use. The relationship between the frequency of occurrence and intensity of extreme events, the ENSO condition and the presence ofhurricanes is still under investigation.
Keywords: ENSO; extreme events; physiographic province,TRMM
La influencia de la condición ENSO en la frecuencia e intensidad de los eventos de lluvia en la provincia fisiográfica Península de Baja California, se analizó conforme una serie histórica de 15 años de registros diarios de lluvia TRMM. La base de datos fue estratificada en siete categorías a intervalos de 5 mm; se consideraron los eventos extremos como >30 mm día-1. Se obtuvieron indicios de que la condición ENSO influye en la frecuencia e intensidad de los eventos de lluvia. Se observó una cierta simetría entre las condiciones ENSO-Neutro y ENSO-La Niña Débil, y ENSO-El Niño Débil con ENSO-La Niña Moderada, que ocasionan un aumento en la frecuencia de los eventos de lluvia y una disminución en los mismos, respectivamente. En cuanto a la intensidad de la lluvia, otras relaciones simétricas fueron entre la condición ENSO-Neutro y ENSO-El Niño Débil y asimétricas entre las condiciones ENSO-La Niña Moderada y ENSO-La Niña Fuerte. La intensidad de las lluvias fue mayor durante las condiciones Neutro y El Niño Débil y menor durante las condiciones La Niña Moderada y La Niña Fuerte. Estos resultados son importantes debido a que los cambios en la frecuencia e intensidad de los eventos extremos son la consecuencia más dramática de la variabilidad climática y que afectan directamente la funcionalidad de los ecosistemas, su conformación paisajística y las fronteras espaciales del uso del suelo. La relación entre la frecuencia de ocurrencia y la intensidad de los eventos extremos, la condición ENSO y la presencia de huracanes está aún bajo investigación.
Palabras clave: ENSO; eventos extremos; provincia fisiográfica; TRMM
Introduction
The Baja California Peninsula in Mexico is a physiographic region of scientific interest for its floristic richness and its geographical position, in which the marine and aquatic terrestrial ecosystems are influenced by two bodies ofwater, the Pacific Ocean and the Gulf of California. The National Commission for the Knowledge and Use of Biodiversity in Mexico (CONABIO) described it as a narrow strip of land that runs parallel to the Pacific coast along more than 1 400 km, with an average width of 75 km. The east coast of the peninsula is bordered by the warm waters of the Gulf of California and the west coast by the cold waters of the California Current (Rodríguez-Moreno and Bullock (2014).
The California Current is an ocean flow that originates in the North Pacific and runs along the western United States Coast, moving south to the southern part of the Baja California Peninsula. When reaching this point, turns west towards the Pacific Ocean. Because ofits geographical origin, the current is very cold, relatively shallow and provides a significant load ofcold water promoting upwellings on its way through the waterfront; an upwelling is the vertical movement of water masses of deep levels to the surface. Bograd et al. (2009) reported a significant inter-annual variation in the characteristics of upwelling in the period 1967-2007, with extended periods of high (1970's, 1998-2004) and low (1980-1995) and a trend towards a late and short term in the CCLME (Marine Ecosystem of the California Current- California Current Large Marine Ecosystem). Also reporting that El Niño years are characterized by a delay and weakening of upwelling in this ecosystem.
El Niño (ENSO-The Niño Southern Oscillation) is a disruption of the ocean-atmosphere system the happens in the tropical Pacific and contributes to significant changes in the conditions of weather and climate on the planet. This phenomenon has two components: 1) oceanic, where the Tropical Pacific temperatures surface are contrasted and create El Niño, which occurs when having warm anomalies and La Niña, which occurs when having cold anomalies; and 2) Weather (Walker condition), quantitatively measured by the Southern Oscillation Index which is a reflection of the relative change between the mean monthly atmospheric pressure at sea level between the western sectors (around Darwin, northern Australia) and the central-eastern Pacific Ocean (around Tahiti Island) in French Polynesia. The duration of El Niño is variable. According to McPhaden (1999) occurs every three to seven years and lasts 12 to 18 months. The NOAA reports that the condition tends to occur every 3-5 years and usually lasts between 9-12 months. Contrary to the condition of El Niño, La Niña can last 1-3 years.
Regarding the ENSO, it is documented that affects the frequency, intensity and spatial distribution of rainfall. The "NationalAeronautics and SpaceAdministration" (NASA) mentioned that its influence is mainly in the coastal areas of the Americas, the Northern Hemisphere from Alaska to central Chile in the Southern Hemisphere. In Mexico, according to Magaña et al. (1998) winter rainfall in El Niño years increase in intensity, as occurred during the winters of 1982-1983, 1986-1987 and 1991-1992 and become weaker in the summer.
During the Niño winters, the jet stream of midlatitudes moves towards the south causing an increased incidence of cold fronts and rain in the northern and central Mexico (Magaña et al, 1998). The opposite occurs approximately in Niña years. The influence on winter rainfall is not always the same, especially when changes are analysed regionally. The regions of Baja California and Sinaloa have experienced some of the worst floods for years Niño.
Characterizing the climate at the regional level, the most limiting feature is the null or limited availability of historical climate data. In this sense, several authors have documented about the dominant role ofsatellites to observe the dynamics and changes in the Earth system. The most significant advance is the coverage and characterization of the planet on a global scale through increased spatial and temporal resolutions of satellite products, which would be impossible to obtain without this support (Dowell et al., 2013), besides, obtaining regional specific response models improve the representativeness of the data to characterize ecosystems.
In this manuscript, the influence of ENSO is explored in the number and intensity ofrainfall events in the physiographic region of the Baja California Peninsula. The time series of rainfall data was obtained from the records of the satellite "TRMM" (Tropical Rainfall Measurement Mission), estimating daily rainfall globally in pixels of ~ 27 km. Splitting the database at intervals of 5 mm identified the extreme rainfall events as >30 mm. The relationship between extreme events and ENSO episodes has not been studied extensively in the Peninsula although some case studies have been performed.
Materials and methods
Description of the study área
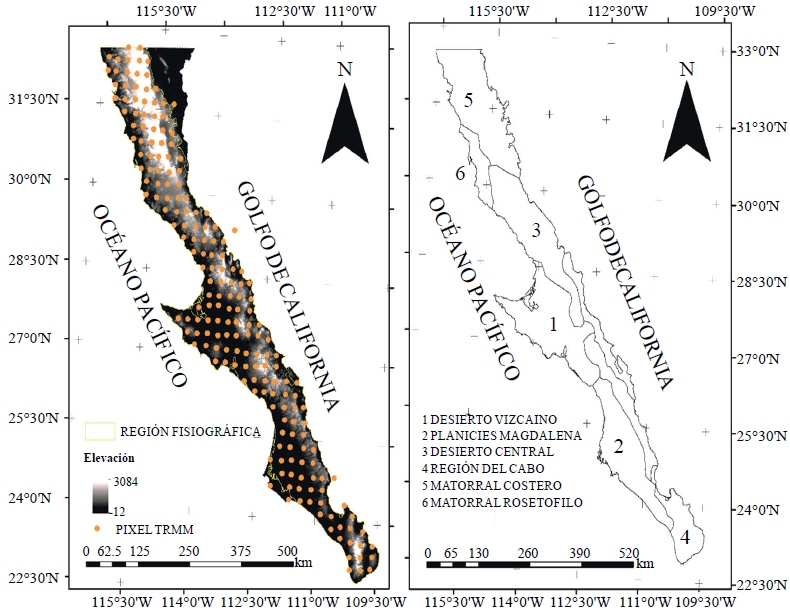
The spatial boundaries of the physiographic province were plotted according to the methodology of the National Research Institute of Statistics, Geography and Informatics (INEGI), which considers the geological origin, landscapes, rock types and geo-forms. In this province three physiographic discontinuities are located: the Vizcaino Desert, with wide plains and dunes that are disrupted in a westerly direction; Magdalena plains, a region with low and depressions that are flooded during the rainy season and whose sandy coast is interrupted for some lagoons (several of them connected to the sea) and the Cape Region with mountains ofgranite (Figure 1). The mountain system runs along the peninsula throughout the east coast, the steepest slopes descend directly to the Gulf ofCalifornia and softer on the lesser slopes into the Pacific Ocean. The northern part of the province is dominated by intrusive rocks while in the western plain patches of alluvial sediments are located.
Database rain
Daily data of 192 pixel TRMM (Figure 1) were used. The pixel has a spatial resolution of 0.25° and a range of horizontal resolution of10 km. According to NASA (2011) the precipitation radar (PR) is one of the five instruments on board the satellite TRMM. It is an active radar of 13.8 GHz that records the energy reflected at fixed points in the atmosphere and the land surface. Making an electronic scan from right to left looking in the direction +x of the satellite every 0.6 s with a swath width of 215 km before August 7th, 2001 and 247 km after August 24th, 2001.
The database included the registry 15 years of daily data from 1 January 1998 to 31 December 2012; this period represents a data volume of 1 051 968 estimated rainfall records (5479 days of daily rainfall records x 192 pixel "TRMM"). The database was properly designed and structured for its analysis in Geographic Information System (GIS) environment. In addition to the data layer of rain, the fields year, month, ENSO and rainfall strata. The rainfall data were stratified at intervals of 5 mm and resulted in seven categories: 1 to <5 mm; 5 to <10 mm; 10 to <15 mm; 15 to <20 mm; 20 to <25 mm; 25 to <30 mm; and >30 mm; the category of more than 30 mm was declared as extreme.
ENSO
According to the State of Climate Office at the University of North Carolina (State Climate Office ofNorth Carolina-2014) under ENSO condition, fluctuates between two states: Warmer than normal (El Niño) and colder than normal (La Niña) in the Central and Eastern Equatorial Pacific.
The El Niño is characterized by a weakening ofatmospheric winds along the Ecuador; its effects are maximized in the Northern Hemisphere winter because the ocean temperatures reach their maximum value; during the hurricane season (June to November), the jet stream is aligned so that the vertical wind increases in the Caribbean andAtlantic. Trasviña et al. (2004) noted that the impact of El Niño in Mexican waters is clearer in the Pacific which are changes in structure and dynamics that alter the regional climate and fishing activities. In La Niña, the opposite occurs, the atmospheric winds are strengthened, decreases convection in the equatorial Pacific which causes less rain, and during the hurricane season the upper winds are lighter creating conditions that favour the development ofmeteorological phenomena in the Caribbean and Atlantic.
The classification ofthe intensity of ENSO is made based on the Oceanic Index Niño; Oceanic Niño Index (ONI) proposed by the "National Oceanic and Atmospheric Administration" (NOAA). The ONI has become the standard measure of NOAA through which identifies the years El Niño or La Niña in the tropical Pacific. They are quarterly runs of sea surface temperature for the El Niño, region 3.4 (5° N to 5° S, 120° -170° W). The condition is reported as 5 consecutive months at or near + 0.5° of warm anomaly for El Niño and below -0.5° cold anomaly for La Niña events. The threshold is divides in weak (with an anomaly of 0.5 to 0.9), moderate (1.0 to 1.4) and strong (> 1.5). For an event to be declared as weak, moderate or strong, the threshold should be maintained for at least 3 months.
Based on the ONI index, the years included in the study were identified as follows: 1998, 2000, 2005, 2008 and 2011, Weak La Niña (NiD); 1999 and 2010 Strong La Niña (NIF); 2001, 2003 and 2012 Neutral (N); 2002 and 2009, Moderate El Niño (NM); 2004 and 2006, Weak El Niño (ND); and 2007, Moderate La Niña (NiM). In summary, the categories for ENSO in the years of the study were: five years Weak La Niña, Two years Strong La Niña, three years neutral, two years Moderate El Niño, two years Weak El Niño, and one year Moderate La Niña.
Data analysis
Based on the extent ofthe study area and because categorical and numerical variables are involved, linear multivariate analysis techniques were applied. The multivariate analysis of variance (MANOVA) and "post-hoc" Bonferroni test were used to identify significant components of the linear model and to compare homogeneous groups, respectively. According to Carey (1998) , MANOVA is used instead of the traditional ANOVA or other techniques of regression analysis, because it allows to incorporate multiple independent and dependent variables in the same model of analysis, allowing larger complexity.
Results and discussion
In total, 28 714 rain events were observed distributed throughout the physiographic province, an average of 1914 events per year (Figure 2).
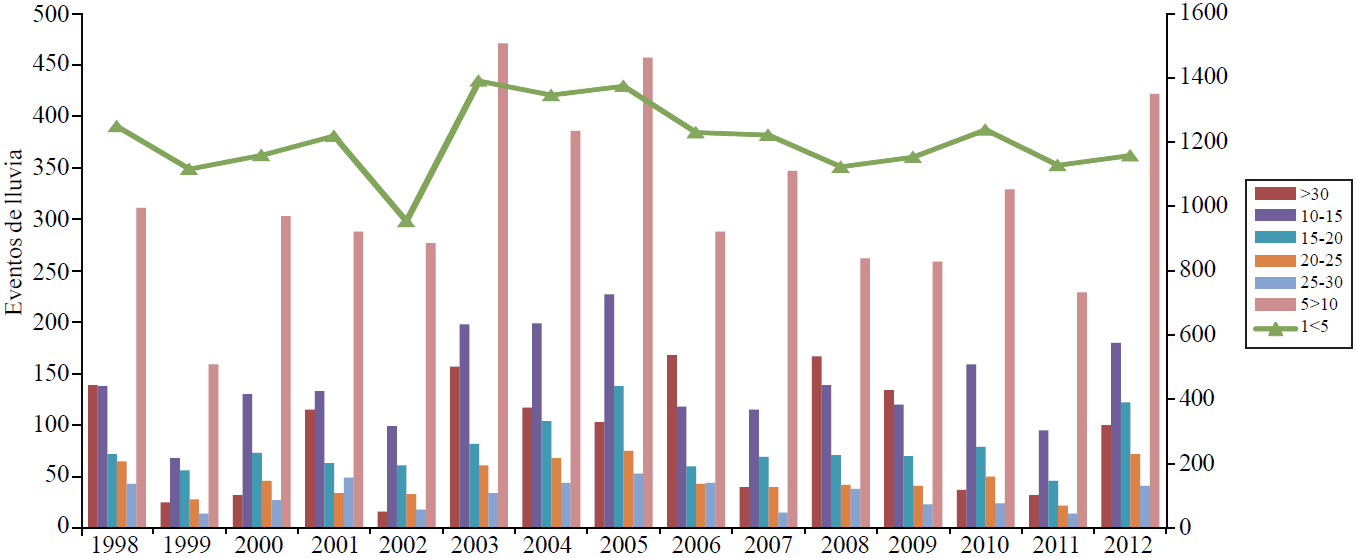
Figure 2 Rain events observed in the historical data set. Data were stratif ied according to the amount of the estimated rain.
Among the rain events, just under 63% (18, 059) were in the range of between 1 and 5 mm ofrain; 16.7% between 5 and 10 mm (4 788); 7.3% (2 118) between 10 and 15 mm; 4.8% (1 382) were extreme events over 30 mm; for other categories the number of events was 1 166 (15 to 20 mm -4%), 720 (20 to 25 mm -2.5%) and 481 (25 to 30 mm -1.67%). With respect to the extreme events, the results were contrasting and also unexpected. The highest frequency (471 events) was recorded in 2002 (ENSO-NM) and the lowest number (25) in 1999, in ENSO-NiF. However, in other years of ENSO, the observed results were contrasting. In 2009 (ENSO-NM), 134 extreme events were registered,just under 30% ofthose registered in 1999. In another NiF year (2010), the number of extreme events recorded was 37. These contrasts do not give a clear idea of the relationship between ENSO and extreme events, but rather opens up a range of possibilities to be addressed in future researches.
From Table 1, the numbers in bold correspond to the maximum value of the data set; figures in bold and inclined correspond to the minimum value of events in the time series data; underlined numbers correspond to the maximum and minimum of all the historical data series.

These results show that in the region of study, the number of rainfall events increases during Weak La Niña, most of the rain events of lower intensity than 5 mm. Additionally we infer that this indicator is opposite (asymmetric) with ENSO-Weak El Niño. An observation of interest to follow up on the statistical analysis of the data is almost parallel relationship to the frequency of rain events between the conditions NiD and N. With respect to extreme events, in condition N was recorded the maximum historical series (372 events) and in the NIF the minimum (62).
The inter-seasonal variation was performed by analysing per calendar-monthly (Table 2).
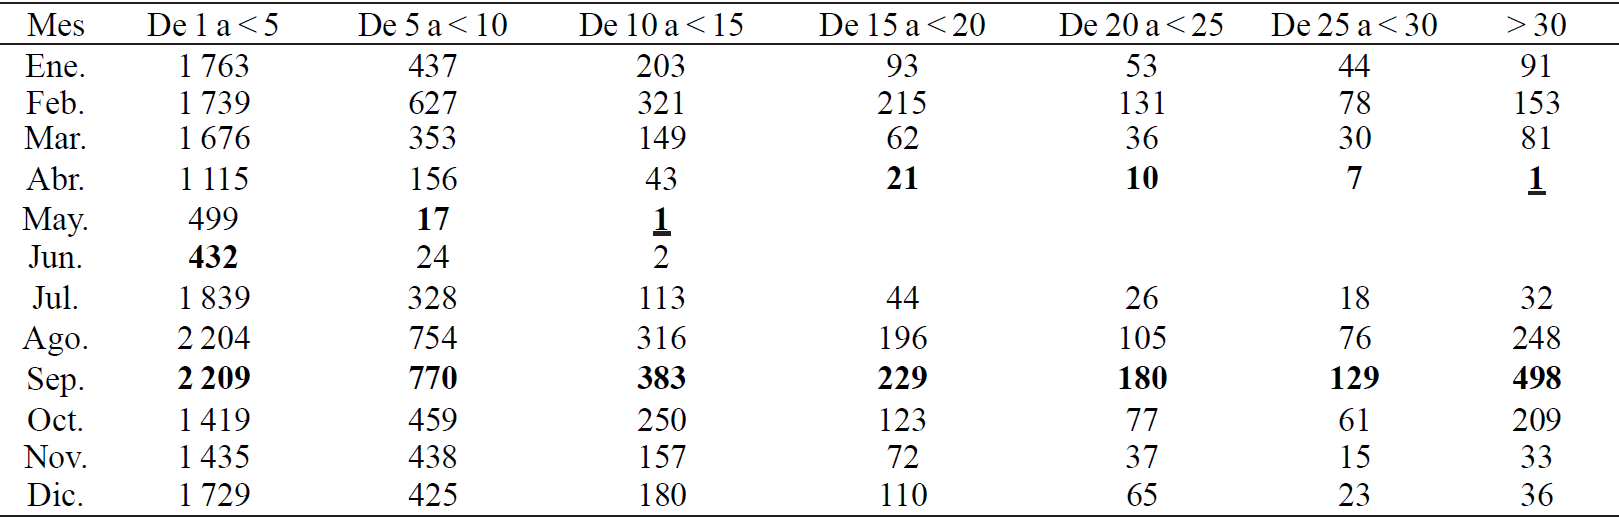
From Table 2, the numbers highlighted in bold correspond to the maximum of the series; those highlighted in bold and inclined are the minimum series and underlined are the maximum and minimum of the entire data set. The Table 2 shows that it happens in September when the highest number of rainfall events appear, while the lowest number of rain events observed in different months and different strata. The <5 mm in June; events between 5 and 20 mm, in May; the >20 mm / event in April -includes extreme events. For marking that in the months of May and June there were no rain events higher than 15 mm.
The largest number of extreme events was observed for the months ofSeptember andAugust. This situation is consistent with those reported by several authors regarding the presence of storms and tropical cyclones affecting western Mexico. According to Dorst (2010) , the hurricane season is from July to November, with peak activity in late August and early September. Severe storms occurred in September (Visher, 1992) ; Hurricanes greatly impact on the peninsula of Baja California Sur occurred in August and September (Vadillo-Romero, 2003); according to the records of the National Hurricane Center (NHC), in the report of 2006, more than 150 tropical storms have hit Baja California Sur.
These results suggest extending the study, adding new variables to the database such as differentiating the Pacific coastline with the Gulf of California, virtually separate the peninsula in the north and in the south due to the latitudinal extension, considering that the southern part ofthe Peninsula suffers from the increased presence of hurricanes, including data of land-use and incorporate data of most of the extreme weather events such as hurricanes. One aspect ofsignificance and complementary to the rainfall data is the incorporation of direct data from historical series ofmeteorological stations in the study area in order to detect deviations from the estimated probable data TRMM.
Statistical analysis
Analysis of rainfall events
In the general analysis model was declared the number of events as the dependent variable and three independent categorical variables: the ENSO, the calendar month and the layer of rainfall. The results were significant (p< 0.05) for ENSO, Month and Stratum condition. No co-linearity was observed between the variables of the model (0.28> r 2 <0.70). The results of the Bonferroni test are shown in the Table 3.
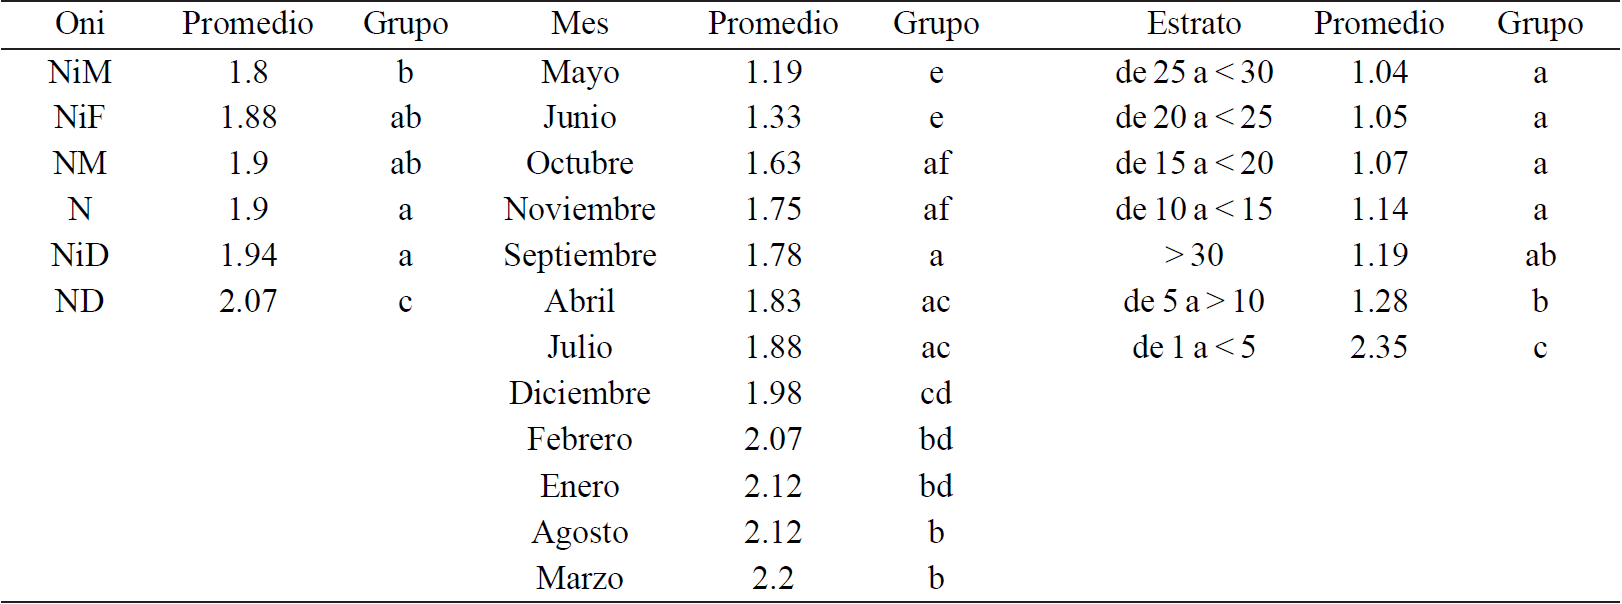
The Bonferroni test for homogeneous groups confirmed the results in the Table 1, with respect that the ENSO N and ENSO NiD are homogeneous for the frequency of rain events. Additionally, they were under the same condition of homogeneity conditions of ENSO NiF and ENSO NM. The ENSO-ND and ENSO-NiM resulted in different groups; respectively, higher and lower average frequency of rainfall events.
Regarding the calendar-month, surprisingly, the highest number of rain events was not observed in September, but continuously during the winter rain season (January, February and March) and in the middle summer (August). The lowest number of rain events on average was observed for the hot months of May and June.
Regarding the strata, the differences between groups were observed mainly for <5 mm, observing the highest average events (2.35), followed by 5 to 10 mm (1.28) and extreme events (>30 mm, -1.19); no significant differences among the groups ofat least 10 mm 30 mm were observed.Although, no history of interval analysis was found to track rainfall patterns in Mexico, Grimm and Tedeschi (2008) suggested using a threshold of 10 mm day-1 daily for regions with wet season. The climate in the physiographic province of Baja California Peninsula is predominantly arid and semi-arid, therefore we consider that the proposed analytical strata are considered appropriate.
Analysis of estimated rain
Regarding the volume ofrain, the MANOVAanalysis included the estimated dependent variable of rain and the categorical variables as independent, ENSO and calendar-month. The analysis resulted in significant differences (p< 0.05) for the ENSO and calendar-month [F (5, 19 887)= 91 241, p<0.01; and F (11, 19 877)= 215.03, p< 0.01, respectively] (Figure 3).
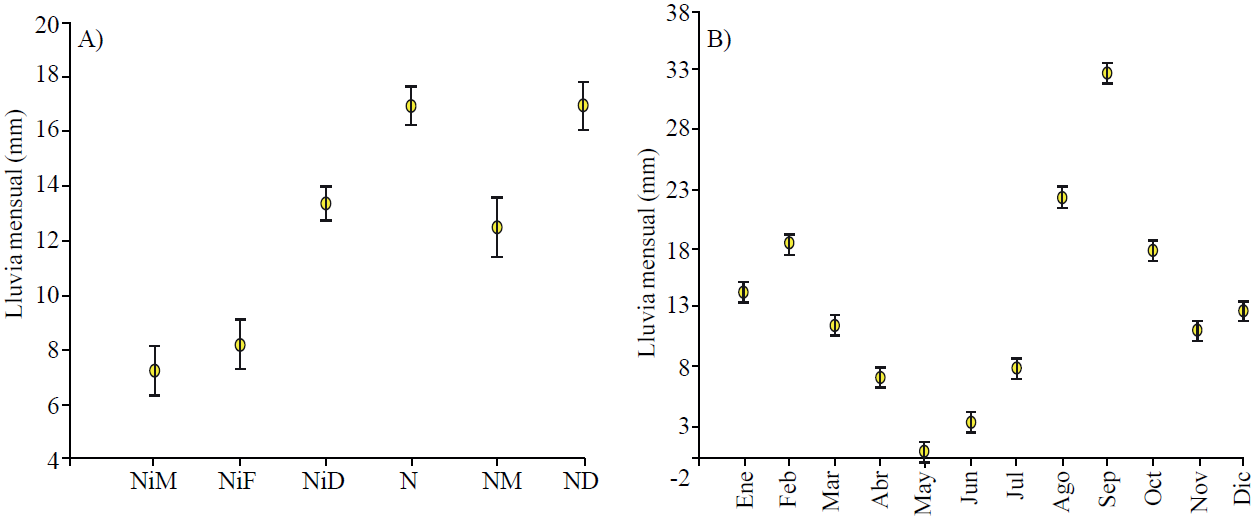
Figure 3 Estimated monthly rain by ENSO (A) per calendar month and (B). The value corresponds to the monthly average and the vertical bars to the confidence interval (0.95).
The highest rainfall is observed in year N and ND (Figure 3a) while the lowest in the NiM and NIF condition, where the estimated average rainfall was the lowest. In the Figure 3b we observe a bimodal behaviour in the distribution ofrainfall per calendar-month, with the months of August and September being the wettest months and the season from April to June is the driest. The Bonferroni test for homogeneity of this groups is shown in the Table 4.
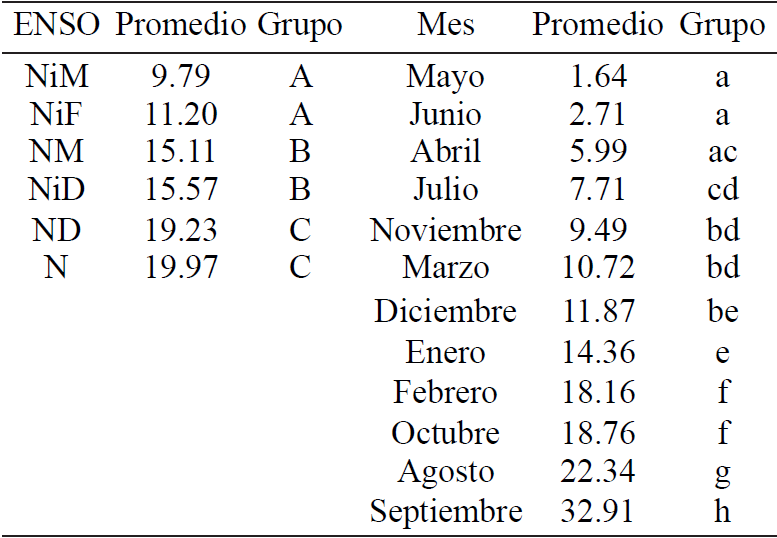
According to the Bonferroni test, the six ENSO can be grouped into three groups. The ENSO-NiM and ENSO-NiF condition with the lowest estimated rainfall; ENSO-N and ENSO-ND with the highest average rainfall; and ENSO-NM and ENSO-NiD with average intermediate rainfall. Regarding the calendar-month, the inter-seasonal variation corroborates the hottest months with the lowest average estimated rainfall (April, May and June) and the months of August, September and October as the highest average precipitation.
These results confirm that described by NOAAin the sense that, the condition Niño influences the development of hurricanes in the Eastern Pacific. In addition, we mention that the results suggest that ENSO-N could also cause the same effect. However, the nature of our data allows us to infer the above only because it would be necessary to conduct a specific analysis approach for future researches including the analysis dates and paths of hurricane events and document their influence on the landscape of the ecosystem.
In this context, the results seem to indicate that, the extreme rainfall events that occur during hurricane season, influence by increasing the estimated average monthly rainfall, especially during the late summer and autumn, while during the winter season (December, January and February) is when the rainfall events are more constant and less intense. According to Grimm and Tedeschi (2008) in addition to the increased frequency of extreme rainfall events, the ENSO episodes can also affect its intensity, which is useful information to refine models of climate prediction and prevention schemes of hydrological disasters.
Discussion
The results document the influence ofENSO on the number of rainfall events and their intensity in the physiographic province of Baja California Peninsula.According to Grimm and Tedeschi (2008) , the impact ofextreme events are noted for their persistence and defined based on 3-day averages. The average rainfall of 3-days is calculated and the values refer to the central days. The gamma distributions are fixed to these means (considering only values above 0.1 mm), a distribution for each day of the year. Extreme events are those with an average of 3-days above the 90th percentile of stratification in rainfall events at intervals of 5 mm and in particular that relating to extreme events (<30mm), is an option that does not conform strictly as proposed by Grimm and Tedeschi (2008).
However, given the volume of data processed and the absence of direct data to locally calibrate TRMM data, and taking account of the exploratory and relatively innovative nature ofthis proposal, the results are sufficient to strengthen the theory of influence of ENSO in the spatial frequency and distribution of rainfall in the study region. An important need relative to the model of analysis of rainfall data is that it most be enriched by the incorporation of other ecosystem response variables, such as indices ofgreenness and moisture in the vegetation and soil, cloudiness and sunshine, among others. Additionally, we might consider studies designed to explore the effect of coastline on the response of marine and terrestrial ecosystems.
An important effect that was not considered in this proposal is the spatial distribution ofinsolation. According to Valdés-Barrón et al. (2013), the distribution of the insolation is predominantly latitudinal. In the field of earth sciences, mapping of solar radiation is important to discuss, because it is a climatic factor that might be used in modelling and mapping of weather elements such as air temperature, evapotranspiration Ninyerola et al. (2000) ; Fu and Rich (2002) ; Cristóbal et al. (2005) and because it is a variable that directly influences the biological processes ofthe plants.
According to Pons and Ninyerola (2008) , mapping of continuous surfaces is very interesting to integrate and analyse spatial information from irregular distributed points (weather stations) when the goal is to obtain values of solar radiation by topography of a regional scale. In functional logic, the interrelationships in a large geographic area are as variable as the rate of sunlight that reaches the surface is causal ofbiodiversity and endemism. These considerations should be incorporated into future research proposals.
In general, the ENSO is related to changes in the intensity and frequency of extreme precipitation events (Grimm and Tedeschi, 2008) and in periodic floods and droughts (Whelan et al., 2013).According to McBride and Nicholls (1983) , the region of Australia is particularly sensitive to the ENSO; weather conditions are dry during the phases of El Niño, and with precipitation above the means during La Niña phases. The results in this manuscript are evidence that confirms some asymmetry between declining rainfall events during Weak El Niño and Moderate La Niña and increased frequency and intesity of rainfall events during the conditions ENSO-neutral and ENSO-week La Niña.
Conclusions
According to the analysis ofthe historical database TRMM, in the physiographic province in Baja California, a certain symmetry was observed between the conditions ENSO-neutral and ENSO-Weak La Niña and ENSO-Weak El Niño with ENSO-Moderate La Niña. We found that, the conditions Neutral and Weak La Niña cause an increase in the frequency of rainfall events and, in contrast, a decrease when the conditions of Weak El Niño and Moderate La Niña prevail.
Regarding the intensity of precipitation, asymmetrical relations were observed between the conditions ENSO-neutral with ENSO- Weak El Niño and between ENSO-Moderate La Niña with ENSO-Strong La Niña. During the conditions Neutral and Weak El Niño, the rainfall was more intense while decreasing during the conditions Moderate La Niña and Strong La Niña.
The relations of symmetry and asymmetry between rain events and ENSO, are just the starting point for future research proposals that address the theme, considering the incorporation to the analysis ofnew variables that elucidate more clearly the information gathered in this manuscript. Especially the information related to extreme events affecting most of the southern region of the physiographic province, the spatial distribution of rainfall events and how it affects the development and function of ecosystems, and the role of rain by defining spatial boundaries of land-use.
Literatura citada
Rodriguez-Moreno, V. M. and Bullock, S. H. 2014. Vegetation response to rainfall pulses in the Sonoran Desert as modelled through remotley sensed imageries. Int. J. Climat. Bograd. [ Links ]
Schroeder, S. J.; Sarkar, I.; Qiu, N.; Sydeman, X. and Schwing, W. J. F. 2009. Phenology ofcoastal upwelling in the California Current. Geophysical Research Letters. 36(1602):1-5 [ Links ]
McPhaden, M. J. 1999. Genesis and evolution ofthe 1997-1998 El Niño. Science. 283:950-954. [ Links ]
Magaña-Rueda, V.; Pérez, J. L. y Conde, C. 1998. El fenómeno del El Niño y la oscilación del sur. Sus impactos en México. Revista Ciencias de la UNAM. 51:14-18. [ Links ]
Dowell, M.; Lecomte, P.; Husband, R.; Schulz, J.; Mohr, T.; Tahara, Y.;vEckman, R.; Lindstrom, E.; Wooldridge, C.; Hilding, S.; Bates, J.; Ryan, B.; Lafeuille, J.; and Bojinski, S. 2013: Strategy towards an architecture for climate monitoring from space. This report is available from: www.ceos.org ; www.wmo.int/sat ; http://www.cgms-info.org/. 39 p. [ Links ]
National Aeronautics and Space Administration (NASA). 2011. Precipitation processing system tropical rainfall measuring mission. File specification for TRMM products version 7.00. ftp://pps.gsfc.nasa.gov/pub/v7filespec/filespec.TRMM.V7.pdf. [ Links ]
Trasviña, A.; Lluch-Cota, D.; Filonov, A. E. y Gallegos, A. 2004. Oceanografía y El Niño. In: Magaña-Rueda, V. 2004. Los impactos del niño en México. Centro de Ciencias de la Atmósfera, Universidad Nacional Autónoma de México (UNAM). Secretaria de Gobernación (SEGOB). México, D. F., 229 p. [ Links ]
Carey, J. 1998. Multivariate analysis of variance (MANOVA): I. Theory. http://ibgwww.colorado.edu/~carey/p7291dir/handouts/manova1.pdf. [ Links ]
Dorst, N. 2010. Frequently asked questions: when is hurricane season? http://www.aoml.noaa.gov/hrd/tcfaq/G1.html. [ Links ]
Visher, S. 1992. Tropical cyclones in the northeast Pacific, between Hawaii and Mexico. Monthly weather reviewhttp://docs.lib.noaa.gov/rescue/mwr/050/mwr-050-06-0295.pdf. [ Links ]
Vadillo-Romero, E. 2003. Modelación numérica de ondas de tormenta en la Bahia de La Paz y Cabo San Lucas, Baja California Sur. Tesis doctoral. Instituto Politécnico Nacional (IPN)-CICIMAR. 231 p. [ Links ]
Grimm, A. and Tedeschi, R. G. 2008. ENSO and extreme rainfall events in South America. J. Climate. 22:1589-1609. [ Links ]
Valdéz-Barrón, M.; Peláez-Chávez, J. C.; Bonifaz-Alfonzo, R.; Velasco-Herrera, V. and Estévez-Pérez, H. 2013. UVB solar radiation climatology for Mexico. Geofísica Internacional, 52(1):31-42. [ Links ]
Ninyerola, M.; Pons, X. and Roure, J. M. 2000. A methodological approach of climatological modelling of temperature and precipitation through GIS techniques. Int. J. Climatology. 20:1823-1841. [ Links ]
Fu, P and Rich, P. M. 2002. A geometric solar radiation model with applications in agriculture and forestry. Computers and Electronics in Agriculture. 37:25-35. [ Links ]
Cristóbal, J.; Pons, X. and Ninyerola, M. 2005. Modelling actual evapotranspiration in Catalonia (Spain) by means of remote sensing and geographical information systems. Gottinger Geographische Abhandlungen. 113:144-150. [ Links ]
Pons, X. and Ninyerola, M. 2008. Mapping a topographic global solar radiation model implemented in a GIS and refined with ground data. Int. J. Climatol. 28:1821-1834. [ Links ]
Whelan, J. A.; Frederiksen, J. S.; Frederiksen, C. S. and Osbrough, S. L. 2013. Synoptic and dynamical analyses of ENSO extreme events over Australia. 20th International Congress on Modelling and Simulation, Adelaide, Australia. 1-5 de diciembre de 2013. [ Links ]
McBride, J. L. and Nicholls, N. 1983. Seasonal relationships between Australian rainfall and the Southern Oscillation. Mon. Weather Rev. 111:1998-2004. [ Links ]
Received: May 2014; Accepted: October 2014
 Este es un artículo publicado en acceso abierto bajo una licencia
Creative Commons
Este es un artículo publicado en acceso abierto bajo una licencia
Creative Commons
