


Servicios Personalizados
Revista
Articulo
 texto en
  Inglés (pdf)
 Artículo en XML
 Referencias del artículo
 Enviar artículo por email
Indicadores
-
 Citado por SciELO
 -
 Accesos
Links relacionados
-
 Similares en
SciELO
Similares en
SciELO
Compartir

 Permalink
Revista mexicana de ciencias agrícolas
versión impresa ISSN 2007-0934
Rev. Mex. Cienc. Agríc vol.5 no.spe10 Texcoco nov./dic. 2014
Articles
Climate Change in Mexico and potential distribution of racial groups conical maize
1Instituto Nacional de Investigaciones Forestales, Agrícolas y Pecuarias, Región Pacífico-Centro, Interior Parque Los Colomos s/n II Sección, Colonia Providencia, Guadalajara, Jalisco. Tel. (33) 36 41 07 72.
2Centro Universitario de Ciencias Biológicas y Agropecuarias, Universidad de Guadalajara, Camino Ing. Ramón Padilla Sánchez 2100, poblado La Venta del Astillero, Zapopan, Jal.
3Unidad Académica de Agricultura. Universidad Autónoma de Nayarit. Carretera Tepic-Compostela, km 9. Xalisco, Nayarit, México. C. P. 63780.
4Instituto Nacional de Investigaciones Forestales, Agrícolas y Pecuarias, Campo Experimental Zacatecas, carretera Fresnillo-Zacatecas km 24.5, Calera de Víctor Rosales C. P. 98500.
5Instituto Nacional de Investigaciones Forestales, Agrícolas y Pecuarias, Campo Experimental Pabellón. Carretera Aguascalientes-Zacatecas, km 32.5. Pabellón de Arteaga, C. P. 20660.
The aim of this study was to evalúate the effect of climate change forthe period2041-2060 on potential niche distribution of Mexican conical maize races. To do so, information from 9 823 georeferenced entries, corresponding to 12 races ofthis racial group was used.An information system with 20 climatic and topographic variables was generated for Mexico, based on climatologies from 1961-1990 and 2041-2060, for which were used images from the portal Earth System Grid (ESG) WorldClim imported into the Idrisi Selva system as images in raster format with a resolution of 2.5 arcmin. For the period 2041-2060 the general circulation model HadGEM2-AO and MIROC5 under two concentration pathways of greenhouse gases (GHG) (rcp4.5 and rcp6.0) were considered. Based on this information system the potential niche distribution of conical maize racial group was modeled by Maxent model. The results showed that climate change for the period 2041-2060 will increase the surface with high environmental suitability for distribution of conical maize racial group. In this regard, is more favorable the outcome that would occur under the path rcp4.5 than under the path rcp6.0 ofGHG emissions and concentration. However, a differential effect of climate change on the races that make up the Conical group was identified, concluding that races that mostly benefit from climate change 2041-2060 will be, Mushito from Michoacan, Negrito and Conical, while the most adversely affected in their distribution potential will be Chalqueño, Conical Northern and Mushito.
Keywords: climate change; conical racial group; maize races; niche distribution
El objetivo del presente estudio fue evaluar el efecto del cambio climático del período 2041-2060 sobre los nichos potenciales de distribución de las razas mexicanas de maíz del grupo cónico. Para ello se utilizó información de datos pasaporte de 9 823 accesiones georreferenciadas, correspondientes a 12 razas de este grupo racial. Se generó un sistema de información con 20 variables climáticas y topográficas para la República Mexicana con base en las climatologías 1961-1990 y 2041-2060, para lo cual se utilizaron imágenes del portal Earth System Grid (ESG) de WorldClim importadas en el sistema Idrisi Selva como imágenes en formato raster con una resolución de 2.5 minutos de arco. Para el período 2041-2060 se consideraron los modelos de circulación general HadGEM2-AO y MIROC5, bajo dos vías de concentración de gases efecto invernadero (GEI) (rcp4.5 y rcp6.0). Con base en este sistema de información se modelaron los nichos potenciales de distribución del grupo racial cónico de maíz mediante el modelo Maxent. Los resultados mostraron que el cambio climático del período 2041-2060, incrementará la superficie con aptitud ambiental alta para la distribución del grupo racial cónico de maíz. A este respecto es más favorable el panorama que se presentaría bajo la ruta rcp4.5 que bajo la ruta rcp6.0 de emisiones y concentración de GEI. Sin embargo, se identificó un efecto diferenciado del cambio climático sobre las razas que integran el grupo Cónico, concluyéndose que las razas que mayormente se beneficiarán del cambio climático 2041-2060 serán, Mushito de Michoacán, Negrito y Cónico, mientras que las que resultarán más afectadas negativamente en su potencial de distribución serán Chalqueño, Cónico Norteño y Mushito.
Palabras clave: cambio climático; grupo racial cónico; nichos de distribución; razas de maíz
Introduction
The conical group includes Conical Norteño, Palomero Toluqueño, Palomero from Chihuahua, Conical, Conical cob, Arrocillo, Chalqueño, Mushito, Mushito from Michoacan, Cacahuacintle, Negrito and Sweet Corn (Sánchez, 2011; CONABIO, 2014). This group was designated as a distinct group, type "Central Mexico" by Kuleshov (1930) , Mexican Pyramidal by Anderson and Cutler (1942) , and as "Conical Group" by Goodman and McK Bird (1977) and Sánchez (1989). The races from this group have in common conical cobs, large numbers of grain row, 14 to 20; grains of 4-8 mm wide with varying texture from floury to horny, reduced number of branches in the ear, weak root system, prostrate leaves and leave pods heavily pubescent and presence of anthocyanins (Sánchez, 2011).
Most races are endemic to the Valley of Mexico and distributed in regions with elevations over 2000 m, therefore also classified in the group of maize races with adaptation to a semi-warm temperate humid atmosphere with a moist or semiarid regime (Ruiz et al, 2008) with an average temperature of the growing season between 14 and 21 °C. According to these authors, within this group are located three subgroups, being subgroups 2 and 3 which agglomerate races from Conical Group. Subgroup 2 is characterized by races adapted to a growing season with more than 650 mm and includes Cacahuacintle, Conical, Conical cobs, Chalqueño, Palomero Toluqueño and Conical Norteño.
Meanwhile, subgroup 3 is characterized by a wet growing season with more than 1 000 mm cumulative, including Arrocillo and Mushito races. Conical Group races are evidence that a species can be cultivated and adapted to very different environmental conditions to those prevailing in their place of origin. This is how some of the races from the Conical Group, in correspondence with their adaptation to temperate environments, maintaining a base temperature below 5 °C, as is the case of Conical, Conical cob, Mushito, Cacahuacintle and Chalqueño (Ruiz et al. , 1998). This base temperature value differs significantly from that typically known for corn, that with 10 °C (Cutforth and Shaykewich, 1989), is considered a plant with adaptation to subtropical and tropical environments (Ruiz et al., 2013a).
These data prove the influence of climatic diversity on corn and exemplify the interaction of genotype-environment that has been occurring from the dispersal ofmaize throughout the Mexican territory. The characteristics of diversity regarding environmental adaptation by Mexican maize races are considered advantageous in the context ofthe need to generate measures ofadaptation to climate change (Ruiz et al, 2013b). Especially in centers of origin and crop diversity, as is Mexico for corn, it is believed that the races conserved in situ are more rustic and will tolerate and will adapt better to climate change (Mercer and Perales, 2010).
It has been proven that under adverse rainfed conditions, creole materials maintain more stable yields than those considered genetically improved materials (Smith et al, 2001). Conical racesl, are no exception in this regard and in the high valleys of central Mexico continue to be cultivated for their good agronomic performance and special characteristics such as color ofits grain and the presence ofanthocyanins. However, even with the greater hardiness ofthese native materials from Mexico, the presence of climate change poses a threat for maize races and native materials, do to they are generally grown under a system ofsubsistence agriculture, artisanal and at small scale with few technological and economic support.
To date there are few works that have been conducted in Mexico to assess the impact of climate change on genetic resources and landrace relatives associated to major crops of Mexico. One ofthe initial tasks to be performed is to determine the effect of changes in weather patterns on potential areas for cultivation or distribution ofspecies and genotypes. Therefore the obj ective ofthis study was to evaluate the effect of climate change on potential niche distribution ofconical race groups.
Materials and methods
Entries
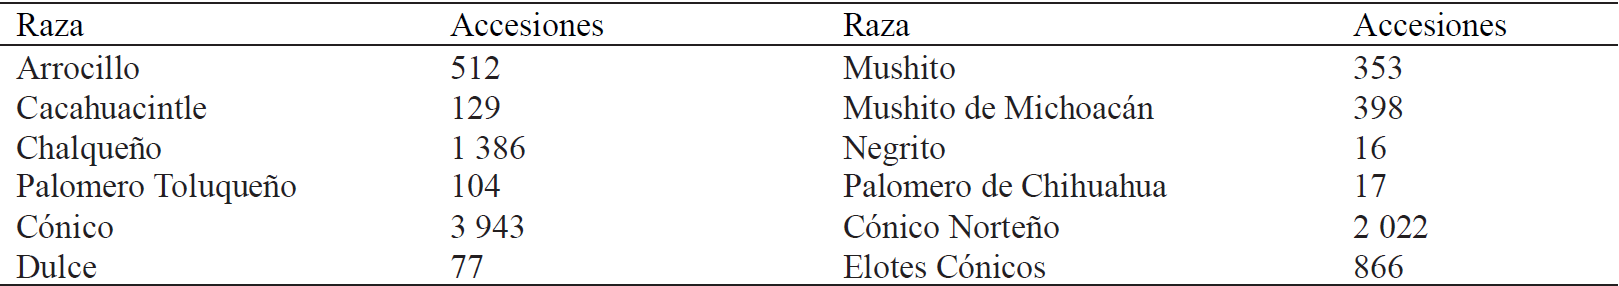
The total numbers of entries considered by race for the analysis of this study are described in Table 1. The information was extracted from the database of Passport races of maize generated through projects CONABIO FZ002 and FZ016. Besides all entries registered at the Germplasm Bank from INIFAP were considered, as well as in the Germplasm Bank of the University of Guadalajara, related to conical group.
Environmental information system and climate change
Monthly and annual data on precipitation, maximum temperature, minimum temperature and average temperature of the periods 1961-1990 (reference climatology) and 2041 to 2060 were used, to determine potential areas of distribution for conical group. These climate data were obtained from the data portal Earth System Grid (ESG) WorldClim and worked with raster images with a resolution of 2.5 arcmin in Idrisi Selva (Eastman, 2012) system. For the period 2041-2060 the GCMs HadGEM2-AO (Hadley) and MIROC5 (MIROC) were considered, under two ofthe four representative concentration pathways of greenhouse gases (rcp4.5 and rcp6.0).
These models are part in climate modeling developed by the Coupled Model Inter comparison Project Phase 5 (CMIP5) (Taylor et al., 2012). The rcp refer to radiative forcing expressed in W m-2; assuming that this varies by increasing GHGs. rcp4.5 assumes a radiative forcing of ~4.5 W m-2 and that GHG emissions will reach the peak around 2040 and then decline; while rcp6.0 consider a radiative forcing of~ 6 W m-2 with emissions that will reach the peak around 2080, also considering that thereafter there will be a reduction of emissions. The rcp2.6 and rcp8.5 pathways were not considered, since the first one assumes that radiative forcing will be ~ 3 W m-2 and that global GHG emissions will reach the peak between 2010-2020, which it is considered unlikely and far from reality according to global emission trends.
While rcp8.5 assumes that radiative forcing will be> 8.5 W m-2 and emissions will continue to rise over the next century (Moss et al., 2008), which is considered an uncertain scenario for the distant future that is taken into account. From the basic climatic variables mentioned a number of additional variables were derived to perform Maxent analysis of niche distribution under both condition of climatology reference as for climatology 2041-2060. The total number of variables used is as follows: altitude (m), accumulated annual average precipitation (mm), average accumulated rainfall from June to October (mm), average accumulated rainfall from November to April (mm), average annual temperature (°C) , average temperature from May to October (°C), average temperature from November to april (°C), minimum annual mean temperature (°C), minimum average temperature from May to October (° C), minimum average temperature from November to April (°C ), maximum annual mean temperature (°C), maximum average temperature from May to October (°C), maximum average temperature from November to April (°C), average temperature ofthe coldest month (°C), precipitation of the moistest month (mm), average minimum temperature ofthe coldest month (°C), average temperature of the wettest month (°C), maximum average temperature of the hottest month(°C), average photoperiod from May to October (h), temperature variation in May -October (°C).
Analysis of potential distribution áreas
The potential distribution of conical racial group was analyzed by Maximum Entropy Species Distributions Modeling, Version 3.33k (Maxent). The algorithm of this system was adapted by Steven J. Phillips and colleagues (Phillips and Dudík, 2008; Phillips et al., 2006, 2009) to construct models of potential distribution. The Maxent system is a program to model species distributions using only presence data of the species (Elith et al, 2011); the distribution of a species is represented by a probability function P on a set X of sites in the study area.
A model of P is constructed by a set of constraints derived from empirical data ofthe species presence. The restrictions are expressed as simple functions of known environmental variables. Maxent algorithm forces the average of each function of each variable to approximate the true mean of the variable in the areas of presence of the species. Of all combinations of functions, it is selected the one that minimizes its entropy function; which is measured by Shannon index.
The general expression of the probability function for environmental variables i is:
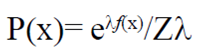
Where: P (x)= probability function; X= vector of weights coefficient; f= corresponding vector of functions of environmental variables; Z= normalization constant to ensure that P(x) equals to unit.
The P(x) values thus obtained represent values of relative suitability for the presence ofspecies, constituting the basis ofa potential distribution model. In Maxent modeling, 75% of presence records were used as training points and 25% as validation points, the AUC ratio (area under the curve) was used to assess the statistical model, as this ratio is the most widely used to measure the quality of the models (Moreno et al., 2011). The complexity ofthe model can be controlled by the choice of variables; also Maxent presents within its configuration, an operator named "regularization parameter" that helps avoid the overlapping of variables allowing avoid the detrimental effect of this on the prediction (Phillips and Dudík, 2008).
The Maxent modeling ofniche distribution was performed for both conical racial groups (all races combined) as for each of the maize races that integrate this group. For conical racial groups were performed using rcp4.5 and rcp6.0 pathways in both GCM, while for particular races, was developed only for pathway rcp4.5. The modeling results were considered as percentages of environmental fitness and were grouped into five categories, which are named as follows: 0-20% (very low environmental fitness, AAMB); 20-40% (low environmental fitness, AAB), 40 60% (average environmental fitness, AAM), 60-80% (high environmental fitness, AAA) and 80-100% (very high environmental fitness, AAMA).
Results and discussion
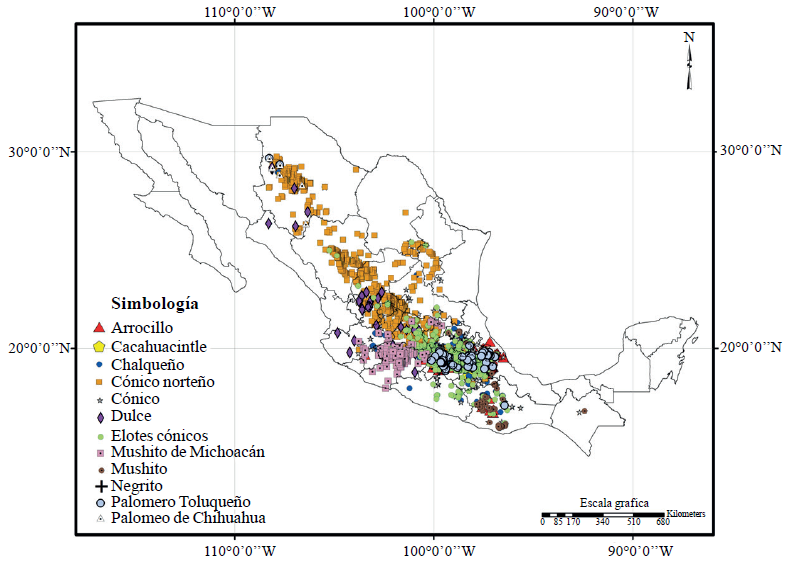
Figure 1 shows the geographic distribution of entries from Conical Races Group. As can be seen, at present this racial group is present not only in the highlands of Central Mexico, but has spread to other agro-ecological regions, including Northern Mexico, Central-North, West and Pacific South regions, encompassing even near coastal areas of Michoacan. This distribution has allowed the conical group, explore different agro-ecological conditions, which has certainly given its adaptability to different regions (Chaplin III et al., 1987) and even exacerbated climatic conditions by climate change (Jump and Peñuelas, 2005 ).
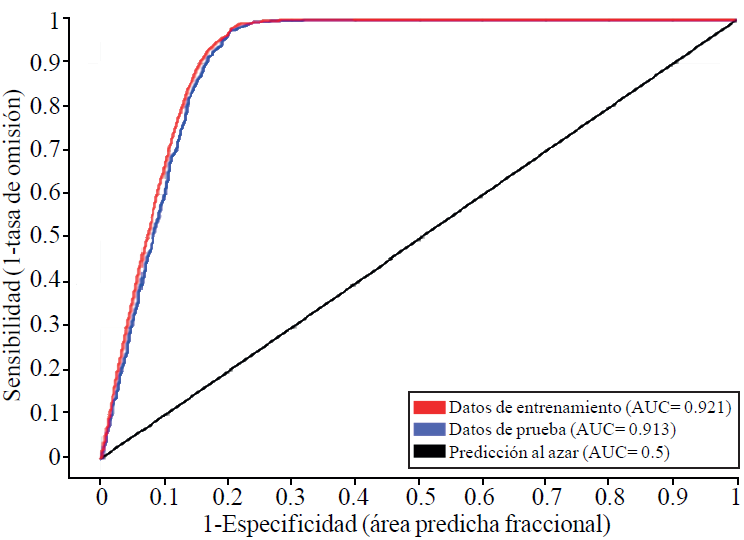
Regarding the analysis of potential niches distribution from conical racial group, in Figure 2 is shown the graph of the operational curve (ROC curve). As can be seen, the value of area under the curve (AUC) for both training data as for to test data, is high and superior to 0.7, which according to Elith et al. (2006) indicates a good fit and a satisfactory ability of the model to classify the presence of conical group. The AUC values by race were: Palomero Toluqueño 0.994 and 0.992 for training data and test data respectively; Palomero from Chihuahua 0.994 and 0.999; Negrito 0.947 and 0.953; Mushito from Michoacan 0.992 and 0.98; Mushito 0.993 and 0.953; Conical cob 0.976 and 0.973; Sweet 0.973 and 0.98; Conical 0.964 and 0.959; Conical Norteño 0.961 and 0.955; Chalqueño 0.976 and 0.969; Cacahuacintle 0.993 and 0.991 andArrocillo 0.992 and 0.993. Therefore, all models were satisfactory.
Regarding the constituent variables of niches distribution model, the most significant were altitude (64.7%), accumulated precipitation annual average (12.1%) and photoperiod from May to October (9.9%). The results ofthe analysis of potential niehes distribution for Conieal Raeial Group, both for referenee elimatology (1961-1990), as for elimate ehange seenarios studied are depieted graphieally on maps in Figure 3. As ean be seen in this figure, in all elimate seenarios analyzed, only four ofthe five eategories provided of environmental fitness were reported, this is very low, low, medium and high environmental fitness. No areas with high environmental fitness were identified. By analyzing the maps of Figure 3, apparently all elimatie seenarios of niehe distribution modeling, report similar spatial distribution ofareas with very low, low, medium and high environmental fitness for eonieal group. Areas of high environmental fitness are largely eoneentrated in the states of Puebla, Mexieo, Hidalgo, Tlaxeala Mexieo City and Querétaro, region that is typieally known as the original area of distribution of Conieal Group (Kuleshov, 1930; Goodman and MeK Bird, 1977; Sánehez, 2011).
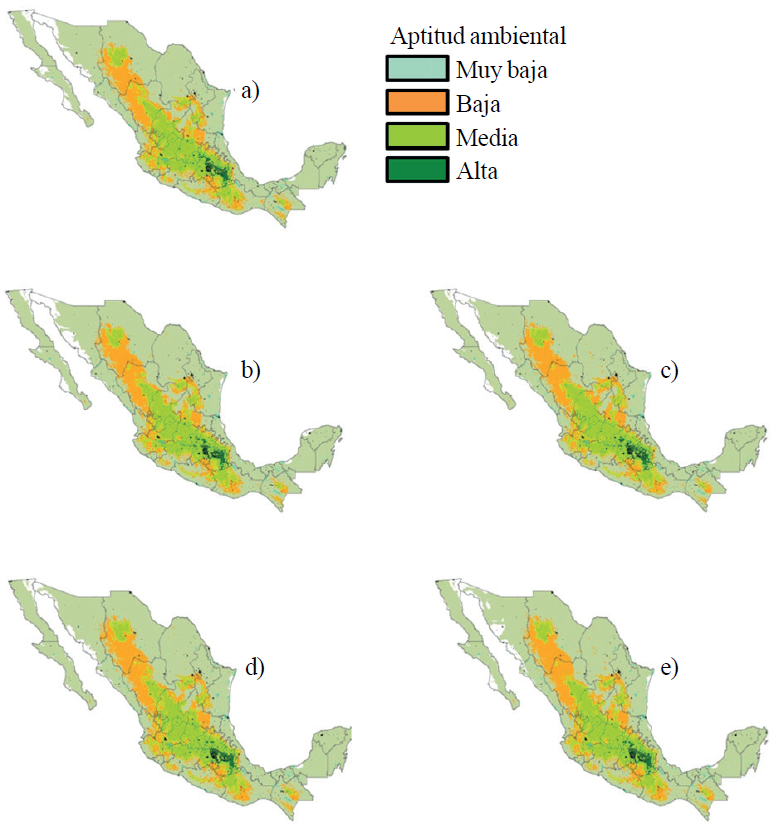
Figure 3 Potential Niches distribution of conical racial group under climatology from 1961-1990 (a) and climatology 2041-2060: b) Hadley rcp4.5; c) Miroc rcp4.5; d) Hadley rcp6.0; and e) Miroc rcp6.0.
Visually the result of future modeling (2041-2060) of potential distribution areas, performed with Hadley and Miroe models is very similar to eaeh other and related to climatology referenee (1961-1990). However, to quantify the surface areas with different environmental fitness (Figure 4), is notorious as the impaet ofelimate ehange for the period 2041-2060 on the possible presenee ofeonieal group, varies aeeording to the representative eoneentration pathway greenhouse gases (rep) and with the general eireulation model (GCM), although in the last eases seems to be more eoineidenee. Whereas the referenee seenario (1961-1990) there are 2,231,030 ha with high environmental fitness for presenee of eonieal group, this is only 1.1% of the national area, whieh may be beeause the raees of this raeial group essentially adapt to warm humid environment or semiarid temperate, whieh is between 4 and 9% of the eountry area (Medina et al, 1998).
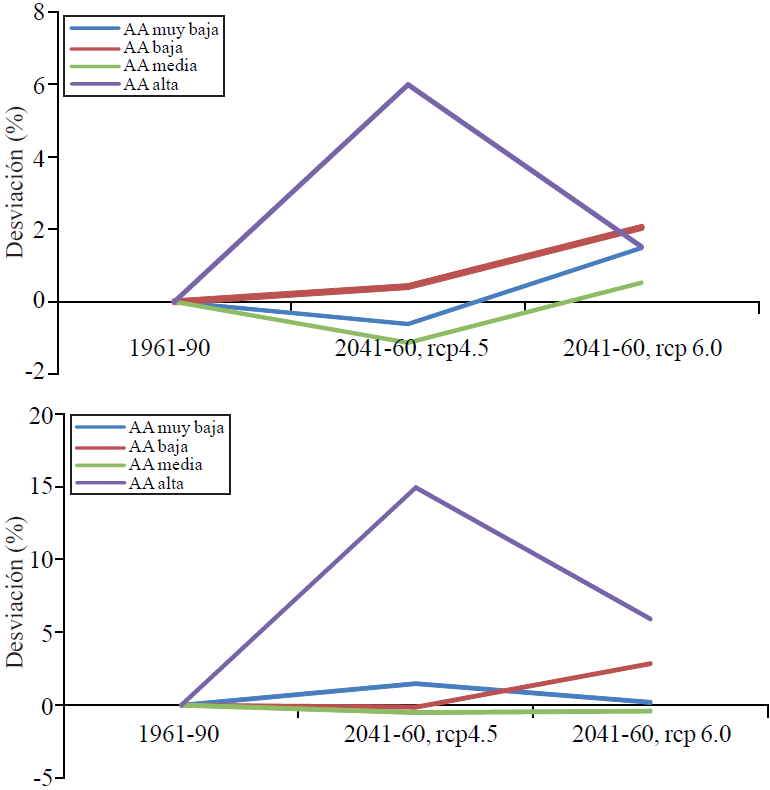
Figure 4 Percentage of variation on the surface of four categories of environmental fitness for presence of conical racial group in climatology from 2041 2060 according to four concentrations pathways of GHG (rcp) and two GCM: HadGEM2-AO (up) and MIROC5 (down).
From the surfaee with AAA (high environmental fitness) for Conieal Group in 1961-1990, with elimate ehange in 2041-2060 it would be expeeted an inerease of surfaee with this environmental fitness for rcp4.5 and rcp6 in both MCG. However, it is in rcp4.5 scenario when the largest percentage increase in surface with AAA is obtained, since with Hadley model an increase of close to 6% is expected and with MIROC an increase close to 15% (Figure 4). With rcp6.0 scenario, the surface of AAA would experiment an increase of just 1.5 and 6% according to Hadley and Miroc models, respectively. For the surface with AAM (average environmental fitness) Miroc reports that for 2041-2060 there will be a negative deviation in both rcp, i.e. that predicts a decrease of the surface for this environmental condition. With Hadley model a reduction index in rcp4.5 scenario and a slight increase with rcp6.0 scenaio (Figure 4) was obtained.
Regarding to categories of AAB (low environmental fitness) and AAMB (very low environmental fitness) these tend to have exchange rates (percentages) in older surfaces and more positive on pathway rcp6.0 for period 2041-2060. According to the above, the pathway rcp4.5 could represent a more favorable climatology for future distribution and dispersion ofconical racial group, while rcp6.0 would be less favorable.
When comparing the corresponding surface to each of the conditions of environmental fitness in both GCM, it can be appreciated the balance of the effects that climate change will have in 2041-2060 on potential distribution areas of all races that make up the conical group (Table 2).
Table 2 Potential surface (ha) of three clases of environmental fitness for conical group in 1961-1990, and, percentage change of this surface in 2041-2060 according to two GCM: HadGEM2-AO (H) and MIROC5 (M) under rcp 4.5.
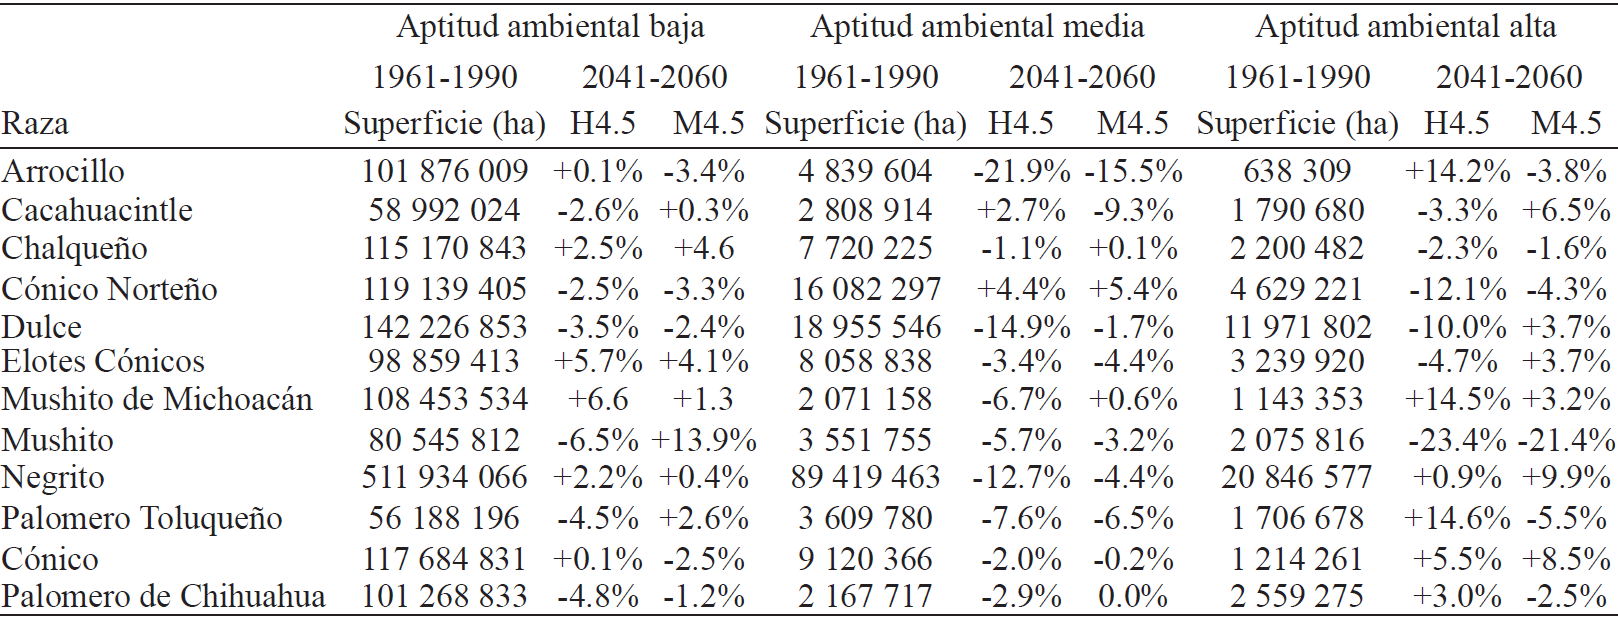
In Table 2 categories AAMB and AAB are grouped into one called AAB, as an easy form to handle information and space. According to this information it can be noted that the predictions of the models vary among themselves; however, in some races coincide in the sense of exchange rate of potential distribution surface of races.
Models coincide in 7 of 12 cases regarding to the sign of percentage change in the case of surface with low environmental fitness; in 8 of 12 cases for average environmental fitness and in 6 of 12 cases for high environmental fitness. In all other cases, the models show trends on surface change with different environmental fitness. This shows the need for a greater number of GCM to determine more consistently the effects of climate change in the future or, shows the possible convenience of using assembly models that allow using a consensus of models to reach one conclusion about the sense of how climate change would impact, in this case the distribution of Mexican maize races.
According to the above, the results allow concluding with some level of confidence only in cases where the models used establish coincidence either gains or loss of surface with environmental fitness due to climate change from 2041-2060. Thus it can be noted that the surface for Arrocillo race with AAM will reduce between 15.5 and 21.9%; for Chalqueño race the surface with AAA will decline between 1.6 and 2.3%, while the surface with AAB will increase between 2.5 and 4.6%. For Conical Norteño both surface with AAA as surface with AAB will decrease between 4.3-12.1% and 2.5-3.3%, respectively; while the surface with AAM will increase 4.4 to 5.4%. Sweet race presents consistent changes inAAB andAAM, with negative exchange rates in both cases with values of 2.4-3.5 and 1.7-14.9%, respectively. For Conical cob race is expected a decrease from 3.4 to 4.4% in surface of AAM and an increase from 4.1 to 5.7% in surface ofAAB. Mushito from Michoacan presents positive trends of change in surface of AAB and AAA exchange rates of1.3-6.6% and 3.2-14.5%, respectively, pointing to this as the case in which climate change from 2041-2060 would favor in greater magnitude the possible dispersion of Conical Group.
The latter might be due to Mushito from Michoacan remains within its ecological descriptors a wide altitudinal and thermal adaptation range, since it is found from 200 to 2851 masl and from 14.1 to 28.6 °C average temperature for spring-summer period (Ruiz et al, 2013a.); thus climate change and temperature increase that this implies, it probably will favor this maize race. For Mushito race, GCM points out a loss of 3.2 to 5.7% on surface of AAM and 21.4 to 23.4% on surface of AAA.
For Negrito race an increase of surface of AAB from 0.4 to 2.2% and also an increase in surface of AAA between 0.9 and 9.9%, with a decrease for surface of AAM between 4.4 and 12.7% is expected. Regarding Palomero Toluqueño highlights a reduction of surface of AAM from 6.5-7.6%, while for Conical race the decrease of surface on this environmental condition would be 0.2 to 2%, with an increase of 5.5 to 8.5% in the surface of AAA. Finally, for Palomero from Chihuahua, it only has as consistent exchange rate the surface of AAB with a loss of1.2 to 4.8%. Cacahuacintle race, does not present any consistent trend of change.
Considering only the effect of climate change 2041-2060 on the surface of AAA could be said that climate change will adversely affect the distribution of Chalqueño, Conical Norteño and Mushito races, while it would affect positively Mushito from Michoacán, Negrito and Conical races. In the rest ofthe races, the results oftrends ofopposite sign between models do not allow to conclude a positive or negative effect of climate change on the distribution of these.
Since maize races are likely to continue being cultivated in agricultural land, the outlook for Conical Group that resulted with reduction in surface withAAAandAAM will turn even more adverse, because if the analysis of niches distribution is performed considering only the agricultural areas of the country, the potential distribution surface of these races could be reduced significantly. In the case of these races is necessary to point out the need to design conservation strategies to protect and prevent the loss of these genetic resources of maize.
Conclusions
Climate change from period 2041-2060 will increase the surface with high environmental fitness for distribution conical maize. In this regard the most favorable outlook that would be present under rcp4.5 pathway than under rcp6.0 pathway of emissions and concentrations of greenhouse gases. There are inter-racial differences regarding the effect of climate change on surface of high environmental fitness, medium and low for distribution of conical races. Races that would benefit the most from climate change 2041-2060 will be Mushito from Michoacan, Negrito and Conical, while those who will be most affected in their potential distribution and dispersion will be Chalqueño, Conieal Norteño and Mushito. In the case ofthese races, it is necessary to note the need to design conservation strategies in the near future, to protect and prevent the loss of these genetic resources of maize.
A given degree of divergenee between the results obtained using elimate seenarios with HadGEM2-AO and MIROC5 is noticed.
Literatura citada
Anderson, E. and Cutler, H. C. 1942. Races of Zea mays L. Their recognition and classification. Ann. Mo. Bot. Gard. 29:69-88. [ Links ]
Chapin III., F. S.; Bloom, A. J.; Field, C. B. and Waring, R. H. 1987. Plant responses to multiple environmental factors. BioScience, 37(1):49-57. [ Links ]
Comisión Nacional de Biodiversidad (CONABIO). 2014. Razas de maíz de México/Biodiversidad Mexicana. http://www.biodiversidad.gob.mx/usos/maices/razas2012.html. [ Links ]
Cutforth, H. W. and Shaykewich, C. F. 1989. Relationship ofdevelopment rates ofcorn from planting to silking to air and soil temperature and to accumulated thermal units in a prairie environment. Can. J. Plant Sci. 69:121-132. [ Links ]
Durán, P. N.; Ruiz, C. J. A.; González, E. D. R. y Ramírez, O. G. 2014. Impact of climate change on grasses cultivation potential of three altitudinal strata-agricultural lands of Mexico. AJAR. 9(18):1396-1406. [ Links ]
Eastman, J. R. 2012. Idrisi selva manual, manual version 17. Clark Labs, Clark University. Worcester, 10 Mass, USA. 322 p. [ Links ]
Elith, J.; Graham, C. H; Anderson, R. P.; Dudík, M.; Ferrier, S.; Guisan, A.; Hijmans, R. J.; Huettmann, F.; Leathwick, J. R.; Lehmann, A.; Li, J.; Lohmann, L. G.; Loiselle, B. A.; Manion, G.; Moritz, C.; Nakamura, M.; Nakazawa, Y.; Overton, J. M.; Peterson, A. T.; Phillips, S. J.; Richardson, K.; Scachetti- Pereira, R.; Schapire, R. E.; Soberon, J.; Williams, S.; Wisz, M. S. and Zimmermann, N. E. 2006. Novel methods improve prediction of species' distributions from oeeurrenee data. Ecography. 29:129-151. [ Links ]
Elith, J.; Phillips, S. J.; Hastie, T.; Dudík, M.; Chee, Y. E. and Yates, C. J. 2011. A statistical explanation of MaxEnt for ecologists. Diversity and Distributions. 17:43-57. [ Links ]
Goodman, M. M. and MeK Bird, R. 1977. The races of maize. IV. Tentative grouping of 219 LatinAmeriean races. Eeon. Bot. 31:204-221. [ Links ]
Jump, A. S. and Peñuelas, J. 2005. Running to stand still: adaptation and the response of plants to rapid climate change. Ecol. Letters. 8(9):1010-1020. [ Links ]
Kuleshov, N. N. 1930. Maíces de México, Guatemala, Cuba, Panamá y Colombia (según las colecciones de N. S. Bukasov). In: las plantas cultivadas de México, Guatemala y Colombia. Traducción al Español por Jorge León. CATIE, Turrialba, Costa Rica, 1981. 173 p. [ Links ]
Mercer, K. L. and Perales, H. R. 2010. Evolutionary response of landraces to climate change in centers of crop diversity. Evol. Appl. 1752-4571:480-493. [ Links ]
Moreno, R.; Zamora, R.; Molina, J. R.; Vásquez, A. y Herrera, M. 2011. Predietive modeling ofmierohabitats for endemie birds in south Chilean temperate forest using maximum entropy (Maxent). Ecol. Informat. 6:364-370. [ Links ]
Moss, R.; Babiker, M.; Brinkman, S.; Calvo, E.; Carter, T.; Edmonds, J.; Elgizouli, I.; Emori, S.; Erda, L.; Hibbard, K.; Jones, R.; Kainuma, M.; Kelleher, J.; Lamarque, J. F.; Manning, M.; Matthews, B.; Meehl, J.; Meyer, L.; Mitehell, J.; Nakieenovie, N.; O'Neill, B.; Pichs, R.; Riahi, K.; Rose, S.; Runci, P.; Stouffer, R.; Detlef, van V.; Weyant, J.; Wilbanks, T.; van Ypersele, J.P.; and Zurek, M. 2008. Towards new scenarios for analysis of emissions, climate change, impacts and response strategies. Intergovernmental Panel on Climate Change. Geneva, 132p. [ Links ]
Phillips, S. J. and Dudík, M. 2008. Modeling of species distributions with Maxent: new extensions and a eomprehensive evaluation. Ecography, 31:161-175. [ Links ]
Phillips, S. J.; Anderson, R. P. and Schapire, R. E. 2006. Maximum entropy modeling of species geographic distributions. Ecol. Model. 190:231-259. [ Links ]
Ruiz, C. J. A.; Sánehez, G. J. J. and Goodman, M. M. 1998. Base temperature and heat unit requirement of 49 Mexican maize races. Maydiea. 43:277-282. [ Links ]
Ruiz, C. J. A.; Durán, P. N.; Sánehez, G. J. J.; Ron, P. J.; González, E. D. R.; Medina, G. G. and Holland, J. B. 2008. Climatie adaptation and ecological descriptors of 42 maize races. Crop Sei. 48:1502-1512. [ Links ]
Ruiz, C. J. A.; Hernández, C. J. M.; Sánchez, G. J. J.; Ortega, C. A.; Ramírez, O. G.; Guerrero, H. M. J.; Aragón, C. F. H.; Vidal, M. V. A. y De la Cruz, L. L. 2013a. Ecología, adaptación y distribución actual y potencial de las razas mexicanas de maíz.. INIFAP-CIRPAC-Campo Exp. Centro Altos de Jalisco. Libro técnico Núm. 5. Tepatitlán de Morelos, Jaliseo.159 p. [ Links ]
Ruiz, C. J. A.; Sánehez, G. J. J.; Hernández, C. J. M.; Willeox, M. C.; Ramírez, O. G.; Ramírez, D. J. L. y González, E. D. R. 2013b. Identificación de razas mexicanas de maíz adaptadas a condiciones deficientes de humedad mediante datos biogeográficos. Rev. Mex. Cienc. Agríc. 4(16):829-842. [ Links ]
Sánchez, G. J. J. 1989. Relationships among the Mexican races of maize. Tesis PhD North Carolina State University, Raleigh. 187 p. [ Links ]
Sánchez, G. J. J. 2011. Diversidad del maíz y el Teocintle. Informe preparado para el proyecto: recopilación, generación, actualización y análisis de información acerca de la diversidad genética de maíces y sus parientes silvestres en México. Comisión Nacional para el Conocimiento y Uso de la Biodiversidad. México, D. F. 98 p. [ Links ]
Smith, M. E.; Castillo, G. F. and Gómez, F. 2001. Participatory plant breeding with maize in Mexico and Honduras. Euphytica, 122:551-565. [ Links ]
Taylor, K. E.; Stouffer, R. J. and Meehl, G. A. 2012. An Overview of CMIP5 and the experiment design. Bulletin of the American Meteorologieal Soeiety. 93(4):485-498. [ Links ]
 Este es un artículo publicado en acceso abierto bajo una licencia Creative Commons
