


Servicios Personalizados
Revista
Articulo
 Inglés (pdf)
 Artículo en XML
 Referencias del artículo
 Enviar artículo por email
Indicadores
-
 Citado por SciELO
 -
 Accesos
Links relacionados
-
 Similares en
SciELO
Similares en
SciELO
Compartir

 Permalink
Revista mexicana de ciencias agrícolas
versión impresa ISSN 2007-0934
Rev. Mex. Cienc. Agríc vol.1 no.3 Texcoco jul./sep. 2010
Artículos
Large-area dry bean yield prediction modeling in Mexico*
Modelo regional para predecir el rendimiento de frijol de temporal en México
Guillermo Medina-García1, Alma Delia Baez-González2§, Jesús López-Hernández3, José Ariel Ruíz-Corral4, Carlos Alberto Tinoco-Alfaro5 and James R. Kiniry6
1Campo Experimental Zacatecas. INIFAP. Carretera Zacatecas-Fresnillo, km 24.5. Calera, Zacatecas, México. C. P. 98600. Tel. 478 9850198. (medina.guillermo@inifap.gob.mx).
2Campo Experimental Pabellón. INIFAP. Carretera Aguascalientes-Zacatecas, km 32.5. Pabellón, Aguascalientes, México. C. P. 20600. §Corresponding author: baez.alma@inifap.gob.mx.
3Campo Experimental Valle del Guadiana. INIFAP. Carretera Durango-El Mezquital, km 5. Durango, Durango, México. C. P. 34000.
4Campo Experimental Centro Altos de Jalisco. INIFAP. Carretera libre Tepatitlán-Lagos de Moreno, km 8. Tepatitlán, Jalisco, México. C. P. 47600.
5Campo Experimental Cotaxtla. INIFAP. Ocampo Núm. 234. Desp. 322. Veracruz, Veracruz, México. C. P. 91700.
6United States Department of Agriculture (USDA). Agricultural Research Service (ARS). Grassland Soil and Water Research Lab. 808 East Blackland Road, Temple, TX 76502, USA.
* Recibido: febrero de 2010
Aceptado: julio de 2010
Abstract
Given the importance of dry bean in Mexico and the need of know their production before the harvest, for the authorities of the agricultural sector, in order to define support to producers according to the expected harvest volume. The aim of this study was to develop an empirical model to estimate the yield of dry bean at the regional level prior to the harvest. An empirical dry bean (Phaseolus vulgaris L.) yield model that incorporates data on climate, leaf area index and yield components was developed for Zacatecas state, the major bean-producing area of Mexico, with 2005 data from 54 sampling sites planted with Negro San Luis, Flor de Mayo and Flor de Junio varieties of dry bean. Precipitation, leaf area index, number of pods per plant, grains per pod and plant, weight of 100 grains, plant density and grain yield data were obtained, and correlation and multiple regression analyses were made using 2005 data and the Statistical Analysis System (SAS) program. The model was validated with 2006 and 2007 data from 53 and 59 farmers' sites, respectively, in Zacatecas. Additionally, it was tested with 2006 and 2007 data from 34 and 36 sites, respectively, in the adjoining state of Durango, whose bean varieties and climatic, farmland, and crop management conditions are similar to those of Zacatecas. The results were highly significant (p<0.0001, R2= 0.88), indicating that the model can be used for large-area yield prediction at least one month before the crop is gathered from the field in Zacatecas and Durango, which comprise over 850 000 ha for bean. The predictions can complement those made early in the growing season for this region. Further studies are needed to determine the applicability of the model and the methodology of prediction to other bean-producing regions with similar climate and management conditions.
Key words: dry bean, leaf area index, modeling, yield components.
Resumen
Dada la importancia del cultivo de frijol de temporal en México y la necesidad de conocer su producción antes de la cosecha por parte de las autoridades del sector agropecuario, para poder definir apoyos a los productores de acuerdo al volumen de cosecha esperado. El objetivo de este estudio fue desarrollar un modelo empírico para estimar el rendimiento de frijol de temporal a nivel regional con anticipación a la cosecha. Se generó un modelo empírico para estimar el rendimiento de frijol (Phaseolus vulgaris L.) de temporal, el cual incorpora datos de clima, índice de área foliar y componentes del rendimiento, para el estado de Zacatecas, el mayor productor de frijol en México. En el año 2005 se muestrearon 54 parcelas de productores sembradas con variedades de frijol Negro San Luis, Flor de Mayo y Flor de Junio bajo condiciones de temporal. Se obtuvieron datos de precipitación, índice de área foliar, número de vainas por planta, granos por vaina, peso de 100 granos, densidad de siembra y rendimiento de grano, con ellos (año 2005) se realizaron análisis de correlación y regresión múltiple utilizando el programa SAS (Statistical Analysis System). El modelo fue validado con datos de 53 sitios de muestreo de 2006 y 59 de 2007, del estado de Zacatecas. Adicionalmente, fue probado con datos de 34 y 36 sitios de muestreo en esos mismos años en el estado de Durango, en donde las variedades de frijol, el clima y el manejo de cultivo son similares a las condiciones presentes en el estado de Zacatecas. El modelo resultó altamente significativo (P<0.0001, R2=0.88); lo cual indica que puede ser utilizado para predecir el rendimiento en grandes regiones, al menos un mes antes de la cosecha de frijol en Zacatecas y Durango, los cuales comprenden alrededor de 850 000 hectáreas. Las predicciones pueden complementarse haciéndose en la estación temprana de crecimiento del cultivo para esta región. Son necesarios otros estudios para determinar la aplicabilidad del modelo y la metodología de predicción a otras regiones que producen frijol en con condiciones similares de clima y manejo.
Palabras clave: componentes del rendimiento, índice de área foliar, frijol, modelación, rendimiento.
INTRODUCTION
The bean (Phaseolus vulgaris L.) crop occupies second place in Mexico in terms of cultivated area. Approximately a million and a half hectares are planted to bean each year. In the state of Zacatecas, where it is the most important crop, an average of 600 000 ha has been planted to bean in recent years, making it the major bean-producing state under dryland conditions in Mexico. Durango comes second with 250 000 ha. These two states comprise the major bean-producing region, with over 850 000 ha representing 57.1% of the total area in Mexico for bean production under dryland conditions (SIAP, 2009).
Large-area yield prediction methodologies for different crops have been developed to increase the grade of reliability in estimates and hence, better aid decision-making in agriculture (Báez-González et al., 2002; Bootee et al., 2003; Lobell et al., 2007). Simulation models of crop growth and development have been created for bean (Hoogenboom et al., 1994; Adikua et al., 2001; Villalobos and Retana, 2003; Moreau-Valancogne et al., 2008) and other crops like maize (Zea mays L.) (Báez-González et al., 2002), cereals (Tsubu et al., 2005), and soya (Glycine max) (Pedersen et al., 2008). Climate variables such as precipitation (Acosta-Díaz et al., 2007), physiological indices such as leaf area index (Báez-González et al., 2005), and components of yield (Shenkut and Brick, 2003) are among the parameters that have been used for yield models, though, to our knowledge, they have not been jointly used for bean yield prediction modeling in Mexico.
Water is a major limiting factor in bean production. Acosta-Díaz et al. (2007) found a strong relation between yield of bean grain and water availability; yield was reduced in treatments with drought in a greenhouse study. Amador-Ramírez et al. (2007) likewise found that the relation between yield of bean under dryland conditions and leaf area index could be affected by precipitation. Among the stages of development of bean, the reproductive stage is especially vulnerable to drought (Acosta-Gallegos and Kohashi-Shibata, 1989; Nielsen and Nelson, 1998). It is during this stage that there is maximum demand for inputs. Acosta-Gallegos et al. (1998) point out that deficient and erratic precipitation regimes during the vegetative and reproductive stages of the bean plant affect yield.
Leaf area index (LAI) is the ratio of total upper leaf surface of vegetation divided by the surface area of the land on which the vegetation grows (Tanaka and Yamaguchi, 1977; Waring et al., 1982). The leaf area index may vary among sites due to crop variety, management, development conditions and the interaction among these factors (Díaz et al., 2001). A correlation between maize yield and leaf area index has been reported by Báez-González et al. (2002), while Padilla et al. (2005); Amador-Ramírez et al. (2007), found a significant relation between leaf area index measured in the phase of formation and filling of pods and bean yield under dryland conditions.
Yield components are quantitative parameters of the morphology of a plant that, when combined, have a value equal to the yield (White, 1988). Components of dry bean yield have been studied to determine their relation with yield. Singh (1995) reports a low negative correlation between yield and seed weight while Ramírez-Vallejo and Kelly (1998) mention inconsistent correlations between components of yield and yield in conditions of stress and no stress. On the other hand, Nienhuis and Singh (1988) and Infante et al. (2003) found a positive correlation between yield of bean under dryland conditions and its components. Westermann and Crothers (1977) and Shenkut and Brick (2003) reported a high correlation between yield and the number of pods per plant, but not with the number of grains per pod or weight of grains. Amador-Ramírez et al. (2007) suggest that further studies be conducted to add yield components such as number of pods (Singer et al., 2004) to LAI and climate parameters in order to improve the accuracy of bean yield model predictions.
A model is a schematic representation of the conception of a system or a set of equations, which represents the behavior of a system. A model is, by definition "a simplified version of a part of reality, not a one to one copy". New agricultural research is needed to supply information to farmers, policy makers and other decision makers on how to accomplish sustainable agriculture over the wide variations in climate around the world (Murthy, 2004). Crop yield forecasts using combined climate and crop modeling systems enable estimation of the impacts of climate variability on food production. The objective of a model is to reproduce the impact of weather on observed crop yield (Challinor et al., 2004; Van Den Berg and Smith, 2005).
The objective of this study is to develop an empirical model for estimating dry bean grain yield in large areas using a methodology that combines climatic data and non-destructive field sampling of leaf area index and yield components.
MATERIALS AND METHODS
Model construction
To develop the model, we used data obtained from farm sites in Zacatecas. This Mexico state, along with the state of Durango, is located in northern central Mexico, in the zone called Altiplano Mexicano. An annual average temperature of 15 to 17 °C and an annual precipitation of 300 to 600 mm (Medina and Ruiz, 2004; Medina et al., 2005) characterize this region.
In 2005, 54 sampling sites were established on farm sites in Zacatecas that had been planted with Negro San Luis, Flor de Mayo y Flor de Junio varieties of bean under dryland conditions (Figure 1). The plant variables considered in the model, i.e., yield components and LAI, when measured in the field, were expected to consider any differences that may exist among the different varieties. These sites were established at random, considering areas that were at least two hectares and had the same planting date as the majority of the sites. They were identified and located geographically after the crop had been established, approximately when the bean crop was in the vegetative stage V3-V4 (Schoonhoven and Pastor-Corrales, 1987), with one to three open trifoliate leaflets, 30 days after sowing (DAS).

At the start of flowering (48 DAS), sampling of leaf area index (LAI) was done observing a 10-day interval between samplings in order to determine the maximum value for this index. During each sampling, four replications were made for each site. LAI was measured using a linear ceptometer (Decagon Devices, 2003).
When most of the pods were full (73 DAS), we counted the number of filled pods per plant and grains per pod in five plants with four replications on each sampling site. At 88 DAS, we measured the density of the population and the production of grain to estimate the yield and the weight of 100 grains, both at 12% water content. To estimate bean production, we harvested bean in 7.6 m2 with four replications. The number of grains per pod and the number of pods per plant were used to calculate the grains per plant. We used precipitation data for the growing season recorded daily by the 36 automatized meteorological stations of the agroclimatological monitoring network of the state of Zacatecas (Figure 1). We obtained data of accumulated precipitation every 10 days, the total accumulated precipitation of each month and of the full growing season.
To develop the model, we used the 2005 data of the following variables: leaf area index, number of pods per plant, grains per pod, and grains per plant, weight of 100 grains, population density, grain yield and accumulated precipitation during different periods of the growing season. A multiple correlation and regression analysis was made using the Statistical Analysis System program (SAS, 2001).
Model validation
Validation is the process of comparing the model with a set of independent observations to verify if the model has been developed as expected (Richardson and Berish, 2003). In this case, the bean model was validated using 2006 and 2007 data gathered from farmers' fields in Zacatecas.
During the 2006 and 2007 growing seasons, LAI was sampled once during the R7 phenological stage, which corresponds to the formation of pods (Schoonhoven and Pastor-Corrales, 1987); since this is the stage of maximum LAI. Later, during the R8 phase (filling of pods), filled pods per plant, grains per pod and density of the population were measured in the same way as in 2005.
A regression analysis was made of the observed yield values for 2006 and 2007 and those estimated by the model. Model precision in the estimation of bean production was based on the following assumptions: for an acceptable R2, the slope must not be significantly different from 1 and the intercept must not be significantly different from 0 (White et al., 2007). The estimated values of the model have optimum precision when the slope is close to 1, indicating that for each unit of observed production, there is a corresponding unit of estimated production (Fritz et al., 1997; Khorsandi et al., 1997; Amador-Ramírez et al., 2007).
For comparisons of model performance during the two years (2006 and 2007), the mean squared deviation (MSD) for grain yield was calculated as well as each of its three components: the squared bias (SB), the lack of correlation weighted by the standard deviation (LCS), and the squared difference between standard deviations (SDSD) (Kobayashi and Salam, 2000).
To test the capability of the model to predict bean yield in other important bean-producing areas of Mexico, the bean model was also run using field data from the adjoining state of Durango, which has similar soil, climate and management conditions as Zacatecas. The hypothesis of this second validation is that due to the similar conditions of the two states, the model developed for Zacatecas can also be used in Durango to predict dry bean yield with the same level of precision as in Zacatecas.
The field data of Durango was sampled just like in Zacatecas, in 34 and 36 farm sites in 2006 and 2007, respectively (Figure 2). With these data, the model was validated for each year, considering sampling sites yield. Precipitation data were obtained from the automatic weather stations network of Durango (Figure 2). The statistical analysis applied was similar to that used for the Zacatecas data.

The total production of the state of Durango for 2006 and 2007 was obtained by multiplying the simulated mean yield of all the sampling sites by the total surface sown to bean in the state. The simulated yield was then compared with actual yield reported by SIAP (Servicio de Informacion Agroalimentaria y Pesquera).
RESULTS AND DISCUSSION
Model construction
The best model resulting from the data of yield, yield components, precipitation, and leaf area index of 54 sampling sites during 2005 in the state of Zacatecas is as follows:
GY= –555.95916+74.52122PDP+62.86604LAI+ 1.33191PPAUG+0.00515PD–7.1725GPP
Where: GY= grain yield; PDP= number of pods per plant; LAI= leaf area index; PPAUG= precipitation for the month of August; PD= population density; GPP= grains per plant.
The model was highly significant (p<0.0001), n= 54 and R2= 0.88. Its coefficient of determination was good since it explained almost 90% of the total variance, taking into account the great variability in farmland conditions, precipitation, and crop management. Similar to what has been reported by Westermann and Crothers (1977); Shenkut and Brick (2003), a close relationship was found between yield and its components. In this model, PDP (number of pods per plant) was the component that contributed the most, explaining 82% of the total variance.
Other variables closely related to yield were leaf area index, as has also been previously reported for crops like maize and wheat (Báez-González et al., 2002; Amador-Ramírez et al., 2007), and accumulated precipitation for the month of August, which generally corresponded with the stage of maximum development of the crop, i.e., the stages of flowering and filling of pods (Acosta-Gallegos et al., 1998).
The model was able to predict dryland bean yield production at least one month before the mexican farmers gathered the bean from the field. This one-month period included the time after the pods had filled and become mature, when the plants were left in the field to allow the grains to dry. According to FAO recommendations, it is not only the length of the growing season that must be taken into account when harvesting but also the degree of maturity of the grain, which must be appropriate to the succeeding treatments. The moisture content is an important factor to consider since the higher the moisture content at harvest time, the higher is the risk of losses due to mold, insects, etc (FAO, 2009).
Model validation
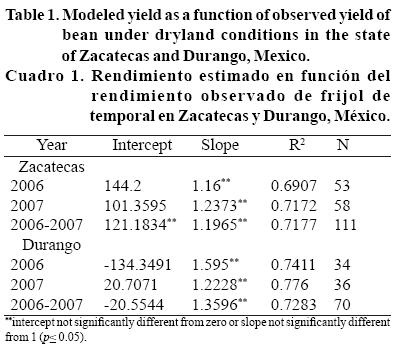
During the validation phase, the model made acceptable estimations for Zacatecas for the growing seasons of 2006 and 2007. The simulation of grain yield under dryland conditions showed a mean error of prediction (simulated minus measured) of 0.25 Mg ha-1 for 2006 and 0.22 Mg ha-1 for 2007. The growth model accounted for 69% of the variability in measured yield in 2006 and 71% for 2007 (Figure 3). These results closely approximate those of bean prediction studies conducted by Amador-Ramírez et al. (2007) who reported 65% and 71% accuracy for bean in Zacatecas and Shenkut and Brick (2003) who obtained 65% for bean in Ethiopia .The model satisfied the requirement that statistically, the intercept must not be different from 0 and the slope must not be different from 1 (Table 1) (White et al., 2007). This indicates that the model can be used to predict bean yield in Zacatecas under dryland conditions.

To measure the overall deviation of the model, the MSD for the two years of data was calculated (Table 2). The MSD value for 2007 was lower than that for 2006 (0.095 vs 0.114). The SB values (0.0619 for 2006 and 0.048 for 2007) show that the accuracy of the model was similar during the two years. The mean and standard deviations of predicted yield during 2006 and 2007 were 0.65 ± 0.29 and 0.5 ± 0.27 Mg ha-1, respectively. On the other hand, the mean and standard deviations of real yield for both years were 0.9 ± 0.4 and 0.72 ± 0.39 Mg ha-1, respectively.
The model showed similar values of LCS during the two years of validation. These results indicate that the model simulated in a similar way the pattern of fluctuations across measurements in the 111 sites regardless of the year, in the same way than Gauch et al. (2003). However, the magnitude of yield fluctuations was better simulated in 2006 than in 2007 (SDSD of 0.0129 for 2006 and 0.0148 for 2007) probably because of the different precipitation patterns in the central and southeast regions of Zacatecas.
The use of the model in Durango state with 2006 and 2007 data also had acceptable results since it complied with the requirement that statistically, the intercept must not be different from 0 and the slope not different from 1 (Table 1 and Figure 4). The simulation of grain yield under dryland conditions showed a mean error of prediction (simulated minus measured) of 0.33 Mg ha-1 for 2006 and 0.2 Mg ha-1 for 2007. The growth model accounted for 74% of the variability in measured yield in 2006 and 77% for 2007 (Figure 4). To measure the overall deviation of the model in the Durango study, the MSD for the two years of data was calculated (Table 2). The MSD value for 2007 was lower than that for 2006 (0.1006 vs. 0.2232). The SB values (0.1122 for 2006 and 0.0406 for 2007) indicate similar accuracy during the two years. The mean and standard deviations of predicted yield during 2006 and 2007 were 0.79 ± 0.29 and 0.81 ± 0.36 Mg ha-1, respectively, while the mean and standard deviations of real yield for both years were 1.12 ± 0.54 and 1.01 ± 0.5 Mg ha-1, respectively. These values approximate those reported by Báez-González et al. (2005) for an LAI-based yield model for maize.

The similar values of LCS during the two years of validation (0.043 for 2006, 0.05 for 2007) show that, just like in Zacatecas, the model simulated in a similar way the pattern of fluctuations across measurements in the 70 sites in Durango regardless of the year (Gauch et al., 2003). However, the magnitude of yield fluctuations was better simulated in 2007 than in 2006 (SDSD of 0.0676 for 2006 and 0.0099 for 2007). As has been explained earlier, this was expected since the quantity and distribution of precipitation in the area in 2005 (year of data for model construction) were similar to that in 2007. These results indicate that the bean model can be used to estimate bean grain yield at large scale, covering Zacatecas and Durango, the two most important bean-producing states of Mexico.
Official reports of the yield production of dry bean under non-irrigated condition in Zacatecas showed an average of 0.67 and 0.45 Mg ha-1 for the spring-summer growing seasons of 2006 and 2007, respectively (SIAP, 2009). Considering all sampling sites, the model predicted an average of 0.65 for 2006 and 0.5 Mg ha-1 for 2007 (Table 2). Therefore the error of prediction, was only 0.02 Mg ha-1 and 0.05 Mg ha-1 for 2006 and 2007, respectively. In the case of Durango, the mean error of prediction was 0.03 Mg ha-1 for 2006 and 0.028 Mg ha-1 for 2007 since average yield production was reported as 0.82 Mg ha-1 in 2006 and 0.53 Mg ha-1 for 2007 while the model predicted 0.79 Mg ha-1 and 0.81 Mg ha-1 for 2006 and 2007 (Table 2), respectively. Similar results were reported in beans by Amador-Ramírez et al. (2007) and notes that regardless of the type of model, there is a necessity to aid predicting dry bean yield in order for farmers in obtaining supports for grain commercialization, and also for decisions makers to predict yield.
CONCLUSIONS
The model using climatic data and data from non-destructive field sampling of leaf area index and yield components was able to predict bean yield of native and improved varieties at large scale in Zacatecas. It showed similar accuracy during the two years of model validation.
The use of the model with data from the neighboring state of Durango likewise showed similar accuracy, indicating that the model developed in Zacatecas has the capacity to predict bean yield in Durango.
Further studies can be made to determine the applicability of the model to neighboring areas with similar climate and crop management conditions. The model has the advantage of including variations in climate since they are implied in the samples of the yield components, which are influenced by this factor.
This modeling methodology is considered an improvement over the prevailing farm-by-farm estimation method that provides yield data weeks after harvest. It has the potential to be used for large-area dry bean yield prediction to benefit governmental decision-making at the regional level.
LITERATURE CITED
Acosta-Díaz, E.; Amador-Ramírez, M. D.; Padilla-Ramírez, J. S.; Gómez-Delgado, J. P. y Valadez-Montoya, H. 2007. Biomasa y rendimiento de frijol tipo flor de junio bajo riego y sequía. Agric. Téc. Méx. 33:153-162. [ Links ]
Acosta-Gallegos, J. A.; Acosta-Díaz, E.; Padilla-Ramírez, S.; López-Salinas, E.; Salinas-Pérez, R. A.; Mayek-Pérez, N. and Kelly, D. J. 1998. Seed yield of dry bean cultivars under drought stress. Ann. Rep. Bean Improv. Coop. 41:151-152. [ Links ]
Acosta-Gallegos, J. A. and Kohashi-Shibata, J. 1989. Effect of water stress on growth and yield of indeterminate dry bean (Phaseolus vulgaris L.) cultivars. Field Crop Res. 20:81-93. [ Links ]
Adikua, S. G. K.; Rengerb, M.; Wessolekb, G.; Facklamb, M. and Hecht-Bucholtz, C. 2001. Simulation of the dry matter production and seed yield of common beans under varying soil water and salinity conditions. Agric. Water Manag. 47:55-68. [ Links ]
Amador-Ramírez, M. D.; Acosta-Díaz, E.; Medina-García, G. and Gutiérrez-Luna, R. 2007. An empirical model to predict yield of rainfed dry bean with multi-year data. Rev. Fitotec. Mex. 3:311-319. [ Links ]
Báez-González, A. D.; Chen, P. Y.; Tiscareño-López, M. and Srinivasan, R. 2002. Satellite-based method of estimating corn yield in real time under irrigated and non-irrigated conditions in Mexico. Crop Sci. 42:1943-1949. [ Links ]
Báez-González, A. D.; Kiniry, J. R.; Maas, S. J.; Tiscareño, L. M.; Macias, J. C. M.; Richardson, C. W.; Salinas, J. G. and Manjarrez, J. R. 2005. Large-area maize yield forecasting using leaf area index based yield model. Agron. J. 97:418-425. [ Links ]
Boote, K. J.; Jones, J. W.; Batchelor, W. D.; Nafziger, E. D. and Myers, O. 2003. Genetic coefficients in the CROPGRO-soybean model: links to field performance and genomics. Agron. J. 95:32-51. [ Links ]
Challinor, A. J.; Wheeler, T. R.; Slingo, J. M.; Craufurd, P.; Grimes, D. I. F. and Chee-Kiat, T. 2004. The development of combined weather and crop yield forecasting systems for the tropics . Proceedings of 4th. International Crop Science Congress. Brisbane, Australia. 237 p. [ Links ]
Decagon Devices. 2003. AccuPAR model LP-80, PAR/LAI Ceptometer. Operator's Manual Version 1.0. Decagon Devices Inc. Pullman, WA. 87 p. [ Links ]
Díaz, M. C. E.; Figueroa, N. R. y Warnock, R. 2001. Estudio del crecimiento y desarrollo de la caraota (Phaseolus vulgaris L.) bajo diferentes densidades de población. II Evolución del índice de área foliar. Maracay. Rev. Fac. Agron. 27:55-66. [ Links ]
Organización de las Naciones Unidas para la Agricultura y la Alimentación (FAO). 2009. Agricultural engineering in development-the harvest. URL: http://www.fao.org/docrep/t0522e/T0522605.htm. [ Links ]
Fritz, J. O.; Vanderlip, R. L.; Heiniger, R. W. and Abelhalim, A. Z. 1997. Simulating forage sorghum yields with SORKAM. Agron. J. 89:64-68. [ Links ]
Gauch, H. G.; Hwang, J. T. G. and Fick, G. W. 2003. Model evaluation by comparison of model-based predictions and measured values. Agron. J. 95:1442-1146. [ Links ]
Hoogenboom, G.; White, J. W.; Jones, J. W. and Boote, K. J. 1994. BEANGRO: a process-oriented dry bean model with a versatile user interface. Agron. J. 86:182-190. [ Links ]
Infante, N.; Madriz, P. y González, T. 2003. Fases de desarrollo y componentes del rendimiento de tres cultivares de frijol mungo [Vigna radiata (L.) Wilczek] en Maracay, Aragua, Venezuela. Rev. Fac. Agron. 20:417-429. [ Links ]
Khorsandi, F. M.; Boone, Y. L.; Weerakkody, G. y Wishler, F. D. 1997. Validation of the soil temperature subroutine HEAT in the cotton simulation model GOSSYM. Agron. J. 89:415-420. [ Links ]
Kobayashi, K. and Salam, M. U. 2000. Comparing simulated and measured values using mean squared deviation and its components. Agron. J. 92:345-352. [ Links ]
Lobell, D. B.; Ortiz-Monasterio, J. I. and Falcon, J. I. 2007. Yield uncertainty at the field scale evaluated with multi-year satelite data. Agric. Syst. 92:76-90. [ Links ]
Medina, G. G. y Ruiz, C. J. A. 2004. Estadísticas climatológicas básicas del estado de Zacatecas (periodo 1961-2003). Instituto Nacional de Investigaciones Forestales, Agrícolas y Pecuarias. Centro de Investigación Regional Norte Centro. Campo Experimental Zacatecas. Calera de V. R. Zacatecas. Libro técnico. núm. 3. 240 p. [ Links ]
Medina, G. G.; Díaz, P. G.; López, H. J.; Ruiz, C. J. A. y Silva, M. M. 2005. Estadísticas climatológicas básicas del estado de Durango. (1961-2003). INIFAP-CIRNOC-CEVAG. Durango, Durango, México. Libro técnico. núm. 1. 224 p. [ Links ]
Moreau-Valancogne, P.; Coste, F.; Crozat, Y. and Düurr, C. 2008. Assessing emergence of bean (Phaseolus vulgaris L.) seed lots in France: field observations and simulations. Europ. J. Agronomy. 28:309-320. [ Links ]
Murthy, V. R. K. 2004. Crop growth modeling and its applications in agricultural meteorology. In: satellite remote sensing and GIS applications in agricultural meteorology. Ed. Sivakumar, M. V. K.; Roy, P. S.; Harmsen, K. and Saha, S. K. 235-261 pp. [ Links ]
Nielsen, D. C. and Nelson, N. O. 1998. Black bean sensitivity to water stress at various growth stages. Crop Sci. 38:422-427. [ Links ]
Nienhuis, J. and Singh, S. P. 1988. Genetics of seed yield and its components in common bean (Phaseolus vulgaris L.) of middle-america origin. Plant Breed 101:155-163. [ Links ]
Padilla, R. J. S.; Acosta, D. E.; Gaytán, R. B. y Rodríguez, V. M. M. 2005. Índice de área foliar en frijol de temporal y su relación con biomasa y rendimiento. Agric. Téc. Méx. 31:213-219. [ Links ]
Pedersen, P.; Boote, K. J.; Jones, J. W. and Lauer, J. G. 2004. Modifying the CROPGRO-soybean model to improve predictions for the upper Midwest. Agron. J. 96:556-564. [ Links ]
Ramírez-Vallejo, P. and Kelly, J. D. 1998. Traits related to drought resistance in common bean. Euphytica. 99:127-136. [ Links ]
Richardson, J. and Berish, C. 2003. Data and information issues in modeling for resource management decision making: communication is the key. In: Dale, V. H. (Ed). Ecological Modeling for Resource Management. Springer. New York. 167-179 pp. [ Links ]
Schoonhoven, A. y Pastor-Corrales, M. A. 1987. Sistema estándar para la evaluación de germoplasma de frijol. Centro Internacional de Agricultura Tropical. Cali, Colombia. 56 p. [ Links ]
Shenkut, A. A. and Brick, M. A. 2003. Traits associated with dry edible bean (Phaseolus vulgaris L.) productivity under diverse soil moisture environments. Euphytica. 133:339-347. [ Links ]
Servicio de Información Agroalimentaria y Pesquera (SIAP). 2009. Sistema de Información Agroalimentaria de Consulta (SIACON) Versión 2007. México. URL: http://www.siap.gob.mx. [ Links ]
Singer, J. W.; Malone, R. W.; Meek, D. W. and Drake, D. 2004. Predicting yield loss in indeterminate soybean from pod density using simulated damage studies. Agron. J. 96:584-589. [ Links ]
Singh, P. S. 1995. Selection for water stress tolerance in interracial populations of common bean. Crop Sci. 35:118-124. [ Links ]
Statistical Analysis System (SAS). 2001. SAS/STAT Users' Guide. SAS Institute, Inc. Release 8.02. SAS Inc. Cary, NC. [ Links ]
Tanaka, A. and Yamaguchi, J. 1977. Producción de materia seca, componentes del rendimiento y rendimiento del grano en maíz. Talleres gráficos del Colegio de Postgraduados. Chapingo, México. 124 p. [ Links ]
Tsubo, M.; Walker, S. and Ogindo, H. O. 2005. A simulation model of cereal-legume intercropping systems for semi-arid regions. I Model development. Field Crops Res. 93:10-22. [ Links ]
Van Den Berg, M. and Smith, M. T. 2005. Crop growth models for decision support in the South African ssugarcane industry. Proc S. Afr. Sug. Technol. Ass. 79:495-509. [ Links ]
Villalobos, F. R. y Retana, J. A. 2003. Validación de CROPGRO-drybean, un modelo de simulación del crecimiento y desarrollo del cultivo de frijol en Los Chiles, Costa Rica. Top. Meteoro. Oceanog. 10:63-68. [ Links ]
Waring, R. H.; Schroeder, P. E. and Oren, R. 1982. Application of the pipe model theory to predict canopy leaf area. Can. J. For. Res. 12:556-560. [ Links ]
Westermann, D. T. and Crothers, S. E. 1977. Plant population effects on the seed yield components of bean. Crop Sci. 17:493-496. [ Links ]
White, J. W. 1988. Conceptos básicos de la fisiología del frijol. Guía de estudio. Centro Internacional de Agricultura Tropical (CIAT). Cali, Colombia. 55 p. [ Links ]
White, J. W.; Boote, K. J.; Hoogenboom, G. and Jones, P. G. 2007. Regression-based evaluation of ecophysiological models. Agron. J. 99:419-427. [ Links ]

