


 nueva página del texto (beta)
 Inglés (pdf)
 Artículo en XML
 Referencias del artículo
 Enviar artículo por email
 Citado por SciELO
  Similares en
SciELO
Similares en
SciELO 
 Permalink
Introduction
Zinc oxide (ZnO) can be synthesized in micro-nanostructured particles with different shapes and sizes, having a wide 3.37 eV gap and a high exciton binding energy. This oxide generally exhibits emissions in the near ultraviolet (around 380 nm) and in visible region (blue and green-yellow); emission at 380 nm is called near band edge (NBE) emission and is due to exciton recombination effect (Ahsanulhaq et al., 2007; Umar et al., 2006). It is a transparent semiconductor, attractive for potential novel applications in electronics, sensors, transducers, biomedical applications, and integrated circuit technology.
Several processes to obtain zinc oxide with different dopants ions can be found: a wet chemical route with calcination procedure was used to synthesize Y-doped and Tb-doped ZnO nanocrystals (Pal et al., 2006; Parta et al., 2013), also undoped and Al-doped ZnO thin films were prepared by the sol-gel process (Tiekun et al., 2009), and ZnO:Tb3+nanotube arrays were obtained using Anodic Alumina Membranes (AAMs) via electro-deposition method (Shihua et al., 2010). Rare earth-doped ZnO materials have been attracting interest for possible applications in high power lasers, visible emitting phosphors in displays, and other optoelectronic devices.
The TL properties of undoped zinc oxide (Cruz-Vazquez et al., 2005; Pal et al., 2006) and doped with Ce, Yb, Tb, Eu, Dy, and La ions, have been analyzed by different authors (Kucuk et al., 2016; Goswami et al., 2015; Sunta et al., 2002) Ce or Yb dopant ions introduced in zinc oxide, have a quenching effect on the TL emission but improve some TL responses such as fading and dose-response at low doses from 143 mGy up to 60 Gy from beta radiation. Is important to mention that zinc oxide is very sensible to rare-earth dopant ions and their glow curves intensity depends on different doping concentration, however, there are few reports on Tb-doped zinc oxide films using high doses of gamma radiation. The Yb dopant in ZnO improves stability of trapped charges at shallow/low temperature (Pal et al., 2006).
Also, zinc oxide semiconductor nanocrystals are important in the emerging field of blue/UV optoelectronics and nanotechnology. When Tb-doped ZnO is obtained through implantation ions, the characteristic green emission bands associated with Tb generated by 5D4 →7Fj=5,4 transitions have strongly increased in their intensities after thermal annealing (Cetin et al., 2009). The doping of Tb3+ has been used to produce green phosphor emitting light at 543 nm and with a long decay time (Badalawa et al., 2006). Rare-earth doped zinc oxide phosphors are very attractive materials due to their optical emissions from the 4f-4f or 4f-5d transitions. However, their optical and luminescent properties strongly depend on the preparation route (Klingshirn et al., 2007; Daksh et al., 2016).
Photoluminescence (PL) property of Ce-doped ZnO nanophosphor showed green and red emissions due to the charge transfer at oxygen vacancies and to the Ce ion transitions, respectively (Sudheesh et al., 2014). Pal and Manam (Parta et al., 2013) prepared Tb-doped ZnO by co-precipitation method at room temperature, and its morphological structure is composed of nanoflakes and nanorods. The glow curves peaked at 255 °C for the Tb-doped sample and at 190 °C for undoped ZnO. The terbium dopant improved the TL intensity of Tb-doped ZnO, and it was higher than that of the undoped zinc oxide sample. However, linear dose-response analysis and the X-ray doses were not specified. Recently, Isik (Isik, et al., 2019) obtained undoped ZnO in nanoparticle form via sol-gel synthesis.
The TL glow curves exhibited broad and asymmetrical glow curves with a maximum temperature of about 83 K, including three overlapped peaks at 55, 85, and 118 K. In that case, the undoped ZnO nanoparticles may be useful for low-temperature dosimetry but not for room temperature dosimetry. These characteristics suggest that TL properties of ZnO phosphor can be improved by using Tb as dopant in ZnO host lattice. In this work, undoped ZnO and Tb-doped ZnO films (micro and nanostructured) were synthesized, characterized, and irradiated between 0.25-20 kGy doses to study the feasibility of this material as a gamma TL detector for high radiation field.
Materials and methods
To synthesize the ZnO films, a solution precursor was prepared using zinc nitrate (Zn(NO3)2.6H2O) as Zn and O sources and hexamethylenetetramine [(CH3)6N4] as surfactant and catalyst under the hydrothermal reaction mechanism, in which the [Zn(OH)4]-2 radical plays an important role in the ZnO rods assisted-hydrothermal synthesis (Baruah et al., 2009). The powder synthesized by assisted-hydrothermal process (above mentioned) was dissolved in deionized water (1 gram in 500 ml). This mixture constituted the precursor source for synthesis of samples (ZnO and ZnO:Tb) using ultrasonic spray pyrolysis method. The experimental arrangement of this technique has been presented previously (Cetin et al., 2009). In this case, an aerosol is formed from the precursor solution, which is directed thought a carrier gas, towards a previously heated substrate. Solvents in solution vaporize when solution mist comes in contact with hot substrate causing a solid coating on the substrate. In this case, optimal doping with Tb was achieved by adding TbCl3·6H2O (1 at. %) in relation to the Zn content in this solution. The carrier gas flow (filtered air) was 12 l/min and solution flow rate was 4 ml/min. The substrate temperature during deposition was fixed at 400 oC; substrates used were aluminum foil discs.
Before irradiation, the samples were annealed at 770 K for 1 hour. After cooling down to room temperature (RT) zinc oxide samples were inserted in a black box to avoid any environmental light effect. The samples were exposed to gamma photons from 60Co of Gammabeam 651PT Nordion irradiator, with 170 Gy/min dose rate. The TL measurements were carried out using a Harshaw TLD reader model 3500. Nitrogen gas was allowed to flow into the reading chamber during the readout to eliminate any spurious TL signals. Constant heating rates of 2, 5, 10, 15, 20, and 40 K/s were used. Both types of equipment, the panoramic irradiator, and the TLD reader are placed at the Nuclear Science Institute-UNAM.
The morphology of the samples was analyzed using a JEOL JSM 840 A scanning electron microscopy (SEM), supplied by the Research Materials Institute-(IIM)-UNAM. The TL signal was integrated from room temperature (300 K) up to 700 K. Photoluminescence spectra were recorded on a NanoLog fluorometer from Horiba-Jobin-Yvon exciting from 220 to 1000 nm with a Xenon arc lamp supplied by the Solid State Laboratory of the Physics and Mathematics Superior School (ESFM-IPN). For Raman scattering spectroscopy a Perkin-Elmer Raman Station 400F, located at the Nanosciences-micro and Nanotechnologies Center-IPN was used (excitation source 350 Mw, near infrared 785 nm laser, 95-3500 cm-1 Raman shift , 4 cm-1 FWHM). The X-ray analysis was made using a Bruker AXS D8-Advance diffractometer (30 kV, 0.5 deg. min-1, 5°<2θ<80°) with Cu-Kα radiation of 0.15418 nm wavelength supplied by the IIM-UNAM.
Results and discussion
Sample characterization
Scanning Electron Microscopy (SEM) of undoped ZnO shows micro-nanostructures (Fig 1.a) with hexagonal crystalline shape and the preference of this material to grow in a well-formed rod structure. The surface morphology is formed by overlapping ZnO micro-nanorods. The diameter and length average values were about 0.1-0.4 and 1 µm, respectively. A random inspection over the substrate area showed that it was uniformly covered by this kind of microstructure. It is possible to observe uniformity in diameters and lengths of the hexagonal crystals.
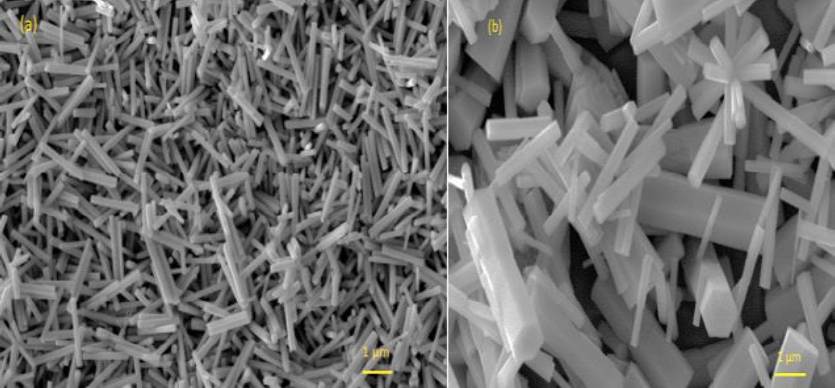
Fig. 1 Scanning Electron Microscopy micrographs of the surface morphology for; a) undoped ZnO, and b) Terbium-doped ZnO. The diameter (d) and length (l) average values are indicated.
These characteristics possibly result from typical growing processes of these films properly influenced by local chemical and/or thermodynamic environment. The nature of substrate also influences on film growth; this coating formation is a consequence of reactive nature of aluminum substrate, which is not the case for other substrates. Incorporation of Tb ions into ZnO host lattice produces some changes in the surface morphology of Tb-doped ZnO films (Fig. 1b). In this case, it is possible to observe hexagonal rods with larger diameters mainly and lengths. An additional kind of microstructures was observed: some particles consisting of rods emerging radially from a single point. Similar results have been obtained in other studies on ZnO: Tb3+ (Sreeja et al., 2017).
Raman analysis of unirradiated ZnO samples exhibited bands peaked at 439, 519, and 716 cm-1 (Fig 2.a). These bands are ascribed to the zinc oxide, and the one located at 439 cm-1 is related to würtzite hexagonal phase characteristic of ZnO. Also this band was observed by Nehru (Nehru et al., 2012) and Yousefi (Yousefi et al., 2020) located at 439 cm-1 and 437 cm-1, respectively. In the case of the Tb-doped ZnO (Fig 2.b), the spectrum was complex and the values were slightly shifted (438, 518, 716 cm-1) which may be perturbed by presence of Tb ions inside zinc oxide films. The peak at 716 cm-1 is generated by combinations of phononic and optical modes that describe longitudinal acoustic and transverse processes of the optical lattice. In irradiated samples, Figs. 2c and 2d, Raman spectra were obtained such as a broad band centered about 1900 cm-1 for ZnO, and it was shifted to 2000 cm-1 for Tb-doped ZnO and less intensity was observed due to Tb ion impurity into host lattice. Photoluminescence (PL) spectra of ZnO and ZnO:Tb samples were made using an excitation line (λexc) of 350 nm. The PL spectra for the ZnO and ZnO:Tb samples were very different. In the undoped sample (Fig. 3a) typical peaks of band-to-band transitions or near band edge (NBE) emissions (385 nm) were observed in the unirradiated sample.
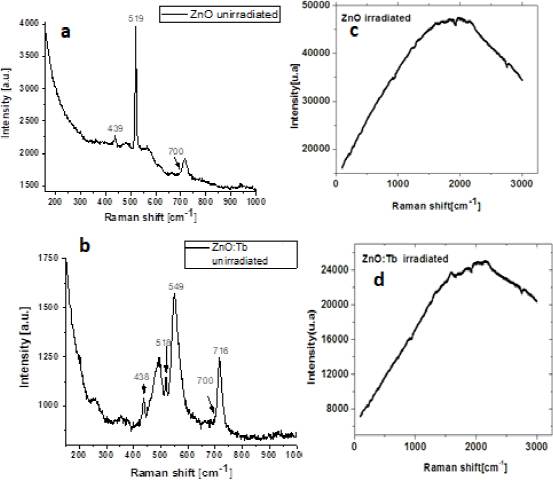
Fig. 2 a) and b) Raman spectra of the unirradiated samples, c) and d) corresponding to ZnO and ZnO:Tb gamma-irradiated samples, respectively.
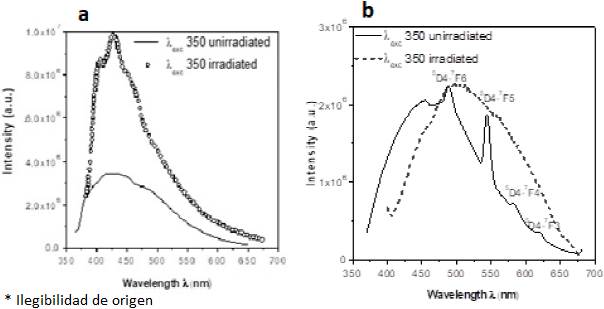
Fig. 3 Photoluminescence spectra of the samples, a) ZnO, and b) ZnO:Tb3+. Unirradiated and gamma-irradiated samples.
Visible emissions in ZnO originated from oxygen vacancies to the valence band were exhibited such as bands centered approximately: 405, 426, and 450 nm. These bands were raised in their intensity when ZnO films were irradiated. The shoulder at 450 nm may be a phonon replica of the main peak located at 426 nm. (Fig. 3b) (for unirradiated sample) exhibits a spectrum with visible ZnO emissions and typical emissions of Tb3+ ions superimposed. The unirradiated ZnO:Tb exhibited emissions at 490, 544, 582, and 620 nm due to the 5D4-7Fj=6,5,4,3 transitions of the Tb3+ ion in the ZnO phosphor. These values are in agreement with those emissions observed by radioluminescence (RL) on terbium-doped zinc oxide crystals by implanted Tb ions forming nanoparticles (Cetin et al., 2009). In the case of the irradiated samples (terbium-doped zinc oxide), inhibition of Tb emissions was detected, and appears a broad band (from 400 to 650 nm) centered at 502 nm. In several reports, this band is related to intrinsic defects, such as zinc and oxygen vacancies and interstitial oxygen (Isik et al., 2016; Cetin et al., 2009; Parta et al., 2013).
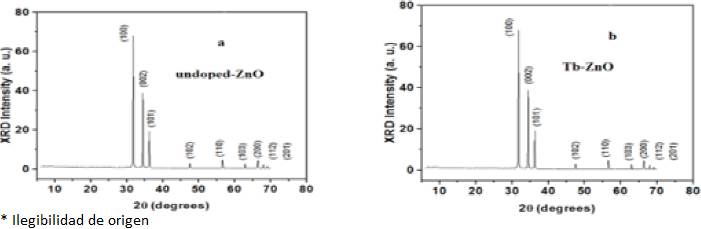
X-ray diffraction (XRD) measurements were carried out to investigate the crystalline structure of the ZnO and Tb-doped ZnO samples (Figs. 4a and 4b), both patterns were identical. The diffractogram for ZnO:Tb (1 at.%) (Fig. 4b) corresponds to the ZnO hexagonal wurtzite phase (JCPDS 36-1451) (Moura et al., 2010). It is possible to observe well-defined diffraction peaks and the highest intensity is obtained for 2θ < 35°, for (100) line, which could be associated with the preferred orientation along the c axis, as reported by Kumar (Kumar et al., 2013). Peaks for Tb compounds were not observed. This is indicative that the presence of the Tb ions in the ZnO host lattice does not disturb the crystalline structure. In this case, the doping concentration was about 1 at. %, probably the XRD technique may not be sensitive to these terbium quantities in this phosphor.
Atomic effective number (Zeff)
The Zeff was obtained due to the important characteristic of zinc oxide phosphor to expected for thermoluminescent (TL) response at different energies, in this case, exposed to gamma radiation. Considering that the material response depends on the atomic number Z of the constituents,
Where: a1, a2 … an are the fractional contents of electrons belonging to elements Z1, Z2…Zn respectively, ni is the number of electrons belonging to each element Zi and NA is the Avogadro number. The value of x is 2.94 (Furetta, 2010). For undoped ZnO and Tb-doped ZnO preparations were obtained Zeff = 27.74 and Zeff = 56.47 values, respectively. Since the effective atomic numbers of the samples are about 4 and 8 times greater than that of human tissue (Zeff = 7.4) respectively, an accurate calibration should be done for its use in personal and high field radiation applications.
Thermoluminescence (TL) and computerized glow curve deconvolution (CGCD)
The glow curves Fig. 5a and 5b, exhibit a wide structure; in such case, a
computerized glow curve deconvolution (CGCD) is useful to obtain kinetic
parameters such as activation energy (E) and frequency factor
(s); Rm and

Fig. 5 a) and b) Glow curves as a function of doses: 0.25-20 kGy obtained with 2 K/s heating rate, c) and d) Deconvolution of the glow curves, assuming the mixed order kinetics model, the experimental glow curves (open circles) at the dose of 12 kGy and 170 Gy/min gamma dose rate, for undoped ZnO and Tb-doped ZnO, respectively.
Where: k is Boltzmann constant,
Im and
Tm are the maximum
luminescence intensity and temperature in peak deconvoluted, respectively, and
other quantities are:
The equation (9.b) is a definition
of
And finally, frequency factor s is defined by:
The curve fitting procedure was performed using the Figure of Merit (FOM). A FOM equal to or less than 5 % means an acceptable fit (Balian et al., 1977). In Fig. 5c glow curve of sample A shows one wide resolved peak, at 450 K, as shown in Fig. 5d, glow curve of sample B is quite similar to previous one: first peak appears at 475 K. The TL glow curves for both preparations were similar.
In almost all glow curve deconvolutions of samples (A and B), Rm values were greater than or equal to unity, therefore trapping process is predominant, as shown in Table 1. Finally, the assumption of mixed order kinetics (MOK) comparing with other models, as general order kinetics (GOK), is more useful because MOK has a physical basis (Sadek et al., 2014). The greatest Rm values were for sample B (Tb-doped ZnO), hence Tb ions promote capture of charge carrier.
Table 1 Kinetic parameters as obtained by CGCD for A (ZnO), and B (ZnO:Tb) samples.
| Peak number |
Tm [K] |
Rm | α |
E [eV] |
s [s-1] |
Peak area [counts] |
Peak number |
Tm [K] |
Rm | α |
E [eV] |
s [s-1] |
Peak area [counts] |
|---|---|---|---|---|---|---|---|---|---|---|---|---|---|
| β= 2K/s Sample A:ZnO, FOM=0.02 | Sample B: ZnO: Tb, FOM= 0.03 | ||||||||||||
| 1 | 385 | 1.68 | 0.45 | 0.65 | 5.39E+07 | 2.43E+06 | 1 | 385 | 2.51 | 0.63 | 0.76 | 3.18E+09 | 1.67E+06 |
| 2 | 441 | 1.97 | 0.53 | 0.67 | 5.39E+07 | 3.16E+06 | 2 | 441 | 6.55 | 0.85 | 0.77 | 6.75E+08 | 1.83E+06 |
| 3 | 500 | 2.38 | 0.61 | 0.64 | 6.61E+05 | 3 | 500 | 2.93 | 0.68 | 0.5 | 1.95E+04 | ||
| 4 | 655 | 1.08 | 0.1 | 0.51 | 52.7728 | 4 | 640 | 1.08 | 0.1 | 0.59 | 3.80E+02 | ||
When the zinc oxide samples were prepared by the co-precipitation method (Parta et al., 2013) they were composed by nanorods which showed broad glow curves peaked at 530 K (255 °C) for Tb-doped ZnO and 465 K (190 °C) for undoped sample. The activation energy (E) and frequency factors (s) obtained by Chen´s method were 0.98 eV and 2.77x10⁸ s-1, respectively, for ZnO:Tb. Both peaks, 530 K and 465 K, follow the first-order kinetics and other satellite peaks at lower side temperature of glow curves obey second-order kinetics. Pal and co-workers (Pal et al., 2006) reported the TL of undoped ZnO spherical particles as nanophosphor obtained using glycol mediated chemical synthesis. Two glow peaks at 420 K (second-order) and 490 K (first-order) deconvolved by a computer fitting program, with activation energy about 0.8 eV and 1.2 eV, and frequency factor at 7x10⁸ and 1x10¹² s-1, respectively, were obtained. It seems that TL glow curves are influenced by preparation methods and also by heating rate. However in this last case, if it is considered separately, each of four TL peaks (Table 1) in which the whole glow curves of samples A and B are deconvolved shows a slight shift to higher temperatures as dose increases. But the overlap of peaks 1, 2, and 3 give rise to experimentally recorded high-temperature peak, the maximum of which does not shift as dose was increased. The results indicate a variation of activation energy E as a function of heating rate; this has been attributed to temperature lag and decrease of TL intensity as well as to activation energy and can be referred to as a thermal quenching effect(Gökce et al., 2009). However, if variation of E is due to temperature lag one should expect same variation for all peaks. Therefore, an analysis of temperature lag in TL glow-curve measurement is necessary and its implementation is described in next section.
Temperature lag in TL glow curve measurement analysis
Due to variation in kinetic parameters and effects on structure of glow curves, a compute of theoretical model proposed by Kitis (Kitis et al., 1998) will be carried out to correct for temperature lag in TL glow curve. The relationship among α-values and kinetics order (b) showed that overall scattering of values obtained for b corresponding to any value found of α was within approximately ±10% (Sunta et al., 2002). The α-values for peaks 1, 2, and 3 of samples A, B were found to be 0.4-0.6 evidencing that b ranged between 1.2 and 1.4 values. Then use of model given by equation (10) to correct lag in TL glow-curve is adequate(Kitis et al., 1998), and Tj temperature is necessary to evaluate:
Where
As activation energies of undoped ZnO deconvoluted glow peaks are too close; 0.65 eV, 0.67 eV, and 0.64 eV (Table 1), only that of first peak deconvolved was computed to validate equation (10).
The results of the analysis for this approximation are shown in Table 2. The theoretically evaluated glow peak maximum temperatures are listed in column 2 for E = 0.65 eV. Analogously, equation (10) was applied only to the first and third deconvoluted glow peaks of the Tb-doped ZnO sample (Table 3).
Table 2 Results testing validity of equation (10) for peak 1 deconvolved (ZnO).
| E=0.65 eV, | s=5.39(10 7 s -1 | ||||||
|---|---|---|---|---|---|---|---|
| β[K/s] | Tm[K] | TiTj[K2] [x105] |
c1 | Tmn[K] |
|
Tg[K] | βeff[K/s] |
| 2 | 377.08 | 1.4219 | 1.0000 | 377.77 | 0.6931 | 385 | 1.87 |
| 5 | 393.39 | 1.4834 | 1.0433 | 394.12 | 0.7231 | 416 | 4.23 |
| 10 | 406.66 | 1.5334 | 1.0784 | 407.40 | 0.7475 | 404 | 10.26 |
| 15 | 415.6 | 1.5642 | 1.1001 | 415.6 | 0.7625 | 404 | 16.33 |
| 20 | 420.81 | 1.5868 | 1.1160 | 421.58 | 0.7735 | 454 | 16.42 |
| 40 | 435.92 | 1.6438 | 1.1561 | 436.72 | 0.8013 | 454 | 36.18 |
Table 3 Results testing validity of equation (10) for peaks 1 and 3 deconvolved (ZnO:Tb).
| E=0.5 eV | s=1.95E+04[s-1] | ||||||
|---|---|---|---|---|---|---|---|
| β[K/s] | Tm[K] | TiTj[K2]x105 | c1 | Tmn[K] |
|
Tg[K] | (eff[K/s] |
| 2 | 455.63 | 2.076 | 1 | 456.32 | 0.693 | 500 | 1.62 |
| 5 | 485.64 | 2.2127 | 1.066 | 486.38 | 0.739 | 500 | 4.70 |
| 10 | 510.9 | 2.3278 | 1.121 | 511.67 | 0.777 | 495 | 10.75 |
| 15 | 526.82 | 2.4003 | 1.156 | 527.62 | 0.802 | 500 | 16.83 |
| 20 | 538.69 | 2.4544 | 1.182 | 539.51 | 0.82 | 524 | 21.24 |
| 40 | 569.39 | 2.5943 | 1.25 | 570.26 | 0.866 | 530 | 46.27 |
| E=0.77 eV | s=6.75E+08[s-1] | ||||||
| β[K/s] | Tm[K] | TiTj[K2]x105 | c1 | Tmn[K] |
|
Tg[K] | βeff[K/s] |
| 2 | 397.77 | 1.5822 | 1 | 398.46 | 0.693 | 441 | 1.49 |
| 5 | 413.2 | 1.6436 | 1.039 | 413.92 | 0.72 | 470 | 3.58 |
| 10 | 425.65 | 1.6931 | 1.07 | 426.39 | 0.742 | 455 | 8.43 |
| 15 | 433.25 | 1.7234 | 1.089 | 434.01 | 0.755 | 475 | 11.96 |
| 20 | 438.83 | 1.7456 | 1.103 | 439.6 | 0.765 | 495 | 15.01 |
| 40 | 452.82 | 1.8012 | 1.138 | 453.61 | 0.789 | 470 | 36.67 |
Tables 2 and 3 show that approximation of equation (10) gives acceptable results for a quite large range of used heating rates (1-40 K/s) thus validating it for their use. Glow peak shifts for lower heating rates (2-5 K/s) are about 15 K, which is easily measured. Furthermore, the constant c1 is very sensitive to Tm, which should be calculated within an accuracy better than 1 K. This is not difficult for low heating rates. The measurements at low rates of heating are the reference, so they need special attention to avoid temperature lags as a high-temperature gradient in sample (Kitis et al., 1998; Bos et al., 1992).
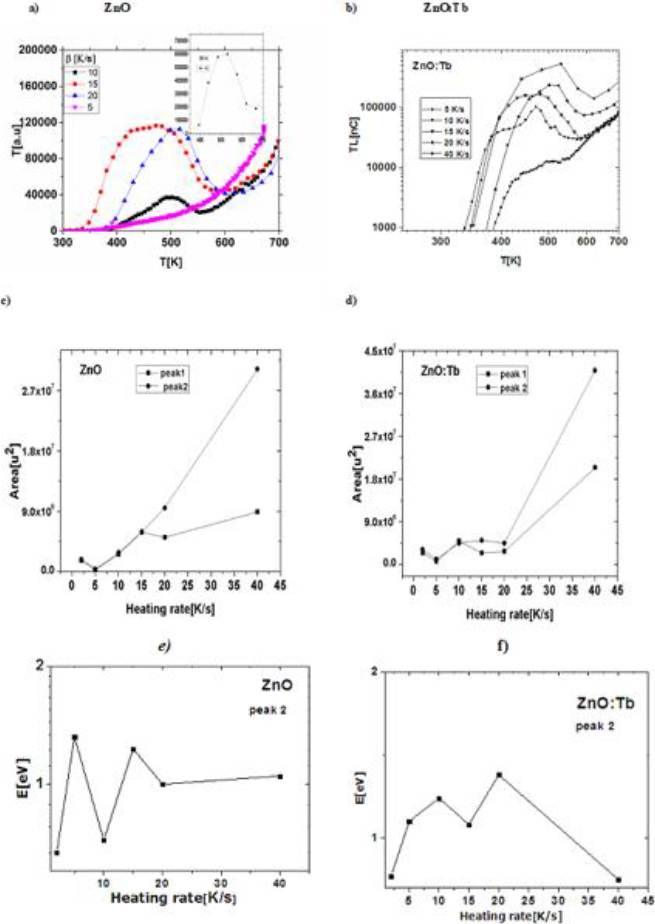
As heating rate grows, it produces two pronounced effects on glow curves of zinc oxide: a TL emission increase and a considerable broadening of peak located at 420 K occur as shown in Figs. 6a and 6b. Temperature lag at higher readout heating rates also influences determination of E values by glow curve fitting. As shown in Figs. 6c and 6d, integrated TL intensities maximum and minimum occurred for 5 and 40 K s−1 for both samples, respectively. However, a more detailed explanation for variation of integrated TL intensity and peak intensity with heating rate may be achieved by considering influence of more than one effect involved in TL of zinc oxide. Considering peak 2 (Figs. 6e and 6f) for ZnO and ZnO:Tb, respectively, a variation of activation energy for different heating rate and a strong decay of E value at 40 K/s for ZnO:Tb were observed. It seems that Tb impurity in zinc oxide modifies TL mechanism and then behavior of activation energy. The Tb3+-vacancy and clusters can be participating during heating rate, and also defect interaction with different time reactions for low and a high heating rate may occur increasing integrated area of glow curves (Piters et al., 1993; Subedi et al., 2010; Cuz-Zaragoza et al., 2011). It should be taken into account that temperature lags involved also a complex TL mechanism because recombination of several types of defects occurred during heating stimulation; the Tm, total area of glow curves, and activation energy (E) values can be affected by dopant cluster and thermal quenching. Almost two stages were observed for Tb-doped ZnO (Fig. 6f); E increased from 2-10 K/s, and a variation from 15 K/s and decay at 40 K/s. This last decay may occur due to large reaction time at that high heating rate. If the variation of activation energy (E) is due to the temperature lag same evolution should be expected for all peaks of zinc oxide.
Annealing effect on the TL signals and signal reproducibility
The effect of thermal treatment as annealing is to stabilize trap levels so that in subsequent uses both intrinsic background and TL response should be reproducible. The zinc oxide samples were annealed in a tube furnace at 350 K for 60 min and then cooled down up to room temperature, after that all the samples were irradiated with 12 kGy of gamma photons from a 60Co source irradiator.
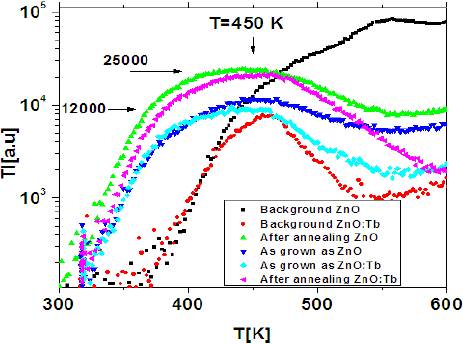
The annealing effect on zinc oxide samples shows a complex structure of their glow curves (Fig. 7) which peaked around 450 K. The TL intensity of ZnO: Tb was observed to be less than that of undoped ZnO. The TL signals of both samples grown by a factor of 2 after annealing. It implicates that a major quantity of defects as vacancies was generated in samples with previous annealing treatment. The TL signal of ZnO samples increases as annealing temperature enhanced, and does not alter the value of peak temperature and is the optimized temperature for heating samples (Raunak et al., 2015).
The reproducibility of TL signals as a function of readout cycles should be characterized for a phosphor with a dosimetric purpose. Furetta (Furetta, 2010) gives a procedure to check reproducibility of TL signal as a function of successive irradiation-readout cycles. The coefficient of variation (CV) for TL dosimeter is given by:
Where: σ and
TL dose-response and linearity analysis
At 0.25 kGy gamma dose threshold was enough to generate main TL mechanism to detect TL signal, i.e., samples were sensible at that dose. The TL dose-response exhibited three stages (Fig. 8a): at relatively low doses (stage 1, 0.25-4 kGy) there was unclear linearity, at intermediate doses (stage 2, 6-12 kGy) both samples ZnO and ZnO:Tb showed an almost linear response, and at higher doses (stage 3,14-20 kGy) TL response showed a slowly steep increase.
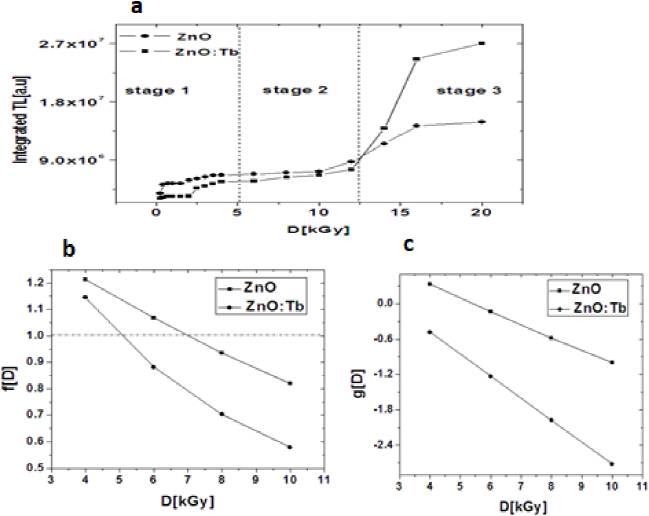
Fig. 8 a) Integrated TL dose-response of ZnO and Tb-doped ZnO, b) Supralinearity index, c) Superlinearity index.
The linearity at stage 2 range will be analyzed with more detail by supralinearity index f(D) and superlinearity index g(D), given by:
Where:
Fading of the TL signals
TL fading signal as a function of elapsed time can be useful in routine TL measurement and allows to characterize the TL signals decay of phosphor exposed to a radiation field. Zinc oxide samples were gamma-irradiated and they were stored in a dark environment. The TL signal was readout periodically for ZnO and ZnO:Tb samples, respectively, during 42 days (Fig. 9). Considering initial irradiation of samples followed by fading at room temperature and assuming first-order kinetics, for a storage time ts>>ti (irradiation time), following expression simulated this case is (Kitis et al., 2005; Gomez-Ros et al., 1996): Φ = Φ0exp(-pt) and then p = (-1/t)ln(Φ/Φ0), where Φ can be considered integrated glow curve or peak area. So by taking into account at final 42 days of fading; p = 0.149 d-1 or 14.9 % lost per day of TL signal for ZnO, and 15.9 % for ZnO:Tb. The constant p is less fast decay for undoped zinc oxide than that for Tb-doped ZnO.
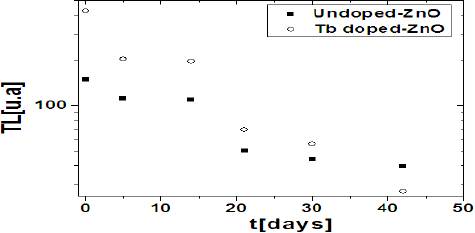
In this case, Tb ions in ZnO contribute to stabilizing intrinsic defects in zinc oxide and well defined glow curves as can be seen in Fig. 7 too. It seems that fading observed in ZnO also depends on their preparation method and their thermal history.
Conclusion
Micro-nanostructured undoped ZnO and Tb-doped ZnO films obtained by Spray Pyrolysis method have been characterized using SEM, Raman, XRD, PL, and analyzed their TL characteristics. PL emission of unirradiated ZnO:Tb exhibited defined bands at 490, 544, 582, and 620 nm due to 5D4-7Fj=6,5,4,3 transitions belonging to Tb3+ ions. The presence of terbium ions in ZnO contributes to obtaining larger hexagonal rods (especially larger diameter ones) and increased TL response after annealing process. Results suggest that zinc oxide films are sensible to high dose (0.25 kGy) in a gamma field radiation. Four peaks were deconvolved by CGCD method assuming Mixed Order Kinetics model that well fitted glow curves. Variation of activation energy E as a function of heating rate has been attributed to temperature lag. The presence of Tb ions, in host material, improves TL response but also increases the coefficient of variation of TL signal. TL fading behavior was similar for ZnO and ZnO:Tb.

