


 nueva página del texto (beta)
 Inglés (pdf)
 Artículo en XML
 Referencias del artículo
 Enviar artículo por email
 Citado por SciELO
  Similares en
SciELO
Similares en
SciELO 
 Permalink
Introduction
Propolis is a resinous material that is collected by honeybees (Apis mellifera) from the exudates of several trees and plants and is mixed with pollen and wax by the action of bee enzymes (Farré, Frasquet, & Sánchez, 2004). The origin of the term “propolis” (from the Greek prefix pro meaning "in defense” or “for" and polis meaning "city") reflects its importance for bees, who use this substance to block holes and cracks, embalm invaders, and protect the colony from diseases (Bankova, de Castro, & Marcucci, 2000; Farré, Frasquet, & Sánchez, 2004). The composition of raw propolis is complex. The main constituents are resins (50 - 55%); waxes (7 - 35%); essential oils (5 - 10%); pollen (5%); and other organic substances and minerals (5%), whose contents may vary depending on the harvest method, sampling area, season, and botanical origin (Chaillou, Herrera, & Maidana, 2004; Farré, Frasquet, & Sánchez, 2004; Dias, Pereira, & Estevinho, 2012).
Pollen analysis of honeybee products (melissopalynological analysis) can be used to determine their botanical source (i.e., to establish quantitatively or qualitatively their uni- or multifloral origin), which is important for assessing their quality (Barth, 1998; Martins-Ribeiro, da Luz, & de Albuquerque, 2018). Montenegro et al. (2001) reported that, in Chilean propolis, the major plant pollen sources are Eucalyptus globulus and Populus alba as well as some additional native species (Baccharis linearis, Peumus boldus, Escallonia illinita, and Quillaja saponaria). In another investigation, Moreira et al. (2008) reported the dominant pollen grains (> 45% Populus tremula and Castanea sative, followed by Pinus sp.) in propolis samples from Portugal. Meanwhile, Schinus pollen grains were found to be characteristic of red Brazilian propolis (Barth & da Luz, 2009), whereas in Sudan, Mimosa pigra, Mimosa sp., and Acacia sp. were the dominant pollen sources of the evaluated propolis (Mohamed & Afaf, 2004). In Greece, Pinaceae sp. pollen grains (> 45%) and other minor pollen grains such as Asteraceae, Ericaceae, Cistaceae, and Oleaceae sp. (< 3%) were present in propolis (Pratsinis et al., 2010).
Moreover, it has been shown that pollen source greatly impacts the sensory characteristics, physicochemical properties (Dias, Pereira, & Estevinho, 2012) and phenolic composition of propolis (Moreira et al., 2008; Kalogeropoulos et al., 2009; Guzelmeric et al., 2018). The phenolic compounds, including phenolic acids and flavonoids, are highly associate with possibly beneficial effects on human health such as anti-inflammatory, immunological, antimicrobial, antitumor and antioxidant properties (Frasquet, & Sánchez, 2004; Viuda-Martos et al., 2008; Pratsinis et al., 2010; Galeotti et al., 2018). However, it has been demonstrated that pollen source also impacts the antiproliferative, antimicrobial and antioxidant activities (Guzelmeric et al., 2018; Pratsinis et al., 2010; Ristivojević et al., 2018). Phenolic compounds may originate from plant resins (Park, Alencar & Aguiar, 2002; Kumazawa et al., 2008) and, therefore, may depend on the type and frequency of pollen collected by honeybees (LeBlanck et al., 2009; Dias, Pereira, & Estevinho, 2012; Wang et al., 2018). The aim of the present study was to determine the effect of pollen source (mesquite and catclaw) on the sensory and physicochemical characteristics of propolis, as well as on the phenolic composition and biological properties of PEs.
Method
Chemical and reagents
All utilized chemicals were of analytical grade. Folin-Ciocalteu's reagent, sodium carbonate (Na2CO3), potassium hydroxide (KOH), potassium persulfate (K2S2O8), gallic acid, 2,2-diphenyl-1-picrylhydrazyl (DPPH), trolox (6-hydroxy-2,5,7,8-tetramethylchroman carboxylic acid), 2,4,6-tri(2-pyridyl)-s-triazine (TPTZ), 2,4-dinitrophenylhydrazine (DNP), formic acid (HPLC purity), methanol (HPLC purity), ethanol, n-hexane, iron(III) chloride 6-hydrate (FeCl3●6H2O), iron(II) sulfate 7-hydrate (FeSO4●7H2O), acetic acid (CH3COOH), gentamicin sulfate salt, and BD Brain Heart Infusion Agar were purchased from Sigma-Aldrich (St. Louis, MO, USA). Aluminum chloride (AlCl3), hydrochloric acid (HCl), sulfuric acid (H2SO4), and methanol were obtained from Merck (Darmstadt, Germany). The authentic standards of the phenolic compounds acacetin, apigenin, caffeic acid phenethyl ester (CAPE), cinnamic acid, chrysin, p-coumaric acid, galangin, luteolin and quercetin were obtained from Sigma Chemical Co. (St. Louis, MO, USA). Naringenin, kaempferol, pinocembrin, pinobanksin, and 7-methoxypinocembrin were purchased from INDOFINE Chemical Company, Inc. (Hillsborough, NJ).
Propolis samples
Propolis samples were collected from northwestern Mexico and analyzed according to dominant pollen type, as shown in Table 1. Raw propolis (20 g) was then extracted in ethanol (200 mL, at room temperature 25 °C) by maceration method (300 rpm for 3 days), filtered (Whatman no. 4 filter paper), and concentrated under reduced pressure at 60 °C (rotary evaporator, BÜCHI R-200, Switzerland). The resulting propolis extract (PEs) was washed 3 times with n-hexane (20 mL) to remove waxes, lyophilized (Freeze Dryer, LABCONCO 77540, USA), and stored at −20 °C under darkness until analysis (Hernández et al., 2007).
Table 1 Pollen data from propolis samples collected in northwestern Mexico.
| No. | Sample code |
Collection area |
Year | Season | Dominant type |
Pollen frequencies a | ||
|---|---|---|---|---|---|---|---|---|
| PV | MD | % | ||||||
| 1 | M1 | PA | 2012 | Winter | Mesquite | 15.2 | 13.3 | 28.5 |
| 2 | M2 | PA | 2012 | Summer | Mesquite | 23.1 | 21.9 | 45.0 |
| 3 | M3 | PA | 2013 | Winter | Mesquite | 17.3 | 16.7 | 34.0 |
| 4 | M4 | PA | 2013 | Summer | Mesquite | 29.2 | 25.5 | 54.7 |
| 5 | C1 | RV | 2012 | Winter | Catclaw | 15.3 | 18.7 | 34.0 |
| 6 | C2 | RV | 2012 | Summer | Catclaw | 19.8 | 37.0 | 86.8 |
| 7 | C3 | RV | 2013 | Winter | Catclaw | 13.6 | 19.4 | 33.0 |
| 8 | C4 | RV | 2013 | Summer | Catclaw | 16.0 | 41.6 | 57.6 |
a Values taken from Vargas-Sánchez et al. (2016); PA: Pueblo de Álamos (29°8'51.36" N, 110°7'26" W; 636 masl); RV: Rancho Viejo (29°7'19.72"N, 110°16'58.35" W; 476 masl); PV: Prosopis velutina; MD: Mimosa distachya.
Sensory and physicochemical characteristic
The sensory characterization of propolis samples was performed as described in NSO (2003) and Lozina et al. (2010) with slight modifications. The moisture, ash, wax, and resin contents and mechanical impurities of the samples were also determined (AOAC., 2005; Lozina et al., 2010). To determine the moisture and ash contents, propolis samples (5 g) were dried in an oven (FELISA FE-293A, Mexico) at 100 °C during 8 h and incinerated in a muffle furnace (FELISA AR-340, Mexico) at 550 °C for 3 h, respectively. At following, the samples were cooled and weighed. The wax content was determined for dry propolis samples (5 g) following extraction with petroleum ether (40 - 60 °C for 3 h) in a Soxhlet extractor (Goldfish fat extractor, LABCONCO, USA). After the waxes were removed, the samples were placed in an oven at 100 °C for 3 h and cooled until reaching a constant weight. To determine the resin and mechanical impurity contents, samples (5 g) were homogenized with n-hexane and ethanol at 40 °C during 3 days. The soluble residues (resins) were then filtered (Whatman no. 4 filter paper), and the insoluble residues (impurities) were dried (100 °C for 3 h) until reaching a constant weight.
HPLC-DAD analysis
The identification and quantification of the phenolic compounds in the PEs was carried out using a high-performance liquid chromatography (HPLC) equipment (Varian ProStar, Walnut Creek, USA) equipped with a diode array detector (DAD). For the stationary phase, a C18 LiChrospher-5 column (125×4.0 mm, 5 mm) was used. The injection volume was set to 10 µL of PEs (5 mg/mL), and five injections were performed for each sample. The column was eluted using a water-formic acid/methanol gradient at a flow rate of 1 mL/min. The mobile phase consisted of 5% formic acid in water (A) and methanol (B). The gradient program was 30% B (0 - 15 min), 40% B (15 - 20 min), 45% B (20 - 30 min), 60% B (30 - 50 min), 80% B (50 - 65 min), and 100% B (65 - 75 min). Running temperature for the analysis was 30 °C and, the compounds were monitored at 280 and 340 nm. The assignation of peaks was performed comparing the retention times using authentic standards solutions and by spiking the samples with the respective compounds. The calibration curves were prepared using each standards solutions in the range of concentration from 15 to 500 µg/mL for quantification, and linear ranges were determined r ≥ 0.99 (Hernández et al., 2007).
Polyphenol composition
Total phenolic content (TPC). The TPC of each PEs was evaluated using the Folin-Ciocalteu method (Popova et al., 2004; Ainsworth & Gillespie, 2007) with slight modifications. Briefly, 10 µL of each PEs (5 mg/mL) was homogenized with 80 µL of distilled water, 40 µL of Folin-Ciocalteu's reagent (0.25 N), and 60 µL of Na2CO3 (7%). The reaction mixture was mixed with 80 µL of distilled water and incubated in the dark at 25 °C for 1 h. The absorbance was measured at 750 nm in a spectrophotometer (Multiskan FC UV-Vis, Thermo Scientific, Tokyo, Japan). The TPC was expressed as mg of pinocembrin-galangin equivalent (1:1 ratio)/g of dried PEs (reference mixture of propolis components).
Flavone and flavonol content (FFC). The FFC of each PEs was determined by the aluminum chloride-complex formation method (Popova et al., 2004). Briefly, 10 µL of each PEs (5 mg/mL) was homogenized with 130 µL of methanol and 10 µL of AlCl3 (5%) and incubated for 30 min (25 °C). The absorbance was measured at 412 nm, and the results were expressed as mg of quercetin equivalent/g.
Flavanone and dihydroflavonol content (FDC). The FDC of each PEs was determined using the method described by Popova et al. (2004). Briefly, 40 µL of PE (5 mg/mL) was homogenized with 80 µL of 2,4-dinitrophenylhydrazine (DNP) solution [50 mg DNP in 100 µL of 96% sulfuric acid diluted to 10 mL with methanol] and heated at 50 °C for 50 min. After cooling, the mixture was diluted with 280 µL of KOH in methanol (10%), and 30 µL of the resulting solution was mixed with 250 µL of methanol. The absorbance was measured at 490 nm, and the results were expressed as mg of pinocembrin equivalent/g.
Antioxidant activity
Ferric reducing antioxidant power (FRAP). The FRAP was determined according to Benzie and Strain (1999). Briefly, 5 µL of each PEs (5 mg/mL) was homogenized with 150 µL of FRAP solution [10:1:1, 300 mM buffer sodium acetate in glacial acetic acid (pH 3.6) and 10 mM 4,4,6-tripyridyl-S-triazine (TPZ) in 40 nM HCl and 20 mM FeCl3] and incubated for 8 min in the dark. The absorbance was measured at 595 nm, and the results were expressed as mg of Fe (II) equivalent/g.
Free-radical scavenging activity (FRS). The FRS activity was determined according to Molyneux (2004) with slight modifications. Briefly, 100 µL of each PEs (100 µg/mL) was homogenized with 100 µL of DPPH solution (300 µmol, [2,2-diphenyl-1-pichrylhydrazyl]) and incubated for 30 min in the dark. The absorbance was measured at 520 nm, and the FRS was calculated as follows: FRS (%) = [1−Abs sample/Abs blank] × 100, where Abs blank is the absorbance of the control at t = 0 min and Abs sample is the absorbance of the antioxidant at t = 30 min.
Antimicrobial activity
In vitro antibacterial studies were performed according to the broth microdilution method (Wiegand, Hilpert, & Hancock, 2008), with slight modifications. Staphylococcus aureus ATCC 29213B, Listeria innocua, Escherichia coli ATCC 25922, and Salmonella typhimurium ATCC 14028 were initially reactivated in liquid nutrient broth (BHI agar) at 37 °C for 24 - 48 h. After bacterial growth occurred, an aliquot of 50 µL (1.5 x 10⁸ CFU/mL, 0.5 McFarland standard) was mixed with 50 µL of each PEs (62.5 - 500 µg/mL) in BHI agar. Gentamicin (12 µg/mL) was used as a positive control for bacterial growth inhibition, and BHI was used as a negative control. The plates were read at 620 nm (OD, optical density) after 24 h of incubation, and the percentage of inhibition was calculated as follows: inhibition (%) = (OD620 untreated bacteria−OD620 nm test concentration) / (OD620 nm untreated bacteria) × 100.
Statistical analysis
All experiments were conducted in triplicate for at least three independent experiments, and the results are given as mean ± standard deviation. Data were submitted to analyses of variance (ANOVA) and the Tukey-Kramer multiple comparison test. A principal component analysis (PCA) was applied to study the effect of pollen source on the variables that contributed to propolis characterization (SPSS, version 19). The level of significance was set at P < 0.05.
Results and discussion
Sensory and physicochemical analysis
The sensory parameters of the analyzed propolis samples such as appearance (solid and waxy), color (brown to green), aroma (resinous), flavor (tasteless or slightly-bitter), and consistency (slightly-sticky or sticky) comply with the quality specifications established by international regulations for raw propolis, as shown in Table 2. However, it is recommended to avoid the collection of propolis in areas of the beehive with high presence of visible impurities (leaves, wood, waxes, and bees) (NSO, 2003; NOM, 2017). The sensory attributes are often and indicator of the botanical origin of propolis (Funari & Ferro, 2006; NOM, 2017), and according to our results, the color and consistency attributes are similar to those reported for Portuguese propolis (Dias, Pereira, & Estevinho, 2012).
Table 2 Sensory and physicochemical characteristics of propolis from different pollen sources.
| Sample | Sensory characteristic | |||||
|---|---|---|---|---|---|---|
| Appearance | Color | Aroma | Flavor | Consistency | Visible impurities |
|
| M1 | SW | BG | R | T | S | V. W |
| M2 | SW | B | R | T | ss | V,Bs. P |
| M3 | SW | BG | R | SB | s | V. W |
| M4 | SW | B | R | T | SS | V, W |
| C1 | SW | BG | R | T | s | V. W |
| C2 | SW | B | R | T | SS | V, W, Bs |
| C3 | SW | BG | R | SB | s | V. W |
| C4 | SW | B | R | T | SS | V. W |
| Physicochemical properties (%) | ||||||
| Collected amount (g) |
Moisture | Ash | Wax | Resin | Mechanical impurities |
|
| M1 | 77.9 | 1.4±0.3a | 9.7±0.7c | 26.2 ± l.8a | 43.9 ± 3.3b | 17.8±0.3a |
| M2 | 177.8 | 1.3 ±0.4a | 6.7 ± 1.0b | 28.0 ± 2.7ab | 43.7 ± l .lb | 15.7 ± 1.6" |
| M3 | 63.3 | 1.2±0.2a | 6.4 ± 1.3b | 27.3 ±2.4a | 47.0 ± 1.0c | 16.3 ± 1.41 |
| M4 | 117.1 | 1.1 ±0.3a | 8.5±0.3C | 26.0 ± 0.41 | 47.1 ± 1.2c | 15.0± 1.7a |
| C1 | 153.8 | 4.6 ± 0.3b | 7.4 ± 1.2bc | 27.6 ± 2.4 a | 33.8 ± 2.0a | 23.5±l.Sb |
| C2 | 54 | 1.6±0.6a | 2.7 ± 0.6a | 31.4±0.9b | 45.5±2.9bc | 17.3±2.7a |
| C3 | 189.6 | 4.2 ± 0.3b | 7.5 ± 2.0bc | 27.2 ± 1.7a | 34.7 ± 1.2« | 23.4±0.9b |
| C4 | 248.3 | 1.9 ± 0.1a | 2.5 ± 1.0 a | 29.0 ± 1.3ab | 44.3± 1.lb | 19.5±2.0a |
SW: Solid and waxy; B: Brown; BG: Brown-Green; R Resinous; T: Tasteless; SB: Slightly-bitter; S: Sticky, SS: Slightly-sticky; V: Vegetables; W: Wax; Bs: Bees; P: Painting. Mesquite (M1 to M4) and catclaw propolis (C1 to C4). All values represent means of triplicate determinations ± standard deviation. Means with different superscripts (a-c) among samples indicate significant differences (P<0.05).
Moreover, the results for the physicochemical parameters (Table 2) revealed some differences in propolis from different pollen sources (P < 0.05). The lowest moisture content was obtained for mesquite propolis (1.3 - 1.4%) compared to catclaw propolis (1.6 - 4.6%). According to international regulations concerning propolis quality, these values are within the allowed parameters (< 8%) (NSO, 2003). Propolis moisture content depends on environmental conditions (temperature and humidity) and manipulation by beekeepers during the harvest period (Seidel, Peyfoon, Watson, & Fearnley, 2008). It has been reported that a higher moisture content could lead to the presence of undesirable microorganisms (e.g., aerobic mesophilic bacteria, coliforms, E. coli, Salmonella sp., S. aureus, and yeasts), which can reduce the microbiological quality of bee products (Dias, Pereira, & Estevinho, 2012).
In addition, ash content is an important quality parameter that is commonly used to evaluate propolis commercialized in powder form. High ash content can indicate possible adulteration of the material due to added impurities, i.e., soil (Funari & Ferro, 2006). In the present study, the highest ash contents (P < 0.05) were found in samples M2, M4, C2, and C4, which were above the permissible limits (< 5%) and possibly associated with the presence of some visible impurities in the raw propolis (leaves, wood, and bees). On the other hand, the wax, resin, and mechanical impurity contents (< 30%, > 35%, and < 25%, respectively) were within the permissible limits (NSO, 2003; NOA, 2004). These values were not similar to those previously reported for Portuguese propolis (Dias, Pereira, & Estevinho, 2012), whose moisture (3.4 - 5.4%), ash (1.6 - 2.2%), wax (4.8 - 16%), and resin (60.7 - 71.1%) contents varied considerably, demonstrating the variability of propolis from different botanical origins (i.e., Castanea sativa, Erica sp., Pinus sp., Populus sp., Prunus sp., and Quercus sp.). Furthermore, high moisture, ash, wax, and mechanical impurity contents were found to reduce the yield and quality of propolis, whereas high resin content was found to increase the presence of phenolic compounds (NSO, 2003; Lozina et al., 2010).
Phenolic profile
According to the literature, more than 300 compounds have been found in PEs, including phenolic compounds (phenolic acids and flavonoids) of plant origin (Farré, Frasquet, & Sánchez 2004; Wang et al., 2018). The phenolic acid and flavonoid analysis performed by HPLC-DAD showed that mesquite and catclaw propolis displayed a similar chemical profile (Fig. 1). The compounds gallic acid, cinnamic acid, p-coumaric acid, naringenin, quercetin, luteolin, kaempferol, apigenin, pinocembrin, pinobanksin 3-acetate, CAPE, chrysin, galangin, acacetin, and pinostrobin were present in all samples regardless of the pollen source. In addition, as shown the Table 3 the major phenolic compounds (P < 0.05) identified in mesquite and catclaw samples were the flavonoids pinocembrin, naringenin, galangin, chrysin, and quercetin. However, the phenolic compounds chlorogenic acid, ferulic acid, hidroxicinnamic acid, rosmarinic acid, genistein, myricetin, hesperidin, hesperetin, and rutin were absent.
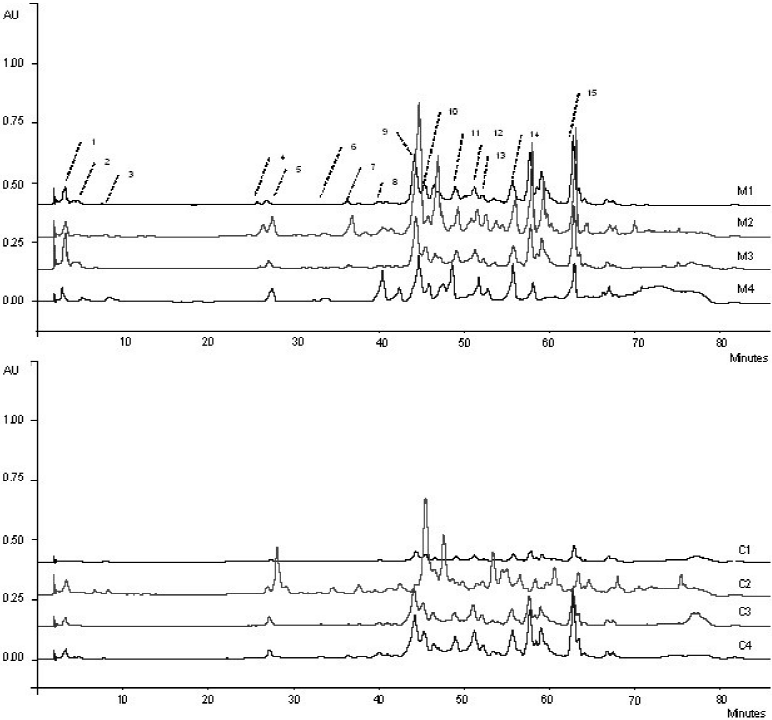
1: Gallic acid; 2: Cinnamic acid; 3: p-coumaric acid; 4: Naringenin; 5: Quercetin; 6: Luteolin; 7: Kaempferol; 8: Apigenin; 9: Pinocembrin; 10: Pinobanksin 3-acetate; 11: Caffeic acid phenethyl esther (CAPE); 12: Chrysin; 13: Galangin; 14: Acacetin; 15: Pinostrobin.
Fig. 1 Chromatograms of phenolic compounds from PEs from different pollen sources.
Table 3 Phenolic composition of phenolic extracts (PEs) from different pollen sources.
| No | Compound | Concentration (mg/g) | ||||||||
|---|---|---|---|---|---|---|---|---|---|---|
| Rt | M1 | M2 | M3 | M4 | C1 | C2 | C3 | C4 | ||
| 1 | Gallic acid | 19 | -- | -- | -- | -- | -- | -- | -- | -- |
| 2 | Cumaruie acid | 3 4 | 1.7 ±0.1a | 1.9±0.3a | 3.0 ±0.5b | 2.2 ±0.3a | 2 1 ±0.4a | 2.2 ±0.5a | 3.5±0.5b | 1.6 ±0.5a |
| 3 | p-coumaric acid | 7.8 | 3.2 ± 1.0d | 2.9±0.7d | 0.5±0.1b | 0.9±0.2C | 0.1 ±0.0a | 1.0±0.2c | 06±0.1b | 0.1 ±0.0a |
| 4 | Nawif eniii | 27 | 44.4 ± 3.5e | 54.4 ± 3 lf | 13.6 ±2.0b | 26.8 ±2.7c | 7.6 ± 1.0a | 136.0 ± 5.4g | 36.2 ± 2.5d | 36.9 ± 4.2d |
| 5 | Quercetm | 31 | 3.0 ± 1.0b | 6.7 ± 1.1bc | 3.2±0.8b | 4.9±16c | 0.1 ±0.0a | 29.5±3.1d | 3.0±1.2b | 3,6±1.4b |
| 6 | Luteolin | 36 | 0.2 ±0.1a | 3.6±0.5c | 0 2±0.1a | 0.5±0.1b | 0.1 ±0.0a | 2.9 ± 0.5c | 0.8±0.2b | 0.8±0.2b |
| 7 | Kaempferol | 37 | 0.1 ± 0.0b | 0.8±0.1c | 0.2±0.1b | 0.2±0.1b | 0.05 ±0.0a | 0.1±0.0b | 0.05 ±0.0 a | 0 1 ± 0 0bc |
| S | Apigenin | 41 | 4.5±0.2c | 4.6 ± 1.0c | 4.5 ±0.7c | 4.9±1.3c | 0.1 ±0.0a | 1.0±0.3b | 0.2 + 0.1a | 1.4 ± 0.5b |
| 9 | Pinocembrin | 45 | 11.5 ± 1.5b | 119.4 ±5.6f | 25.5±3.0d | 25.9±4.1d | 4.7 ± 1.5a | 101 9± 5.8e | 18 5 ±2.0c | 23.3 ± 3.ld |
| 10 | Pinobanksin 3-acetate | 46 | -- | -- | -- | -- | -- | -- | -- | -- |
| 11 | CAPE | 49 | -- | -- | -- | + | -- | -- | -- | -- |
| 12 | Chrysin | 51 | 4.0 ±1.0a | 13.0±1.5c | 2.2 ± 1.0a | 2.3 ±1.0a | 2.8 ± 13a | 11.6±3.0c | 7.5±1.7b | 7.1 ± 2.2b |
| li | Galangin | 52 | 13.8 ± 1.5e | 18.5 ± 12.0d | 5.4 ± 1.0d | 5.9±1.5b | 12±0.5a | 35.5±2.5b | 6.1 ±1.0e | 5.3 ± 1.5b |
| 14 | Acacetin | 57 | 0.3 ±0.1a | 0.1 ± 0.1a | 0.2 ± 0.1a | 0.2 ±0.1a | 0 3 ±0.1a | 8.7 ± 1.0c | 1.1 ±0.3b | 1,3 ± 0.5b |
| 15 | Piiiostrobui | 63 | -- | -- | -- | -- | -- | -- | -- | -- |
Rt: Retention time (min); --: Compound identified but not quantified. Mesquite (M1 to M4) and catclaw propolis (C1 to C4). All values represent means of triplicate determinations ± standard deviation. Means with different superscripts (a-g) among samples indicate significant differences (P < 0.05).
The identified phenolic compounds are similar to those reported by Shi et al. (2012), who evaluated the chemical profile of Chinese propolis. These latter authors reported the presence of 40 different phenolic constituents, highlighting four primary flavonoids (chrysin, pinocembrin, galangin, and pinobanksin 3-acetate). In agreement with our results, a Mexican PEs was found to contain several flavonoids such as catechin, naringenin, quercetin, kaempferol, pinocembrin, and chrysin (González-Búrquez et al., 2018). Also, our phenolic profile corresponds with that of previous reports on phenolic compounds in Prosopis (apigenin, cinnamic acid, luteolin, naringenin, and quercetin) and Mimosa (kaempferol, luteolin, myricetin, and quercetin) pollen (Almaraz-Abarca et al., 2007; LeBlanck et al., 2009; Freire et al., 2012). In addition, it has been reported that phenolic composition of propolis is associated with plant exudates and pollen type collected and processed by bees from different flora (Burdock, 1998; Matos, Alencar, & Santos, 2014).
Polyphenol content
Phenolic compounds such as flavonoids may directly contribute to the biological activities of PEs (Chaillou & Nazareno, 2009). The TPC values of the PEs varied according to pollen source (P < 0.05), ranging from 179.5 - 397.0 (mesquite) and 67.8 - 299.7 (catclaw) mg of pinocembrin-galangin equivalent/g (Table 4). The highest TPC value was reported for M4 and the lowest for C2, indicating that there were significant differences between propolis from different pollen types. In addition, the FFC ranged from 27.5 - 136.4 (mesquite) and 25.2 - 200.4 (catclaw) mg of quercetin equivalent/g, while the FDC ranged from 113.5 - 257.9 (mesquite) and 22.3 - 268.3 (catclaw) mg of pinocembrin equivalent/g.
Table 4 Total polyphenol and antioxidant activity of phenolic extracts (PEs) from different pollen sources.
| Propolis type | TPC A | FFC B | FDC C | FRAP D | FRS E |
|---|---|---|---|---|---|
| M1 | 179.5 ± 3.3d | 85.6 ± 3.8d | 223.8 ± 4.1d | 2.6 ± 0.07d | 41.4 ± 1.4c |
| M2 | 213.0 ± 2.8f | 136.4 ± 2.8e | 257.9 ± 3.3f | 2.9 ± 0.07e | 57.2 ± 1.0e |
| M3 | 196.9 ± 3.2e | 27.5 ± 2.5a | 113.5 ± 5.1c | 2.4 ± 0.06c | 39.1 ± 1.0c |
| M4 | 397.0 ± 4.2h | 46.8 ± 2.8b | 247.0 ± 2.0e | 7.2 ± 0.06g | 72.3 ± 3.5f |
| C1 | 67.8 ± 2.4a | 25.2 ± 0.5a | 22.3 ± 1.5a | 1.0 ± 0.01a | 11.5 ± 0.5a |
| C2 | 299.7 ± 1.9g | 200.4 ± 3.4f | 268.3 ± 5.7g | 3.2 ± 0.02fb | 54.4 ± 1.0d |
| C3 | 104.9 ± 5.0b | 47.1 ± 2.1b | 37.4 ± 3.1b | 1.6 ± 0.05b | 25.5 ± 1.0b |
| C4 | 128.9 ± 1.5c | 58.4 ± 1.2c | 112.9 ± 2.7c | 2.3 ± 0.09c | 41.4 ± 1.2c |
A Expressed as mg of pinocembrin-galangin equivalent/g; B Expressed as mg of quercetin equivalent/g; C Expressed as mg of pinocembrin equivalent/g; D Ferric reducing antioxidant power expressed as mg of Fe (II) equivalent/g; E Free radical scavenging activity expressed as inhibition percentage (%). All values represent means of triplicate determinations ± standard deviation (n = 3). Means with different superscripts (a-h) among samples indicate significant differences (P < 0.05).
In disagree study, Matos, Alencar, and Santos (2014) reported a negative correlation between the dominant pollen types (Mimosa pudica and Eucalyptus sp.) and the TPC in Brazilian propolis. Meanwhile, the present results agree with those of Dias, Pereira, and Estevinho (2012), who characterized several propolis samples according to pollen origin and found the highest TPC and TFC (expressed as a mass percentage) in samples from Quercus sp. (28 and 12%, respectively), followed by samples from Castanea sativa (23 and 9.5%, respectively), Pinus sp. (17 and 4%, respectively), and Populus sp. (11.1 and 3.1%, respectively). According to LeBlanck et al. (2009), mesquite and mimosa pollen display the highest antioxidant activity with respect to chenopod, yucca and palm pollen, which is due to the different TPC of pollen types as a result of their geographical and botanical origin.
Antioxidant activity
In vitro studies have demonstrated the strong antioxidant efficacy of PEs (Chaillou, Herrera, & Maidana, 2004; Navarro-Navarro et al., 2012; Mašek et al., 2018). The FRAP assay enabled the reducing ability of the antioxidants present in the PEs to be determined based on their reaction with the ferric tripyridyl triazine complex (Fe3+-TPZ) (Benzie & Strain, 1999). As shown in Table 4, the results indicated that the highest FRAP values (P < 0.05) were obtained for the mesquite samples, ranging from 2.4 - 7.2 mg Fe (II) equivalent/g, while the values for the catclaw samples ranged from 1.0 - 3.2 mg Fe (II)/g.
In agreement with our results, Moreira et al. (2008) studied the antioxidant properties of Portuguese propolis extracts from pollens of different origin. The highest reducing power activity was found in propolis from Castanea sativa (> 1.0 abs at 700 nm) compared to propolis from Populus tremula (0.8 - 1.0 abs at 700 nm), demonstrating the differential presence of reducing compounds (i.e., antioxidants) in the PEs of different pollen types. In another work, LeBlanc et al. (2009) evaluated the antioxidant activity of pollen extracts from the Sonoran Desert and found that mesquite and catclaw pollen extracts displayed the highest FRAP activity, which was correlated with the presence of phenolic compounds, compared to yucca, palm, terpentine bush, and chenopod pollen extracts.
Moreover, the FRS assay is used to test the capacity of antioxidant components to act as donators of hydrogen atoms (Molyneux, 2004). The highest FRS values (P < 0.05) were obtained for the mesquite samples in a range of 39.1 - 72.3%, while the values of the catclaw samples ranged from 11.5 - 54.4%. Moreira et al. (2008) similarly studied the antioxidant properties of Portugal propolis from different pollen sources and found the highest FRS activity for propolis from Castanea sativa (> 80% of inhibition at 100 µg/mL) with respect to propolis from Populus tremula (70 - 80% of inhibition at 100 µg/mL). The high FRS activities were associated with the high TPC of the latter samples (> 300 mg GAE/g). Additionally, another study revealed that some of the phenolic compounds in Sonoran propolis (northwestern Mexico), mainly flavonoids, contributed to FRS activity (Hernández et al., 2007; Navarro-Navarro et al., 2012; Vargas-Sánchez et al., 2014).
Antimicrobial activity
The antimicrobial activity of the PEs was measured according to the broth microdilution method (Wiegand, Hilpert, & Hancock, 2008). As shown in Fig. 2, the PEs showed various degrees of inhibition against the evaluated bacterial strains (P < 0.05). In particular, S. aureus and L. innocua (Gram-positive) were more affected than E. coli and S. typhimurium (Gram-negative bacteria) in the following order: S. aureus > L. innocua > E. coli > S. typhimurium. The highest inhibition values (P < 0.05) were obtained in mesquite samples (M2 and M4, at 500 µg/mL) against S. aureus (70 - 80%) and L. innocua (65 - 75%). Also, the same effect was found on E. coli and S. typhimurium regardless of pollen source (< 40% of inhibition), indicating a pollen type effect.
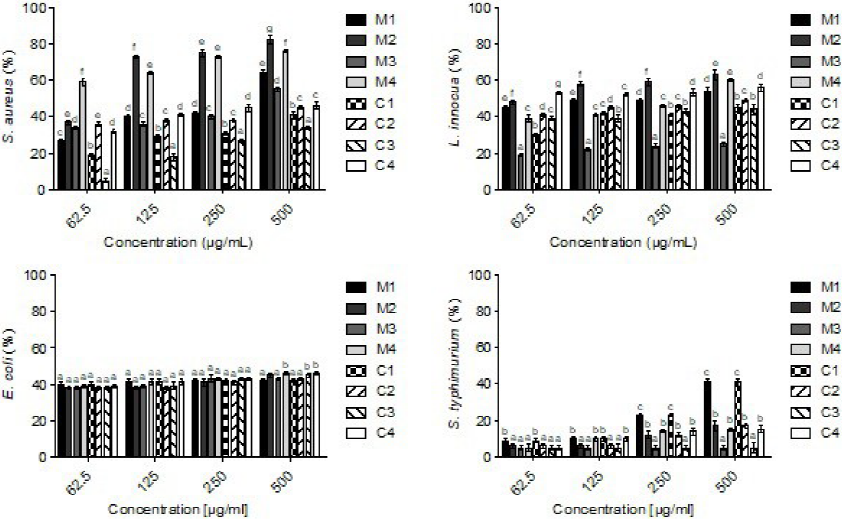
Positive control gentamicin (12 µg/mL) exhibited > 97% inhibition against all pathogens. Bars represent means of triplicate determinations ± standard deviation (n = 3); different superscripts (a - g) indicate significant differences (P < 0.05) among samples.
Fig. 2 Antibacterial activity of phenolic extracts (PEs) from different pollen sources (inhibition, %).
Based on the microdilution method, it was previously reported that PEs inhibit the growth of foodborne pathogens, mainly S. aureus (Farré, Frasquet, & Sánchez, 2004; Navarro-Navarro et al., 2012), which is associated with the presence of phenolic compounds from different plant sources. For example, Eumkeb, Siriwong, and Thumanu (2012) reported that luteolin, a flavonoid commonly present in PEs, in combination with others phenolic compounds had a high antimicrobial effect against E. coli (> 200 µg/mL), which was associated with protein inhibition and the peptidoglycan synthesis mechanism. Additionally, the flavonoids naringenin, hesperetin, 3'-demethoxysudachiqin, pinocembrin, pinobanksin, pinobanksin 3-O-acetate, xanthomicrol, chrysin, galangin, acacetin, and the phenolic acid (caffeic acid phenethyl ester, CAPE) were associated with the antimicrobial activity of Sonoran propolis (Hernández et al., 2007).
According to Silici, Ünlü, and Vardar-Ünlü (2007), propolis associated with plant resins such as Populus sp., Eucalyptus sp., and Castanea sativa exhibited high antimicrobial activity against Gram-positive bacteria such as B. cereus, E. feacalis, E. faecium, L. monocytogenes, L. innocua, L. welshimeri, L. seeligeri, S. aureus, and S. pyogenes. In addition, propolis from Quercus sp., Castanea sativa, Pinus sp., and Populus sp. was found to exert antimicrobial activity on methicillin-resistant S. aureus. The effect was dependent on the dosage and botanical origin. Notably, propolis from Quercus sp. showed the highest antimicrobial activity against this Gram-positive bacterium (Dias, Pereira, & Estevinho, 2012).
Principal component analysis
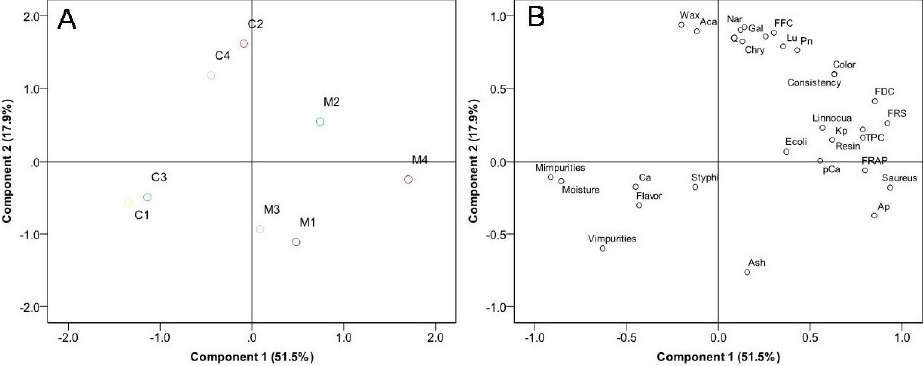
As shown in Fig. 3A and 3B, to evaluate the differences among propolis from different pollen sources, a multivariate analysis was carried out. The principal components 1 and 2 explained 51.5% and 17.9% of the variance, respectively. In other words, an accumulative 69.4% of the total variation was explained by the two first principal components. The results showed the separation of the analyzed samples. For example, mesquite propolis samples were separated from catclaw propolis samples (Fig. 2A), which may be associated with differences in their organoleptic, physicochemical, and phenolic composition as well as antioxidant and antibacterial activity (P < 0.05). The loadings graph (Fig. 2B) showed how each variable contributed to the discrimination of pollen type. Therefore, these parameters could be used to classify bifloral propolis samples.
Conclusion
The results obtained in the present study demonstrated that the organoleptic and physicochemical properties of propolis samples from mesquite and catclaw complied with international quality regulations. Mesquite propolis showed the highest antioxidant (FRAP and FRS) and antibacterial activity (mainly against S. aureus followed by L. innocua), which were associated with the high phenolic content (TPC, FFC and FDC) and presence of phenolic compounds. Additionally, the multivariate analysis was helpful for differentiating propolis by pollen source (mesquite and catclaw).

