


 text new page (beta)
 English (pdf)
 Article in xml format
 Article references
 Send this article by e-mail
 Cited by SciELO
  Similars in
SciELO
Similars in
SciELO 
 Permalink
Introduction
Rainfed or seasonal agriculture is one of the most vulnerable forms of cultivation to the effects of climate change, producing either drought or excess moisture and thus damaging crops and causing substantial economic damage (O’Brien et al., 2004; Zaidi et al., 2008; PNUD, 2010; Martínez-Fernández, 2006). In developing countries with scarce resources for technological investment, rainfed agriculture is extremely important for food production. On a worldwide level, Mexico is one of the top countries in maize consumption, as this product the main source of protein for the population (Conde et al., 2006) in both rural and urban areas (Rangel-Meza et al., 2003; Bertran-Vilá, 2010). Some twenty million habitants depend solely on the maize produced in their sectors (Damián-Huato et al., 2011; González-Merino & Ávila-Castañeda, 2014; Murray-Tortarolo & Jaramillo, 2018).
In Mexico, sixty native varieties of maize are cultivated (Carrera-Valtierra et al., 2011) on approximately six million hectares, which constitutes more than half of the cultivated land in the country. Of this area, only 14% is irrigated, the remaining 86% is under seasonal cultivation (González-Merino & Ávila-Castañeda, 2014; INEGI, 2017). A high yield in maize production is closely related to the number and quality of seeds per ear of maize that reach physiological maturity (Hall, 1980; Andrade et al., 1999; Traore et al., 2000; Martínez-Álvarez, 2015). Furthermore, the optimal physiological development during each phenological stage is of utmost importance in reaching a high crop yield.
For more than two decades, diverse studies in Mexico have been carried out on the vulnerability of seasonal maize crop, under the effects of climate change (Conde et al., 1997; Ruiz-Corral et al., 2000; Bellón et al., 2011). These studies have focused on the monthly and annual effects of climate variation, such as rising temperatures, the frequency and severity of droughts, and excess moisture, which in turn are the principal factors that affect the quality and quantity of maize harvests (Conde et al., 2000; Tinoco-Rueda et al., 2011; Ahumada-Cervantes et al., 2014; Murray-Tortarolo & Jaramillo, 2018; Reyes-Anistro et al., 2018). However, there are few studies of the damage caused by the daily changes in precipitation and temperature on the various phenological stages of maize (McWilliams et al., 1999; Guevara, 2007).
Climatic hazard is defined as a climatic extremes condition in a determined period of time that has the capacity to threaten a human or ecosystem activity. Climatic hazard can be determined annually by considering the number of times a determined meteorological condition occurs (Zúñiga & Magaña, 2018). Specifically, climatic hazard to maize crop, is defined as the potential propensity of a climatic event that could cause a decrease of yield or total loss.
As of today, there have been no proposals of indicators for climatic hazard, especially for crops; the development of these indicators could be a tool for identifying specific meteorological variables that limit the growth and development of maize in seasonal planting and during specific phenological stages and could be elemental to guarantee greater production.
In the present study we aimed to generate and validate indicators of climatic hazard for the seasonal maize crop in Bajo Balsas, Michoacán, Mexico, considering the different plant phenological stages.
Method
Description of the study area
The Bajo Balsas Sub-basin (Figure 1) is inside of Infiernillo-RTP-116, catalogued as a priority land region for Mexico, included in the Program for Priority Regions for the Conservation of Biodiversity by the CONABIO (Comisión Nacional para el Conocimiento y Uso de la Biodiversidad). The Sub-basin is extremely important for the water catchment of the region, which favors the establishment of several animal and plant species. It is characterized by deciduous secondary lower forest vegetation and the principal economic activity is seasonal agriculture (Arriaga-Cabrera et al., 2000).
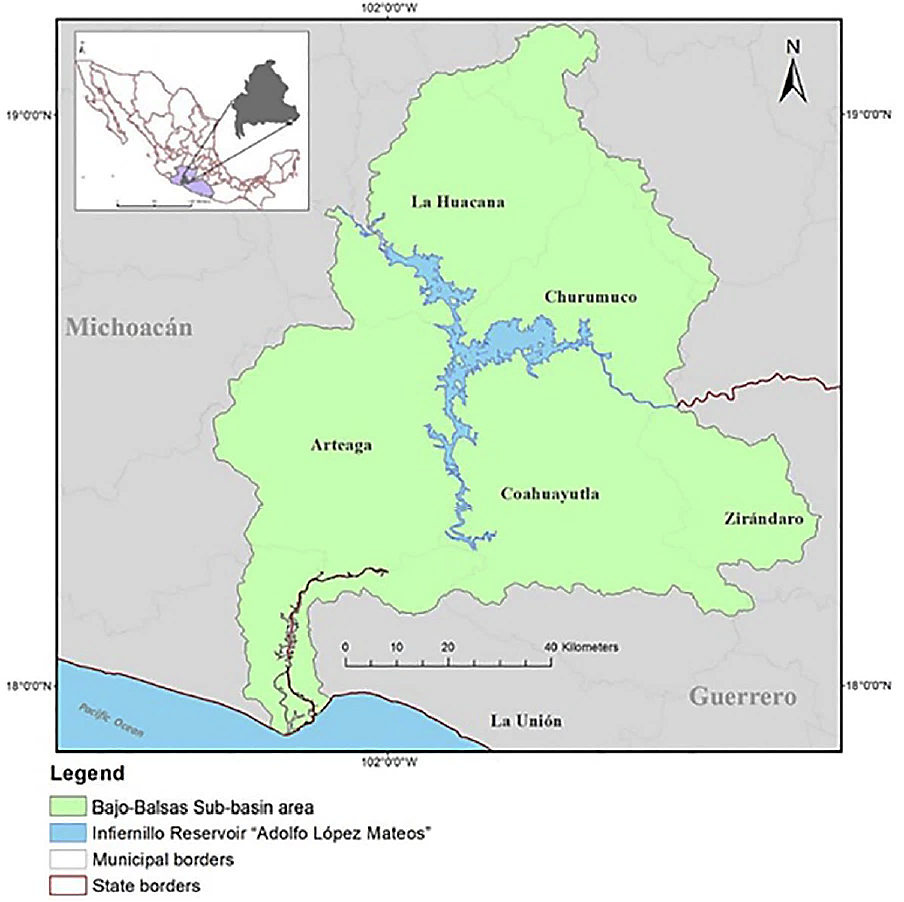
In the Bajo Balsas Sub-basin, the seasonal cultivation of maize occupies 48% of the total planted land, followed by sorghum (26%), sesame (20%) and hibiscus (5%) (SIAP 2018). In this catchment area, planting is done seasonally, mainly on small farms for self-consumption. For maize, the average yield during 1999-2016, in the Bajo Balsas Sub-basin, was 1.9 tons/hectare (t/ha), with a maximum of 2.95 t/ha in 2011 and a minimum of 0.76 t/ha in 2002 (SIAP, 2018).
Climatic requirements for maize, and the basis for climatic data
A bibliographic search was performed to identify 1) the climatic requirements for maize according to phenological studies, and 2) the cultivation methods and principal varieties cultivated in the region (Ruiz-Corral et al., 2013; SAGARPA, 2015).
We consulted the CLICOM (2018a) system to identify the meteorological stations of the study area. Then we selected the meteorological stations using two criteria: 1) stations with more than 30 years of continuous daily data, and 2) stations currently operating (CLICOM 2018b).
Within the Bajo Balsas Sub-basin only one meteorological station of the National Meteorological Service (SMN, 2018a) matched our criteria. The climatic station selected is located in the semi-arid zone, which represents 80% of the Bajo Balsas sub-basin area (Burgos & Paez-Bistrain, 2018); belongs to a seasonal maize producing municipality (La Huacana), according to the information reported by the Agrofood and Fishing Information Service of Mexico (SIAP, 2018). A database was elaborated with the following daily and monthly climatic parameters: pluvial precipitation (PP), maximum temperature (Tmax) and minimum temperature (Tmin). These data were later processed to obtain the climatic hazard indicators.
Development of climatic hazard indicators
The climatic hazard indicators were developed as quantitative expressions. These indicators established the relation between the maize phenological stages (growth, development and yield) and climatic elements (Tmax, Tmin and PP) that affect maize production.
Maize (Zea mays L.) is a plant that has adapted to a large variety of geographic zones and is cultivated in tropical, subtropical and mild weather regions. Optimal yields occur at altitudes from 0 to 2,500 meters above sea level, although it has been cultivated in altitudes as high as 3,300 masl (Ruiz-Corral et al., 2013).
The cycle for maize maturation varies according to the maize variety. In the Bajo Balsas, sowing start at the beginning of the rainy season, traditionally after the first rain in summer, which usually occurs from May 15 to June 1. Water availability is a yield-limiting factor for maize, as it is especially sensitive to water stress during the flowering stages, and affects the number and size of kernels developed (Traore et al., 2000; Moussa & Abdel-Aziz, 2008; Kahiu et al., 2013). Maize growth can tolerate temperatures above 32°C, but temperatures above 35°C are detrimental in the flowering stages due to the lost of pollen viability and the reduction of stigmas number (Giménez, 2012).
The available information about the climatic requirements for seasonal maize crop in the studied region confirms that a lack of precipitation during the month of July, combined with temperatures over 38°C, kills the recently emerged seedlings. However, the grower may consider reshowing because, if the climatic conditions improve, it is still possible to achieve a good harvest. Nevertheless, if the combination of drought and temperatures over 38°C occurs during the reproductive stage (when the plant is in the male flowering stage or during the growth and maturation of the kernels), the harvest will suffer a significant decrease in quality (Hall, 1980; Andrade et al., 1999, Giménez, 2012) or will be lost completely (Fassio et al., 1998; Rimski et al., 2009).
Another negative effect of drought and high temperatures is the asynchrony between pollen liberation and the stigmas emergence (Avendaño-Arrazate et al., 2008), which alters the pollination process and consequently the yield.
An agricultural practice of the seasonal producers in the region to eliminate the moisture from the kernels consists of leaving the ears of maize on the standing stalks to be dried in the sun. Harvesting begins three weeks after the ears reach their physiological maturity. Rainfall during the months of October and November does not allow the ears of maize to dry properly and favors the attack of plagues and fungi, decreasing the quantity and quality of the harvest (García-Lara & Bergvinson, 2007).
Once maize has reached physiological maturity, the kernels will start to lose moisture gradually. About 20 to 22 days after reaching physiological maturity the kernels’ water content should be around 20%, and harvest usually takes place at this point. The moisture loss rate in physiologically mature kernels depends mainly on temperature; but the drying speed also varies among maize variety.
The phenological growth stages of maize proposed by Ritchie and Hanaway (1986), with an adjustment for the actual days of growth reported in the region, are described in Table 1. The climatic hazards for each development stage are also shown there.
Table 1 Stages of maize growth and hazards
| Phase | Stage | Days | Characteristics | Hazards |
|---|---|---|---|---|
| Sowing | 1 | Dry kernels (caryopsis) | The kernels will not germinate under drought or lowtemperatures | |
| Growth | VE | 5 | Emergence. The coleoptile emerges from the soil. | Loss of the plant by drought, wind and pests |
| V1 | 9 | The first leaf is visible. | ||
| V2 | 12 | The second leaf is visible. | ||
| V3 | 15 | The third leaf is visible. | ||
| Vn | 54 | The “n” leaf is visible. (Definite number of leaves between 16 and 22). | ||
| VT | 55 | The male flower is visible (masculine inflorescence) | ||
| Reproductive | R0 | 57 | Before the male flowering. | Pollen begins to be released. Partial or total loss of the recently pollinated kernels due to severe drought and high temperatures. |
| R1 | 59 | The stigmas are visible. Female flowering. | ||
| R2 | 71 | Blister stage where the embryo can be seen. | Reduction in size and number of kernels per ear. | |
| R3 | 80 | The milk stage. | ||
| R4 | 90 | Embryo growth stage. The embryo grows to approximately half the width of the kernel. | ||
| R5 | 102 | Serration stage. The kernel can be observed from the side. | ||
| R6 | 112 | Physiological maturity. Moisture of the kernel is 35%. | ||
| Harvest | 134 | The moisture of the kernel must be brought to below 14%. | Precipitation (humidity) can promote the development of fungus during the drying process. |
Source: Author’s own elaboration
The growth stages of maize were originally described by Hanway 1963 & Hanway 1966. In this research, was used the BBCH scale (Biologische Bundesanstalt, Bundessortenamt and Chemical industry) to describes in more detail the kernel maturation stages; including 17 vegetative stages (VE-Vn) and seven reproductive stages (R0-R6). Although the duration of each phenological stage varies according to the maize variety, the number of stages is the same.
We determined ten climatic hazard indicators for maize using the climatic variables database and the climatic requirements for cultivation of maize. We analyzed the climatic variables: daily Tmax, Tmin and PP, using ICC® software (Bautista, et al., 2016).
The developed indexes required daily meteorological information to determine the variations in temperature and precipitation, which are crucial for the maize growth cycles. We developed and integrated new programming module with the ICC® (Indicators of Climatic Change) software (Bautista, et al., 2016), which offers flexibility and ease of daily climatic data processing.
The programming module “climatic hazards for the maize crop” was designed and developed based on the stages for software defined by the Mexican law of technological information and life process (in NMX-I-O45-NYCE-2005). The stages involved are: a) process instrumentation; b) requirements analysis; c) architecture design; and d) codification and tests (NYCE, 2005). The tools used for the development of the module were open code and multiplatform: the programming language was Java version 1.8 (JDK), eclipse photon 4.8.0 was used as interface for integrated development (IDE), and Derby was applied as the managing system for databases (MSDD).
The development of the new module began with the analysis of the requirements of each of the indexes. We first defined the meteorological data that served as a beginning for the algorithms. Following this, the sequence began with the structuring of the retrieved data from MSDD and the ordering of matrices by day, month, and year and for the climatic variables. Missing data were replaced with the value 999.99, which was not taken into account in the computation of each indicator. The procedure was concluded with the display of the tabular results in the interface “Climatic hazards for maize crop”.
Classification of climatic hazards and mathematic validation
We used a series of 18 years from the climatic database; the chosen period being from 1999 to 2016 because it is the period in which there is available data of agricultural disaster by SIAP. This information was qualified in two ways: 1) according to the loss magnitude in maize production or size of sinister area for each year reported by the SIAP (2018a) supplementary Table1; and 2) according to incidences of severe drought reported in Mexico by SMN (2018b) supplementary Table 2.
Each of the 18 years with their ten calculated climatic hazard indicators were qualified. The production for these years was qualified into three classes: 1) low hazard: a sinister area from 0 to 10%, without drought reports; 2) moderate hazard: a sinister area from 11 to 50%, with moderate drought reports; 3) high hazard: a sinister area from 51 to 100%, with reports of severe drought.
The classification by maize production for each of the 18 years elaborated with the 10 indicators of climatic hazard was validated by data mining with WEKA software (Legrand & Nicoloyannis, 2005; Hall et al., 2009) using the following sequence: 1) selection of the climatic hazard, 2) qualification of the years by hazard level, and 3) application of the “J48” algorithm with the option Use training set for the elaboration of the decision tree, with the test mode 10-fold cross-validation and the metrics: true positive, false positive, precision, recall, f-measure and Matthews correlation coefficient.
The qualification of the climatic hazard was validated by the comparison between: 1) the decision tree of WEKA with a Kappa coefficient greater than 0.7, which would indicate the observed concordance over the total observations made by the “J48” algorithm and derives from the comparison of the metrics used by the algorithm (Cerda & Villarroel, 2008), and, 2) The information of the climatic variables that determine irreversible physiological damage in the maize plant during the different phenological stages of the plant.
Results
Indicators of climatic hazard
Understanding the maize growth stages is important to make agricultural practices more efficient and to improve production. The maize growth stages are (Figure 2): 1) vegetative phase (the development of 20 to 21 leaves or VT-Vn), and 2) reproductive phase (the flowering or R0-R1, 54 days after emergence, and physiological maturity or R6, 112 days after planting). Generally, maize plants follow the same pattern of growth, but the time between stages can vary depending on the variety cultivated, the location and temperature (SIAP, 2007).
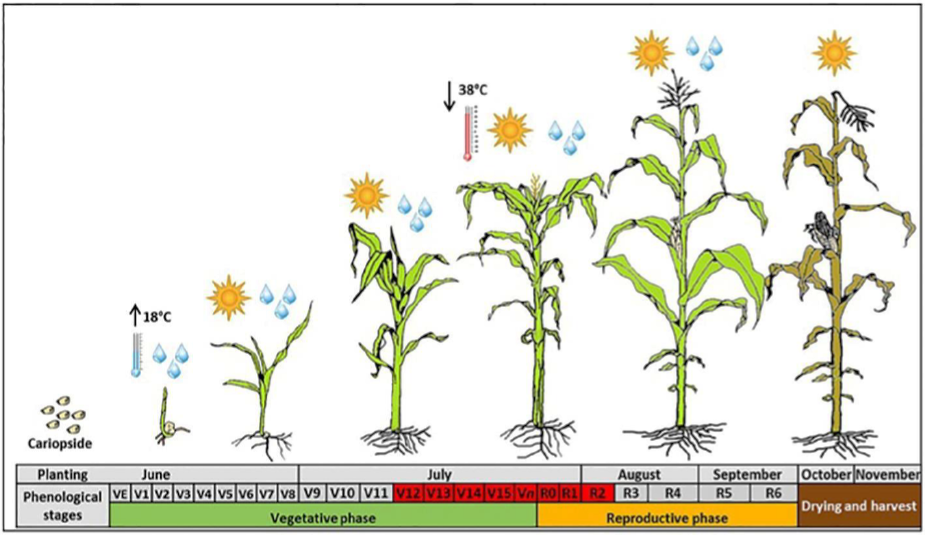
Figure 2 Climatic requirements for maize (the phenological stages of Zea mays L. were modified from Meier, 2001)
The present model was made under the assumption that the maize follows the physiological development stages proposed here, although we are aware that the duration of the stages may vary according to the climatic conditions of each year. The ten indicators that reflect the climatic hazards to the seasonal cultivation of maize come from the analysis of the variables of Tmax, Tmin and PP (Table 2).
Table 2 Description climatic hazard indicators for maize
| # | Indicator | Description | Phenological stage |
|---|---|---|---|
| 1 | DDE0jun | Number of dry days with precipitation equal to | VE-Vn |
| 2 | DDL5jun | 0Number of dry days with precipitation lower mm for the month of June. than 5 mm for the month of June. | |
| 3 | DDE0jul | Number of dry days with precipitation equal to 0 mm for the month of July. | R0-R1 |
| 4 | TX38jul | Number of days with temperatures higher than 38°C for the month of July. | |
| 5 | DDE0aug | Number of dry days with precipitation equal to | R2-R4 |
| 6 | DDL5aug | 0Number of dry days with precipitation lower mm for the month of August. than 5 mm for the month of August. | |
| 7 | TX38aug | Number of days with temperatures higher than 38°C in the month of August. | |
| 8 | DDE0sep | Number of dry days with precipitation equal to 0 mm for the month of September. | R5-R6 |
| 9 | WDH10oct | Number of wet days with precipitation higher than 10 mm for the month of October. | Dry |
| 10 | WDH10nov | Number of wet days with precipitation higher than 10 mm in the month of November. |
Source: Author’s own elaboration
The number of dry days (DDE0) affects the maize development in both the vegetative and the reproductive phases, which influence the yield (t/ha) and production (t) of the crop. Both, yield and production depend on the behavior of the precipitation, temperature and the soil water retention capacity.
For the development of this model we use a series of 18 years from the climatic database; the chosen period being from 1999 to 2016 qualified as described in methods (Table 3).
Table 3 Climatic series of 18 years with the indicators of climatic hazard calculated and the classification by maize crop production per year
| Year | WDH10 oct | WDH10 nov | DDE0 jun | DDE0 jul | DDE0 aug | DDE0 sep | DDL5 jun | DDL5 jul | TX38 jul | TX38 aug | Production classification |
|---|---|---|---|---|---|---|---|---|---|---|---|
| 1999 | 4 | 0 | 21 | 21 | 16 | 21 | 23 | 25 | 0 | 0 | Moderate |
| 2000 | 0 | 0 | 25 | 24 | 21 | 27 | 28 | 24 | 0 | 0 | High |
| 2001 | 1 | 0 | 24 | 22 | 20 | 19 | 26 | 23 | 0 | 0 | High |
| 2002 | 2 | 2 | 21 | 20 | 21 | 18 | 24 | 20 | 0 | 0 | Moderate |
| 2003 | 4 | 0 | 22 | 24 | 22 | 19 | 22 | 24 | 0 | 0 | Low |
| 2004 | 1 | 0 | 22 | 24 | 25 | 21 | 24 | 25 | 0 | 0 | Low |
| 2005 | 2 | 0 | 25 | 23 | 20 | 21 | 25 | 26 | 0 | 0 | Moderate |
| 2006 | 4 | 0 | 25 | 18 | 18 | 19 | 25 | 23 | 5 | 0 | Moderate |
| 2007 | 0 | 0 | 26 | 24 | 14 | 24 | 29 | 27 | 5 | 0 | High |
| 2008 | 1 | 0 | 25 | 23 | 25 | 20 | 27 | 27 | 2 | 6 | Low |
| 2009 | 3 | 0 | 26 | 24 | 26 | 23 | 29 | 26 | 10 | 28 | Low |
| 2010 | 0 | 0 | 22 | 20 | 13 | 19 | 22 | 24 | 2 | 0 | High |
| 2011 | 4 | 0 | 21 | 14 | 22 | 22 | 21 | 21 | 0 | 0 | Low |
| 2012 | 2 | 2 | 24 | 20 | 19 | 26 | 28 | 22 | 22 | 5 | Moderate |
| 2013 | 2 | 1 | 20 | 18 | 25 | 14 | 25 | 18 | 29 | 13 | Low |
| 2014 | 1 | 1 | 19 | 25 | 23 | 22 | 21 | 26 | 11 | 24 | Low |
| 2015 | 4 | 0 | 25 | 20 | 24 | 26 | 25 | 23 | 27 | 31 | Low |
| 2016 | 0 | 0 | 15 | 16 | 20 | 17 | 18 | 19 | 0 | 0 | High |
Source: Author’s own elaboration
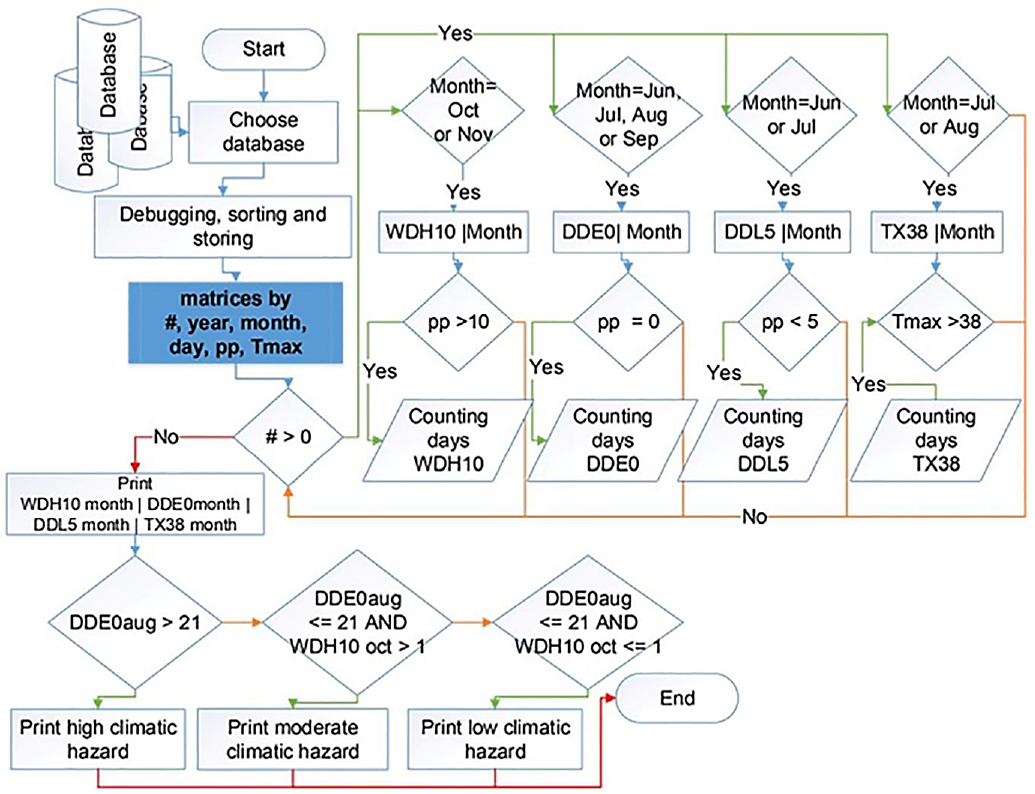
Figure 3 shows the algorithms developed and used in the ICC® software (Bautista et al., 2016) to obtain the ten climatic hazard indicators for maize crop, and the index with three categories of climatic hazard
Validation of the index of climatic hazard
The metrics obtained by the 18 qualified years and the 10 climatic hazard indicators for maize is show in Table 4, here we observed high values in all the metrics evaluated, for example the accuracy greater than 0.87.
Table 4 Metrics used in the Weka software by the J48 algorithm in the evaluation of the concordance between the climatic hazard indicators and the classification by maize production
| True positive |
False positive |
Precision | Recall | F- Measure | Matthews correlation coefficient |
Production Classification |
|---|---|---|---|---|---|---|
| 0.8 | 0 | 1.0 | 0.8 | 0.889 | 0.862 | High |
| 1.0 | 0.07 | 0.83 | 1.0 | 0.877 | 0.877 | Moderate |
| 1.0 | 0 | 1.0 | 1.0 | 1.0 | 1.0 | Low |
In the confusion matrix (Table 5) we observed that from the 18 years evaluated with the classification proposed, only one year was not correctly qualified. Which validates the model proposed in this work.
Table 5 Confusion matrix produced by Weka software by the J48 algorithm in the evaluation of the concordance between the climatic hazard indicators and the classification by maize production
| Classified as | Production Classification |
||
|---|---|---|---|
| High | Moderated | Low | |
| 4 | 1 | 0 | High |
| 0 | 5 | 0 | Moderate |
| 0 | 0 | 8 | Low |
The validation analysis of the climatic hazard index for the cultivation of maize, produced a correct classification in 94.4% of the cases (years) with an error of 5.5%. From the results obtained in the metric the Kappa statistics had a value of 0.91, indicating a very high concordance between the proposed classification by production and the 10 climatic hazard indicators for maize. According to the WEKA analysis, we obtained a decision tree with three leaves, which were produced by two main variables: DDEaug and WDHoct (Figure 4). The three leaves indicate the main variables responsible of assigning a year to a category when meeting specific requirements; the rest of the variables are considered of secondary importance.
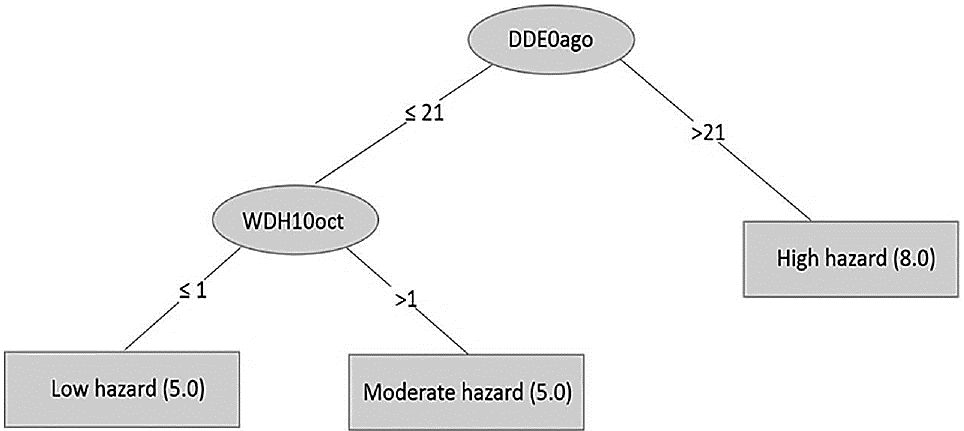
Figure 4 Decision tree obtained from WEKA software for the classification of climatic hazard of maize with a Kappa statistic of 0.914
According to the decision tree, the correct classification by maize production and climatic hazard for each year has the following assertions: If the total dry days (0mm) for August (DDE0aug) is higher than 21, then the production of maize is correctly classified as low, and this year is under a high climatic hazard. (Table 5). However, if the total of dry days (0 mm) for August (DDE0aug) is less than 21, then the climatic hazard classification is dependent on the total rainy days (higher than 10 mm) for October (WDH10oct). If October had zero days with a precipitation higher than 10 mm, then the year was correctly classified as having moderate production, and this year was considered to be under a moderate climatic hazard. Finally, if October has more than one day with precipitation higher than 10 mm, then the year was correctly classified as being of high production and under a low climatic hazard.
Another climatic variable that we considered as primary hazard indicator was atypical rain in the dry season. Atypical rain in the study region is important for the recharge of the phreatic layer levels and other water bodies. According to the index of climatic hazard developed in the present study, atypical rains higher than 10 mm of precipitation during October and November (WDH10oct and WDH10nov) can damage and thus reduce the quality of the harvest. The moisture received during the dry season promotes the establishment of fungi and insects, affecting maize during its drying phase and producing irreversible damage to the harvested product (Fassio et al., 1998).
Discussion
In this study we achieved our purpose of defining and identifying the climatic hazard indicators considering the phenological stages, and we also generated a climatic hazard index for maize.
The contribution of the Intergovernmental Panel on Climate Change (IPCC, 2012) on the theoretical construction of risk establishes that climatic hazard increases with exposure to extreme climatic events and with the vulnerability of human and natural systems. For the human systems, the main drivers towards climatic hazard and the vulnerability to climate change (Lavell et al., 2012) are the sum of the alterations in: 1) the climatic system and 2) the socioeconomic processes (including the social process of adaptation). In the present study, climatic hazard refers to the first element of the risk, that is, the exposure to a determining climatic event. There is an ample consensus about the disaster being the materialization of risk (Cardona et al., 2012). For a specific crop, the risk is the result of the combination of climatic hazard, the conditions of vulnerability and the capability of the farmer to reduce negative consequences (i.e. for adaptation).
The World Meteorological Organization (WMO) and the Expert Team on Climate Change Detection and Indices (ETCCDI) formulated and defined 27 indices to identify extreme climate conditions produced by climate change (Peterson, 2005; Wang & Feng, 2007). These indices were used to identify a series of climatic conditions which could have effects on a physiological level in organisms in general, but omitted information of intervals of physiological tolerance presented for specific organisms. To address the lack of indices for specific crops, in the present study we propose various indicators of climatic hazard that reflect the critical periods for the development of maize in the region of Bajo Balsas, Michoacán.
The simultaneity of high temperatures and low precipitation in the same period is assumed in several studies to be an indicator of drought conditions (Fassio et al., 1998; Conde et al., 2000; Hatfield et al., 2011; Giménez, 2012; Murray-Tortarolo & Jaramillo, 2018), and we observed high values of the indicators DDE0jun, DDE0jul y DDE0aug, TX38jul y TX38aug. If a drought occurred in the months of June, July and August, we can infer a high climatic hazard and consequently a reduction in the yield of maize crops.
Our results showed that a drought for more than 21 days during the month of August (DDE0aug) constituted a primary indicator of high climatic hazard for the production of maize. This is consistent with the findings of another study which proposed that drought has different effects on the phenological stage of the maize crop (McWilliams et al., 1999). In that study, they observed that a drought during the growth stage (V6-V15) produced a daily reduction in the production up to 2%, while a drought in the reproductive stage generated a reduction of up to 6%, and when the drought continued as far as R6, they observed a production loss of 100%. In the maize plant a prolonged drought during the month of August (the reproductive stage) would cause water stress damage and/or a nutrient deficiency, thus reducing the quality and the number and size of kernels per remaining ear in an irreversible manner (Martínez-Álvarez, 2015). Additionally, a study showed that water stress reduces plant growth, diminishing the stomatal conductance and photosynthetic rate (Baiochi-Riboldi et al., 2016).
Although the mathematical validation with WEKA showed that the indicators DDE0aug and WDH10oct are the variables that generated a correct classification of climatic hazard, this does not mean that other indicators are not crucial in the production of maize but that there are primary and secondary variables that determine climatic hazard (Cerda & Villarroel, 2008).
Even if the number of days with a temperature higher than 38°C for the month of August (TX38aug) were not considered in the main classification variables proposed by the decision tree of WEKA, we observed that the years with more than 10 days with a temperature higher than 38°C (TX38aug) matched with the years of low production and high climatic hazard. We propose that the negative effect of this variable on production remains obscured by the weight of the DDE0aug variable. A study showed that rising temperatures will have a negative effect on maize, especially in its yield, due to the time reduction for all phenological stages (Ruiz-Corral et al. 2011).
The principal contribution of the present work consists in its being the first to: a) offer precise information about the climatic variables that affect each stage of maize; b) define the thresholds in the cultivation of maize; c) automate the calculation of the indicators by improving the ICC® software; and d) contribute to the understanding of the meteorological variables that effect maize yield over its full cycle.
For developing countries, this methodology would be useful and valid anywhere precipitation and temperature are important meteorological variables for seasonal agricultural production. However, in other cases, the presence of freezes and strong winds can negative influence good harvests.
Conclusions
We propose the following indicators to evaluate the climatic hazard for maize production in the Bajo Balsas Sub-basin, Mexico: a) DDE0jun, number of dry days with precipitation equal to 0 mm for the month of June; b) DDL5jun, number of dry days with precipitation lower than 5 mm for the month of June.; c) DDE0jul, number of dry days with precipitation equal to 0 mm for the month of July; d) TX38jul, number of days with temperatures higher than 38°C for the month of July; e) DDE0aug, Number of dry days with precipitation equal to 0 mm for the month of August; f) DDL5aug, number of dry days with precipitation lower than 5 mm for the month of August; g) TX38aug, number of days with temperatures higher than 38°C for the month of August; h) DDE0sep, number of dry days with precipitation equal to 0 mm for the month of September; i) WDH10oct, number of wet days with precipitation higher than 10 mm for the month of October; and j) WDU10nov, number of wet days with precipitation higher than 10 mm for the month of November. The absence of precipitation during the month of August (DDE0aug) and the number of rainy days with more than 10 mm for the month of October (WDH10oct) are the two most important indicators of climatic hazard for maize.
The algorithms developed in this study, for the calculation of the indicators of climatic hazard, permit the extraction of values of the climatic hazard indices in a rapid and reliable manner.
The proposed method for the validation of meteorological risk indicators with the WEKA software allowed the identification of the most important indicators that affect the phenology of maize.

