


 nova página do texto(beta)
 Inglês (pdf)
 Artigo em XML
 Referências do artigo
 Enviar este artigo por email
 Citado por SciELO
  Similares em
SciELO
Similares em
SciELO 
 Permalink
Introduction
Mexico City has an estimated population of 8 985 339 inhabitants (INEGI, 2017), which makes it a challenge to satisfy the population’s growing needs regarding the allocation of drinking water, drainage and sanitation. Most rivers in Mexico City have been enclosed in pipes, and their surface waters have been classified as polluted. The rivers under these conditions are: Churubusco, de las Avenidas, de los Remedios, San Juan, de la Compañía, San Buenaventura and Tlamaco dam; therefore these rivers can be considered a part of the drainage system (Perló-Cohen & Zamora-Saenz, 2017). It is estimated that 70 % of the drinking water source in Mexico City is groundwater, and over 26 % is imported from the Lerma and Cutzamala systems; 77 % of the population consumes less than 150 L of water per day, and 96 % of the population has drainage coverage (Guerrero et al., 2009; Ortega-Font, 2011). Considering these reports, it is estimated that population in Mexico City generates an approximate volume of wastewater of 57 m3 s-1, (CONAGUA, 2012); this wastewater goes through the drainage network: grand channel-west interceptor- central emitter (Aguilar-Garduño et al., 2007), and conducted to Hidalgo state. During its course, an important volume is poured into irrigation channels and is used for crop irrigation in the Mezquital Valley (CONAGUA, 2012). In Hidalgo State an agricultural area of approximately 456 855.69 hectares is sown, 80 % of which is rainfed and 20 % undergoes irrigation systems; the greatest surface is used for maize, bean, and oats forage crops (SIAP, 2017).
Many authors agree that wastewater is an important source of organic matter (Fuentes-Rivas et al., 2017) and nutrients such as nitrogen (N) and phosphorus (P) [Belaid et al., 2012], and applying this water to agricultural irrigation will provide a considerable amount of nutrients for crop nutrition (Romero-Álvarez, 1997; Rascón-Alvarado et al., 2008; Zamora et al., 2008). However, the nitrate and phosphate concentration found in wastewater may be due to the excessive application of fertilizers in agriculture (Hem, 1985; Chávez-Alcántar et al., 2011; Guangwei Huang, 2013), and its excess concentration can be lixiviated and cause pollution of groundwater, which may cause damages to the health of people who consume water from contaminated wells, as well as the progressive eutrophication of water bodies (Figueruelo-Alejano & Marino-Dávila, 2004); the importance of high nitrate concentrations in drinking water (10 mg L-1 N = 44 mg L-1 NO3-) lies in health problems for children, who are prone to catching hemoglobinemia (Hem, 1985; OMS, 1998).
Other earlier studies have proven that wastewater contains elements that are potentially toxic for aquatic organisms (Robledo-Zacarías et al., 2017) and heavy metals, added to the soil by irrigation, accumulate on the arable layer of agricultural soils (Siebe, 1994; Prieto-García et al., 2007; Flores-Magdaleno et al., 2011) and can be absorbed and accumulated in plants (Vázquez-Alarcón et al., 2001); furthermore, contact with wastewater affects the health of the overall population (Cifuentes et al., 1994; Cifuentes et al., 2000). On the other hand, wastewater poured into receiving bodies is a high risk for human health and the environment, since medications and narcotics have been found in wastewaters, and can potentially cause toxic effects (even in low concentrations) in aquatic organisms and soil microorganisms (Robledo-Zacarías et al., 2017).
On the other hand, wastewater used in the agricultural area known as the Mezquital Valley had a predominant composition of bicarbonate and sodium (Cuellar-Carrasco et al., 2015; López-García et al., 2016), therefore the use of wastewater in agriculture can have negative effects on the soil and crops regarding salinity and sodicity (Fuentes-Rivas et al., 2017). Toxicity problems in crops arise when some ions are absorbed and accumulated in their tissues in concentrations high enough to cause damage and reduce yields (Ayers & Westcot, 1985). This toxicity depends on the tolerance of a particular crop at extreme levels of ionic concentration (Sánchez-Bernal et al., 2013; Can-Chulim et al., 2017). The most important ions related to toxicity are: B3+, Cl- and Na+; once these ions are absorbed, they are transported to different parts of the plant and during transpiration they accumulate on the leaves.
Nitrogen is a nutrient for plants, however, nitrate concentration between 5 and 30 mg L-1 in irrigation water may affect sensitive crops (Ayers & Westcot, 1985), and regarding boron, toxicity presents itself in some crops when there is a concentration between 1 and 2 mg L-1 (Maas, 1990). The most frequent toxicity is caused by the content of Cl- in irrigation water, since this ion is easily absorbed by the root and carried to different parts of the plant (Ayers & Westcot, 1985).
Considering the above, the objective of this investigation was to determine the concentration of nitrate, phosphate and boron in wastewaters and to estimate its content of nutrients, as well as the estimation of the risk of toxicity by specific ions (B3+ and Cl-) that can affect normal crop development in a negative way. The focus of this investigation is quantitative and has a descriptive scope; given that in the area under study the largest area planted is dedicated to maize, bean and oat, these ions may affect each crop in a different way.
Methods
Sampling, water analysis and statistical analysis
To carry out this investigation, during September 2015 and April 2016, 188 wastewater, rivers and dam water samples were collected and analyzed from 135 sampling stations distributed in the Mexico City-Mezquital Valley drainage system (Fig. 1). Samples were collected according to NMX-AA-003-SCFI-1980, and considering the accessibility of the sites (SCFI, 1980).
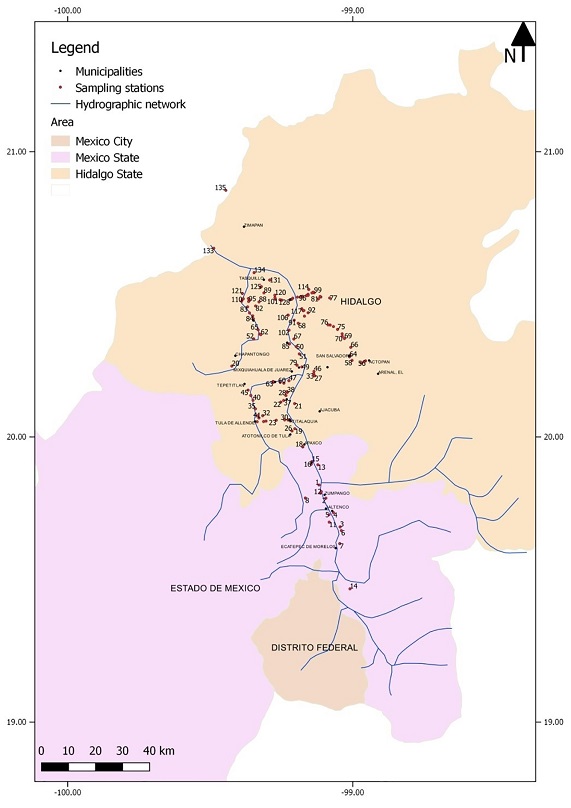
All the sampling stations (Table 1) were registered with a Geographic Positioning System (GPS Garmin® Etrex Venture HC). In each sampling station, 2 liters of water were collected and distributed into 1 L polypropylene containers previously washed with an HCl solution at 10 % concentration, then rinsed with distilled water. In all the sampling stations the channels flow in the open, the water was taken from the central part of the drainage channels at an approximate depth of 30 cm using a plastic 10 L bucket. Later, the containers were washed three times with the same collected water (Sánchez-Bernal et al., 2014).
Table 1 Sampling stations in México City-Mezquital Valley hydrographic network.
| ID | Coordinates | Altitude | Sampling station | Reference | State | |
|---|---|---|---|---|---|---|
| N | W | m | ||||
| 1 | 19.8313333 | -99.1186944 | 2293 | Irrigation channel | Zumpango-Tequisquiac | Mexico State |
| 2 | 19.7851667 | -99.09475 | 2278 | Channel la laminadora | Nextlalpan-Zumpango | Mexico State |
| 3 | 19.6843611 | -99.0446389 | 2246 | Channel Tonanitla I | Sta. María Tonanitla | Mexico State |
| 4 | 19.7343056 | -99.0678611 | 2245 | Channel Nextlalpan | Nextlalpan | Mexico State |
| 5 | 19.7271944 | -99.0835556 | 2244 | Channel Sn. Francisco | Nextlalpan | Mexico State |
| 6 | 19.6715333 | -99.0404833 | 2240 | Channel Tonanitla II | Sta. María Tonanitla | Mexico State |
| 7 | 19.6256167 | -99.04575 | 2239 | Pemex bridge channel | Los Héroes de Tecámac | Mexico State |
| 8 | 19.7855556 | -99.1666389 | 2239 | Grand channel | Zumpango | Mexico State |
| 9 | 19.7855556 | -99.1666389 | 2239 | Irrigation channel | Zumpango | Mexico State |
| 10 | 19.8029167 | -99.1136111 | 2238 | Zumpango lagoon | Zumpango | Mexico State |
| 11 | 19.7009444 | -99.0829167 | 2235 | East emitter tunnel vent 11 | Tultepec | Mexico State |
| 12 | 19.808 | -99.1106944 | 2233 | Ávila Camacho drain | Zumpango | Mexico State |
| 13 | 19.9021111 | -99.1226389 | 2228 | Tunnel Tequixquiac | Tequixquiac | Mexico State |
| 14 | 19.4670883 | -99.0100833 | 2225 | Peñon-Texcoco road channel | Texcoco | Mexico State |
| 15 | 19.9135 | -99.1437778 | 2213 | Tequixquiac stream | Tequixquiac | Mexico State |
| 16 | 19.9039722 | -99.1460556 | 2204 | Tunnel Tequixquiac | Tequixquiac | Mexico State |
| 17 | 19.9649167 | -99.1756944 | 2180 | Tula River | Apaxco de Ocampo | Mexico State |
| 18 | 19.9649167 | -99.1756944 | 2180 | Apaxco drainage | Apaxco de Ocampo | Mexico State |
| 19 | 20.0285556 | -99.2033056 | 2145 | Irrigation channel Texas | Atotonilco de Tula | Hidalgo State |
| 20 | 20.2482222 | -99.4245 | 2118 | Chapatongo River | José María Pino Suarez | Hidalgo State |
| 21 | 20.1166667 | -99.2042778 | 2111 | Irrigation channel Teltipan | Teltipan de Juárez | Hidalgo State |
| 22 | 20.1220833 | -99.2525278 | 2105 | Channel Tlahuelilpan | Tlahuelilpan | Hidalgo State |
| 23 | 20.0582778 | -99.26875 | 2103 | Channel Pemex II | Atitalaquia-Cardonal-Tula | Hidalgo State |
| 24 | 20.0565833 | -99.2196944 | 2098 | Irrigation channel Atitalaquia | Atitalaquia | Hidalgo State |
| 25 | 20.0536944 | -99.3130278 | 2094 | Channel Pemex IV | El llano-Tula de Allende | Hidalgo State |
| 26 | 20.02075 | -99.2135556 | 2093 | Tula River | Atotonilco de Tula | Hidalgo State |
| 27 | 20.2139444 | -99.1340833 | 2091 | Irrigation channel Morelos III | Mixquiahuala | Hidalgo State |
| 28 | 20.1449167 | -99.2347222 | 2091 | Irrigation channel Tlahuelilpan | Tlahuelilpan | Hidalgo State |
| 29 | 20.0591389 | -99.2270833 | 2089 | Irrigation channel la Quina | Atitalaquia | Hidalgo State |
| 30 | 20.0591389 | -99.2270833 | 2089 | Waterfall la Quina | Atitalaquia | Hidalgo State |
| 31 | 20.0593889 | -99.2392222 | 2087 | Channel Pemex I | Atitalaquia-Cardonal | Hidalgo State |
| 32 | 20.0742778 | -99.3162778 | 2085 | Channel Endho | El llano-Tula de Allende | Hidalgo State |
| 33 | 20.2214167 | -99.1373333 | 2079 | Irrigation channel Morelos II | Mixquiahuala | Hidalgo State |
| 34 | 20.05525 | -99.3046389 | 2077 | Channel Pemex III | Atitalaquia-El llano | Hidalgo State |
| 35 | 20.0984167 | -99.3417778 | 2076 | Channel Villagran I | Tula-Sta. Ana Ahuehuepan | Hidalgo State |
| 36 | 20.0745833 | -99.3337222 | 2064 | Channel Canadiense | Tula -Sta. Ana Ahuehuepan | Hidalgo State |
| 37 | 20.1279722 | -99.2423611 | 2050 | Channel Tlahuelilpan | Tlahuelilpan | Hidalgo State |
| 38 | 20.1557222 | -99.2303333 | 2049 | Channel Requena | Tlahuelilpan | Hidalgo State |
| 39 | 20.1588056 | -99.2304444 | 2047 | Irrigation channel el Tinaco | Tlahuelilpan | Hidalgo State |
| 40 | 20.1286667 | -99.3500556 | 2047 | Channel Villagrán II | Sta. Ana Ahuehuepan | Hidalgo State |
| 41 | 20.0662222 | -99.3295556 | 2040 | Green bridge channel | Tula de Allende | Hidalgo State |
| 42 | 20.1971389 | -99.2241944 | 2024 | Irrigation channel Tezontepec II | Tezontepec-Mixquiahuala | Hidalgo State |
| 43 | 20.1451667 | -99.3579722 | 2022 | Endhó dam | Endhó | Hidalgo State |
| 44 | 20.1451667 | -99.3579722 | 2022 | Endhó dam (drain) | Endhó | Hidalgo State |
| 45 | 20.1638611 | -99.3673611 | 2017 | Irrigation channel | Endhó | Hidalgo State |
| 46 | 20.2298056 | -99.1363056 | 2016 | Irrigation channel Morelos I | Mixquiahuala | Hidalgo State |
| 47 | 20.1971389 | -99.2241944 | 2014 | Irrigation channel Tezontepec I | Tezontepec-Mixquiahuala | Hidalgo State |
| 48 | 20.0531111 | -99.3357222 | 2002 | Tula River | Tula de Allende | Hidalgo State |
| 49 | 20.2453333 | -99.17875 | 2000 | Irrigation channel el Progreso | Progreso | Hidalgo State |
| 50 | 20.3163611 | -99.1985278 | 1994 | Irrigation channel la Mora | Xochitlán | Hidalgo State |
| 51 | 20.2908333 | -99.1878611 | 1994 | Irrigation channel Xoxitlan | Xochitlán | Hidalgo State |
| 52 | 20.3436389 | -99.3477222 | 1989 | Dolores dam | Cerro Azul-Oxtotipan | Hidalgo State |
| 53 | 20.1908611 | -99.2547778 | 1984 | Irrigation channel Tezontepec IV | Tezontepec | Hidalgo State |
| 54 | 20.3606667 | -99.3273056 | 1984 | Channel Rojo Gómez | Cerro Azul-Xamajé | Hidalgo State |
| 55 | 20.4243889 | -99.3511944 | 1978 | Irrigation channel Vicente Aguirre | Alfajayucan | Hidalgo State |
| 56 | 20.2664167 | -98.9554444 | 1977 | Wastewater channel | Actopan | Hidalgo State |
| 57 | 20.2641944 | -98.9601667 | 1975 | Irrigation channel Actopan | Actopan | Hidalgo State |
| 58 | 20.2681111 | -99.0028333 | 1973 | Irrigation channel Sn. Salvador | Poxindejé | Hidalgo State |
| 59 | 20.1910278 | -99.2791667 | 1973 | Water spring Tezontepec | Tezontepec | Hidalgo State |
| 60 | 20.1881389 | -99.2420278 | 1972 | Irrigation channel Tezontepec III | Tezontepec | Hidalgo State |
| 61 | 20.2595 | -98.9707778 | 1970 | Drain Boxthá | Actopan | Hidalgo State |
| 62 | 20.3584722 | -99.3228056 | 1970 | Rojo Gómez dam | Cerro Azul | Hidalgo State |
| 63 | 20.1943889 | -99.2796111 | 1964 | Tula River | Tezontepec | Hidalgo State |
| 64 | 20.2808056 | -99.0116111 | 1949 | Water well Sn. Salvador | Sn. Salvador | Hidalgo State |
| 65 | 20.3753056 | -99.33225 | 1946 | Irrigation channel Xamajé | Xamajé | Hidalgo State |
| 66 | 20.3139722 | -99.0073333 | 1936 | Irrigation channel caxuxi | Bominthza | Hidalgo State |
| 67 | 20.3431667 | -99.2069167 | 1928 | Irrigation channel Tlacotlapilco | Tlacotlapilco | Hidalgo State |
| 68 | 20.3984167 | -99.1915278 | 1927 | Irrigation channel Ecoalberto | Tlacotlapilco | Hidalgo State |
| 69 | 20.3448056 | -99.0295833 | 1926 | Irrigation channel boxani | Lagunilla | Hidalgo State |
| 70 | 20.3526667 | -99.03675 | 1924 | Irrigation channel Lagunillas II | Lagunilla | Hidalgo State |
| 71 | 20.2860278 | -99.0091944 | 1921 | Agricultural drainage | Sn. Salvador-El Bondhó | Hidalgo State |
| 72 | 20.3869167 | -99.0679444 | 1920 | Irrigation channel Yolotepec II | Yolotepec | Hidalgo State |
| 73 | 20.36125 | -99.0375 | 1920 | Irrigation channel Lagunillas II | Lagunilla-Patria Nueva | Hidalgo State |
| 74 | 20.3921944 | -99.0794167 | 1917 | Irrigation channel Yolotepec I | Yolotepec | Hidalgo State |
| 75 | 20.3767778 | -99.0536667 | 1917 | Irrigation channel Yolotepec III | Yolotepec-Patria Nueva | Hidalgo State |
| 76 | 20.3928056 | -99.0868333 | 1913 | Irrigation channel | Yolotepec-Julián Villagrán | Hidalgo State |
| 77 | 20.4871111 | -99.0813611 | 1887 | Irrigation channel debodhé-florida | Pozuelos | Hidalgo State |
| 78 | 20.2513017 | -99.19595 | 1887 | Tula River | Progreso | Hidalgo State |
| 79 | 20.2513017 | -99.19595 | 1887 | Infiltration water | Progreso | Hidalgo State |
| 80 | 20.4347222 | -99.3625556 | 1872 | Vicente Aguirre dam | Antonio Corrales | Hidalgo State |
| 81 | 20.4838889 | -99.1206389 | 1862 | Debodhé dam | Debodhé | Hidalgo State |
| 82 | 20.4590556 | -99.3411667 | 1850 | Irrigation channel Xigüi | Vía Huichapan-Ixmiquilpan | Hidalgo State |
| 83 | 20.4559167 | -99.3693056 | 1846 | Irrigation channel Sn. Francisco | Alfajayucan-Yonthé Grande | Hidalgo State |
| 84 | 20.4142778 | -99.3487778 | 1845 | Alfajayucan River | Alfajayucan | Hidalgo State |
| 85 | 20.326 | -99.2226389 | 1837 | Tula River | Chilcuautla | Hidalgo State |
| 86 | 20.326 | -99.2226389 | 1837 | Infiltration water for nopal irrigation | Chilcuautla | Hidalgo State |
| 87 | 20.326 | -99.2226389 | 1837 | Infiltration water for nopal irrigation | Chilcuautla | Hidalgo State |
| 88 | 20.4733611 | -99.3290833 | 1837 | Irrigation channel el Portezuelo | Portezuelo | Hidalgo State |
| 89 | 20.5050278 | -99.3119167 | 1803 | Irrigation channel Portezuelo 2 | Portezuelo | Hidalgo State |
| 90 | 20.4785 | -99.3635278 | 1803 | Irrigation channel el Bermejo | Yonthé Grande | Hidalgo State |
| 91 | 20.4092222 | -99.2058333 | 1800 | Irrigation channel El Alberto | Tlacotlapilco-Ixmiquilpan | Hidalgo State |
| 92 | 20.43525 | -99.1568333 | 1793 | Main channel alto Ixmiquilpan | Taxadhó | Hidalgo State |
| 93 | 20.4851667 | -99.3663056 | 1791 | Reservoir el Bermejo | Yonthé Grande | Hidalgo State |
| 94 | 20.5001389 | -99.1571389 | 1790 | Irrigation channel Arenalito | El Nith-Debodhé | Hidalgo State |
| 95 | 20.4748333 | -99.3655 | 1790 | Irrigation channel Yonthe Grande | Yonthé Grande | Hidalgo State |
| 96 | 20.4950278 | -99.1635556 | 1789 | Irrigation channel la estación | El Nith-Debodhé | Hidalgo State |
| 97 | 20.4961667 | -99.1568889 | 1789 | Irrigation channel bangandhó | El Nith-Debodhé | Hidalgo State |
| 98 | 20.4234167 | -99.1696389 | 1789 | Irrigation channel Maguey Blanco | Parque acuático Maguey Blanco | Hidalgo State |
| 99 | 20.5055556 | -99.1357222 | 1788 | Irrigation channel EST-57 | Debodhé | Hidalgo State |
| 100 | 20.4905833 | -99.1123333 | 1787 | Debodhé dam (drain) | Debodhé | Hidalgo State |
| 101 | 20.4829444 | -99.2718611 | 1784 | Irrigation channel dexthó | Ixmiquilpan-Portezuelo | Hidalgo State |
| 102 | 20.3741944 | -99.2236389 | 1784 | Tula River | Tlacotlapilco | Hidalgo State |
| 103 | 20.4924722 | -99.1148056 | 1775 | Irrigation channel Debodhé | Debodhé | Hidalgo State |
| 104 | 20.5072778 | -99.1392222 | 1772 | Irrigation channel capula | Debodhé | Hidalgo State |
| 105 | 20.4268889 | -99.2270556 | 1769 | Tula River in Ecoalberto | Tlacotlapilco-Ixmiquilpan | Hidalgo State |
| 106 | 20.4268889 | -99.2270556 | 1769 | Irrigation channel | Tlacotlapilco-Ixmiquilpan | Hidalgo State |
| 107 | 20.5047222 | -99.1435278 | 1766 | Agricultural drainage bangandhó | El Nith-Debodhé | Hidalgo State |
| 108 | 20.4902222 | -99.1944167 | 1761 | Irrigation channel | El Nith-Debodhé | Hidalgo State |
| 109 | 20.4426389 | -99.1741111 | 1759 | Wastewater channel | El Tephé | Hidalgo State |
| 110 | 20.4819167 | -99.38775 | 1758 | Infiltration water | Sn. Fco. Sacachichilco | Hidalgo State |
| 111 | 20.4756944 | -99.3901389 | 1758 | Sn. Francisco River | Sn. Fco. Sacachichilco | Hidalgo State |
| 112 | 20.4432222 | -99.1718333 | 1755 | Wastewater channel el Tephé | El Tephé | Hidalgo State |
| 113 | 20.4933056 | -99.1760833 | 1754 | Agricultural drainage | El Nith-Debodhé | Hidalgo State |
| 114 | 20.5170278 | -99.15475 | 1752 | Chicabasco River | Capula-El Rosario | Hidalgo State |
| 115 | 20.5170278 | -99.15475 | 1752 | Irrigation channel Chicabasco | Capula-El Rosario | Hidalgo State |
| 116 | 20.48825 | -99.2731667 | 1752 | Drenaje agrícola Dexthó | Ixmiquilpan-Portezuelo | Hidalgo State |
| 117 | 20.4493611 | -99.1791111 | 1750 | Irrigation channel Siqueiros | El Tepe | Hidalgo State |
| 118 | 20.4841667 | -99.3843333 | 1747 | Channel Xigatza | Sn. Fco. Sacachichilco | Hidalgo State |
| 119 | 20.4923333 | -99.1822778 | 1746 | Irrigation channel La joya | El Nith-Debodhé | Hidalgo State |
| 120 | 20.4969722 | -99.2736667 | 1746 | Irrigation channel Dexthó 2 | Ixmiquilpan-Portezuelo | Hidalgo State |
| 121 | 20.5029167 | -99.38725 | 1746 | Madho Corrales dam | Sn. Fco. Sacachichilco | Hidalgo State |
| 122 | 20.4795278 | -99.2492222 | 1745 | Irrigation channel el mexicano | Ixmiquilpan-Portezuelo | Hidalgo State |
| 123 | 20.4810278 | -99.2553333 | 1742 | Irrigation channel el mexicano 2 | Ixmiquilpan-Portezuelo | Hidalgo State |
| 124 | 20.5248889 | -99.3238056 | 1720 | Irrigation channel Tasquillo | Tasquillo | Hidalgo State |
| 125 | 20.5270833 | -99.321 | 1709 | Irrigation channel Tasquillo | Tasquillo | Hidalgo State |
| 126 | 20.4863056 | -99.2108056 | 1706 | Irrigation channel | Ixmiquilpan | Hidalgo State |
| 127 | 20.0605 | -99.2221111 | 1694 | Salt River Atitalaquia | Atitalaquia | Hidalgo State |
| 128 | 20.4806667 | -99.2210833 | 1693 | Tula River | Ixmiquilpan | Hidalgo State |
| 129 | 20.4821389 | -99.2151944 | 1693 | Wastewater channel | Ixmiquilpan | Hidalgo State |
| 130 | 20.5499722 | -99.2916389 | 1645 | Tula River | Juchitlán | Hidalgo State |
| 131 | 20.5499722 | -99.2916389 | 1645 | Water spring | Juchitlán | Hidalgo State |
| 132 | 20.5499722 | -99.2916389 | 1645 | Baths Tzindejéh | Juchitlán | Hidalgo State |
| 133 | 20.66125 | -99.48775 | 1596 | Zimapán Dam | Saucillo | Hidalgo State |
| 134 | 20.576 | -99.3463611 | 1590 | Tula River | Tasquillo | Hidalgo State |
| 135 | 20.8645 | -99.4455 | 935 | Moctezuma River | La Mora | Queretaro State |
The concentration of NO3-, PO43- and B3+ was determined by spectrophotometry (JENWAY® 7305 Spectrophotometer), with different dependent wavelengths based on the Beer-Lambert law, which indicates that by knowing the absorbance at a given wavelength it can be used to estimate the concentration (Rodger, 2013):
Where: A is light absorption, ε is the coefficient of extinction or dependent wavelength (nm), C is the concentration (mol L-1) and l is the length of the sample through which light passes (cm). NO3- was determined using the salicylic acid nitration method (Robarge et al., 1983); PO43-, with the ascorbic acid method (Eaton et al., 1998), and to find the concentration of B3+, the H-Azomethine method was used (Rodier, 1978). In all three cases, solutions of known concentrations were used to establish the calibration lines. The regression equations used were the following:
The ions Ca2+, Mg2+ were determined by volumetric titration with disodic EDTA (0.01 N), and the volumetric titration of Cl- was carried out with silver nitrate (0.05 N). The concentration of K+ was determined with a flame spectrometer (Instrumentation Laboratory® AutoCal Flame Photometer 643), the detection limit was 5 meq L-1 of K+ [Eaton et al., 1998; Richards et al., 1982]. The procedure to verify the correct analysis of water samples was the anion-cation balance criterion established in standard methods for the examination of water and wastewater (Eaton et al., 1998).
Once all the results were obtained from the chemical analysis of water, a statistical analysis was carried out on each one of the variable, which consisted in determining: normality test using the Kolmogorov-Smirnov method, skewness, kurtosis, minimum, maximum, mean, median, standard deviation, range, coefficient of variation (CV), quartiles, and extreme values (Montgomery & Runger, 2015). The software used was SAS® version 9.0 and the graphs were created in SigmaPlot® version 10.0.
To establish the risk of toxicity by specific ions, the concentrations of B3+, and Cl- were considered according to the criteria established in different investigations (Ayers & Westcot, 1985; Maas, 1990; Richards et al., 1982). The estimation of the nutrient content was carried out based on the results obtained from the concentrations of NO3-, PO43, B3+, Ca2+, Mg2+ and K+ using the dimensional analysis technique and considering 1 m irrigation sheet, which is normally applied on crops in the Mezquital Valley.
Results and discussion
Nitrate, phosphate and boron content in wastewater
The concentrations of nitrate, phosphate, and boron in wastewater in the Mexico City-Mezquital Valley drainage network (Table 2) were determined. For the three ions, the coefficient of variation was found to be high, indicating the heterogeneity in the concentration of these ions in the wastewater.
Table 2 Nitrate, phosphate and boron content.
| NO3- | PO43- | B3+ | |
|---|---|---|---|
| -------------------------------------- mg L-1 -------------------------------------- | |||
| Skewness | 0.726 | 0.986 | 0.268 |
| Kurtosis | 0.350 | 2.842 | 0.283 |
| K-S | 0.01 | 0.01 | 0.01 |
| Minimum | 1.440 | 0.00 | 0.00 |
| Maximum | 177.342 | 65.776 | 1.881 |
| Mean | 60.656 | 14.319 | 0.822 |
| Median | 57.185 | 15.490 | 0.777 |
| Std. Dev. | 36.294 | 10.804 | 0.318 |
| Range | 175.902 | 65.776 | 1.881 |
| CV | 59.836 | 75.451 | 38.782 |
| Q1 | 34.866 | 3.754 | 0.621 |
| Q3 | 73.467 | 22.293 | 1.028 |
| 95 % | 134.570 | 29.145 | 1.381 |
| K-S: Kolmogorov-Smirnov normality test (p-Value), (=0.05; n=188 | |||
Source: Author’s own elaboration.
Wastewater contains nitrogen, phosphorous, potassium, copper, iron and zinc and its use can reduce the need for fertilizers (Duncan & Cairncross, 1990). However, in this study, the concentration of nitrate was attributed precisely to the use of fertilizers; the wastewater, in its course across the agricultural area known as the Mezquital Valley, becomes enriched with these ions that are lixiviate from agricultural soils and transported in drainage water. The continuous use of wastewater may cause problems in the natural fertility soil, and in the protection of water resources due to the high concentration of sodium, nitrate and phosphate salts (Belaid et al., 2012).
The main drainage channel for Mexico City, through the 14-Peñón-Texcoco highway, had a nitrate concentration of 3.908 mg L-1, and the 16-Tequisquiac tunnel, 2.180 mg L-1 of nitrate. The highest concentration of this ion was found in the Tula River water in 17-Apaxco and 26-Atotonilco (153.380 mg L-1 and 154.578 mg L-1 respectively), in 112-agricultural drainage water (177.342 mg L-1 of NO3-) and filtration water in 30-Atitalaquia (146.431 mg L-1 of NO3-), indicating that wastewater coming from Mexico City, in its course through the State of Hidalgo is used in agriculture, and the excess of nitrogenated fertilizers is leached and evacuated by agricultural drainage, as well as the wastewater that is poured into the Tula River, so this River receives urban and industrial wastewater and agricultural drainage, which explains it nitrate concentration.
The data are asymmetrical (p-value < (); the third quartile (Q3) had a value of 73.467 mg L-1 of NO3-, and the median was of 57.185 mg L-1 of NO3-. These data indicated that wastewater contain excess of nitrate (> 30 mg L-1), 19 % of the water samples had between 5 mg L-1 and 30 mg L-1 of NO3-, and only six water samples contained lees than 5 mg L-1 of NO3-.
The excess nitrate is due to the discharging of agricultural drainage into this hydrographic network, this occurs by the altitudinal gradient (from 2293 masl to 935 masl); finally, the flow of water is evacuated by the Moctezuma River. Use of the wastewater for agricultural irrigation may decrease the yield and quality of sensitive crops; their sensitivity to high ion concentration varies during the crop’s phenological stages, so as the crop’s needs decrease, high ionic concentration may be harmful (Ayers & Westcot, 1987). Figure 2 illustrates the data distribution on the nitrate concentration found in the Mexico City-Mezquital Valley drainage network.
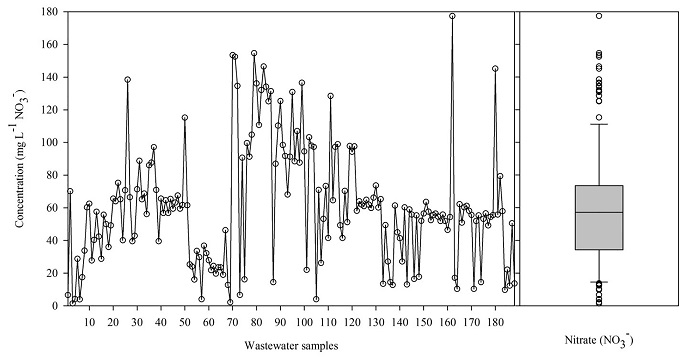
Figure 2 Distribution of the concentration of nitrate in the Mexico City-Mezquital Valley drainage network. Source: Author’s own elaboration.
On the other hand, water runoff and infiltration with high nitrate content due to fertilization practices, creates an important problem of widespread pollution in water resources, and if the nitrate reaches groundwater bodies, it can cause serious health problems for people, who consume this water (Aruzo et al., 2006).
In Mexico, the highest nitrate concentration permitted in sources of drinking water is (10 mg L-1 N = 44.26 mg L-1 NO3-) (Secretaría de Salud, 2000). This investigation did not analyze the quality of groundwater, but it is possible that the Mezquital Valley aquifer has infiltrations of wastewater, since more than 80% of the main channels are not revetted (Lesser-Carrillo et al., 2011). In this sense, there is a possibility that a part of this excess concentration of NO3- can lixiviate into the aquifer (Belaid et al., 2012), since irrigation sheet of over 1 m are applied in the crops irrigation, indicating that there is a leaching fraction greater than 0.45, it helps to keep low salinity levels (Hoffman, 1990), but it increases the risk of ions lixiviation such as NO3- outside the root zone of the crops.
The concentration of nitrogen is obtained using the following equations:
Estimated nitrogen content was 137.01 kg ha-1, for a 1 m irrigation sheet. The excessive concentration of salts and nutrients such as N are a risk for long-term agricultural production, although this conclusion must be verified for diverse types of crops and soils irrigated with wastewater (Belaid et al., 2012).
Regarding phosphate (Fig. 3), a high coefficient of variation was found. Maximum PO43- values were found in different irrigation channels: 65.776 mg L-1 (46-irrigation channel 1, Morelos colony, Actopan-Ixmiquilpan road), 60.849 mg L-1 (24-irrigation channel Atitalaquia), 36.899 mg L-1 (23-irrigation channel Pemex, Atitalaquia-Tula road), 36.212 mg L-1 (21-Teltipan-Tlaxcoapan road) and 36.091 mg L-1 (11-Eastern emission channel, Ecatepec). The latter corresponds to the discharge of wastewaters from Mexico City. Infiltration water (in Progreso and Chilcuautla) and the Juchitlán spring, in this agricultural area, presented the lowest concentration values for PO4-3 (<0.083 mg L-1), indicating a sanitation of wastewater through the soil. The mean value for PO43- was 14.319 mg L-1, and the median had a value of 15.490 mg L-1 of PO43-. Q1 had a value of 3.754 mg L-1 of PO43-, and Q3 had a value of 22.293 mg L-1 of PO43-; 95 % of the water samples had a concentration of PO43- lower than 29.145 mg L-1.
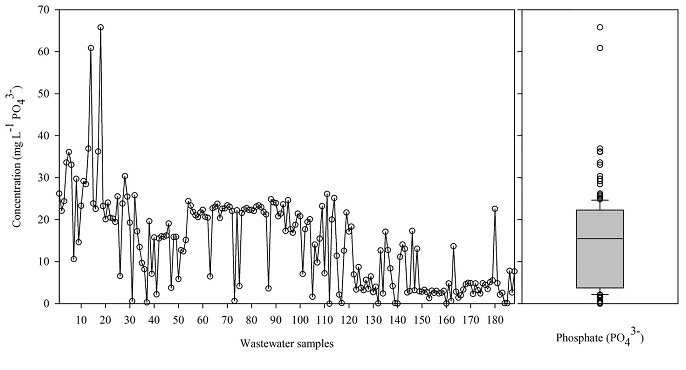
Figure 3 Distribution of the concentration of phosphate in the Mexico City-Mezquital Valley drainage network. Source: Author’s own elaboration.
The concentration of phosphorous and phosphate is obtained using the following equations:
In this case, the concentration of phosphorus in the water is, on average, of 4.66 mg L-1. This value indicates the hypertrophic condition in which the water is found (Moreno-Franco et al., 2010); domestic and industrial wastewater are the main source of phosphorus, as well as agricultural drainage, and its main characteristic is that it is composed of detergents that derive from anthropogenic activity (Lizárraga-Mendiola et al., 2013; Ongom et al., 2017) and the leaching of phosphated fertilizers. The phosphorus content was estimated in 46.6998 kg ha-1 on average for a 1 m irrigation sheet, which was attributed to the discharge of wastewater and the leaching of phosphated fertilizers. Normal phosphate values in irrigation water are generally below 2 mg L-1 (Ayers & Westcot, 1985); in this case, the excess concentration of phosphate may be due to agricultural, domestic and industrial discharge (Velázquez-Machuca et al., 2010).
Risk of toxicity due to the concentration of boron and chloride
The concentration of boron (B3+) was attributed to borax waste
Figure 4 shows the distribution of B3+ in wastewater. The highest values were the following: 1.881 mg L-1 (14-grand drainage channel near the Peñón-Texcoco road), 1.568 mg L-1 (113-agricultural drain, Nith-Debodhé road), 1.565 mg L-1 (11-eastern emission tunnel, Tonanitla-Xaltocan road, in Ecatepec), 1.494 mg L-1 (61-Boxtha drain in Actopan) and 1.461 mg L-1 (4-Nextlalpan). The mean and median were 0.822 mg L-1 and 0.777 mg L-1, respectively. Irrigation with this water may cause decrease in the yield of sensitive crops to a concentration of B3+ of over 0.3 mg L-1, whereas tolerant crops do not show symptoms at a concentration of B3+ in the soil solution of 4 mg L-1 (Page et al., 1990). It is recommended that the effects of irrigation water be measured directly on the soil and crops, yet it has been found that crop yields decrease as the concentration of B3+ increases to toxic levels (Pratt & Suarez, 1990):
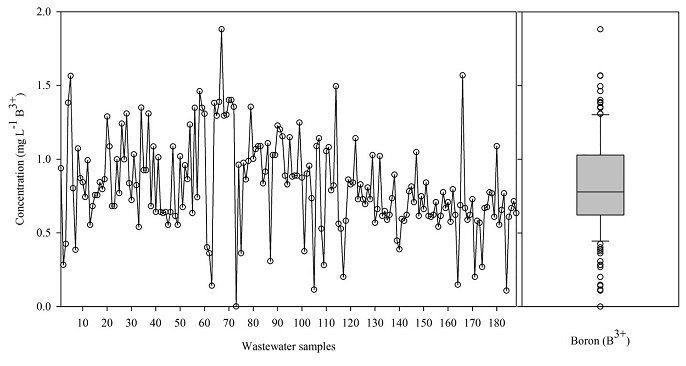
Figure 4 Distribution of the concentration of boron in the Mexico City-Mezquital Valley drainage network. Source: Author’s own elaboration.
Where y is the relative yield of a crop (%); m is the decrease in yield per unit increase B3+ concentration; A is the maximum concentration of B that does not reduce yield (threshold); x is the B3+ concentration in irrigation water.
For one concentration of B3+ in irrigation water, there is a different concentration of B3+ in the root zone, depending on the leaching fraction. In this case, the leaching fraction is estimated in 0.45 and this value helps keep low salinity levels, and as the leaching fraction decreases, the salinity in soil water increases, due to the effect of concentration (Pratt & Suarez, 1990) and this represents a risk of toxicity for crops, mainly for bean, which is considered sensitive to electric conductivity (EC < 1 dS m-1) and B3+ (< 1 mg L-1) (Maas, 1990).
The risk of toxicity by chloride (Cl-) was estimated with the ionic concentration of Cl- in irrigation water, and according to the following values (Ayers & Westcot, 1985): without restriction of use when the concentration of Cl- is < 4 meq L-1, use restriction is moderate between 4 meq L-1 and 10 meq L-1 of Cl- and the use is not recommended when concentrations are over 10 meq L-1 of Cl-. The mean was 5.077 meq L-1 of Cl- and the median was 4.935 meq L-1 of Cl-. The coefficient of variation was 36 % and indicates very heterogeneous Cl- values, Q1 had a value of 3.610 meq L-1 of Cl-, the value in Q3 was 6.215 meq L-1 of Cl-, and 95 % of the water samples had less than 7.960 meq L-1 of Cl-. According to the distribution of these data (Fig. 5), there is a risk of toxicity due to the concentration of Cl- for sensitive crops such as bean (Maas, 1990).
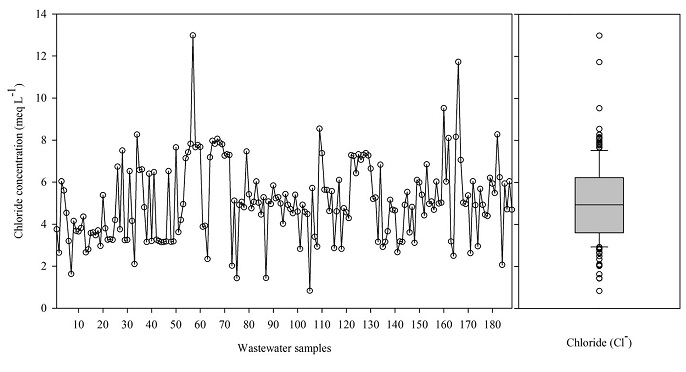
Figure 5 Distribution of the chloride concentration in the Mexico City-Mezquital Valley drainage network. Source: Author’s own elaboration.
The extreme values for the concentration of Cl-, higher than the upper limit, were found in drainage water: 12.98 meq L-1 (4-Nextlalpan), 11.72 meq L-1 (113-Nith-Debodhé road), 9.52 meq L-1 (97-Bangandhó), 8.54 meq L-1 (56-Actopan) and 8.27 meq L-1 in the 129-Mercado-Ixmiquilpan sampling station.
Content of nutrients and organic matter in wastewater
Regarding the content o N, P, K, Ca, Mg, total solids (TS) and total volatile solids (TVS or total organic matter OM), Table 3 shows the corresponding data. The following sequence was found, from higher to lower concentration: Ca > Mg > K > N > P. This water contains organic matter (276 mg L-1), as well as a considerable amount of total salts (>770 mg L-1), mostly sodium and bicarbonate (Cuellar-Carrasco et al., 2015; López-García et al., 2016), which creates the risk of salinization for soils and crops irrigated with this water.
Table 3 Content of nitrogen, phosphorous, potassium, calcium, magnesium, total solids and total volatile solids.
| Min. | Max. | Mean | Median | Std. Dev. | Range | CV | Q1 | Q3 | 95 % | |
|---|---|---|---|---|---|---|---|---|---|---|
| N | 0.325 | 40.060 | 13.701 | 12.918 | 8.198 | 39.735 | 59.83 | 7.876 | 16.596 | 30.398 |
| P | 0.00 | 21.452 | 4.670 | 5.052 | 3.523 | 21.452 | 75.45 | 1.224 | 7.270 | 9.505 |
| K | 6.256 | 66.473 | 29.257 | 26.980 | 10.509 | 60.217 | 35.92 | 24.047 | 31.673 | 51.224 |
| Ca | 9.616 | 76.152 | 42.290 | 42.886 | 12.645 | 66.533 | 29.90 | 34.869 | 50.100 | 64.128 |
| Mg | 8.266 | 88.860 | 40.761 | 39.497 | 13.783 | 80.594 | 33.81 | 29.045 | 50.083 | 63.211 |
| TS | 232 | 2472 | 1015.383 | 1046 | 340.784 | 2240 | 33.56 | 724 | 1224 | 1512 |
| TVS | 84 | 660 | 271.936 | 276 | 96.286 | 576 | 35.40 | 190 | 342 | 424 |
| All the variables are expressed in mg L-1 units; TS: total solids; TVS: total volatile solids or total organic matter; n = 188 | ||||||||||
Source: Author’s own elaboration.
According to the data obtained by Can-Chulim et al. (2017) the increase in the ionic concentration reduces the percentage of germination of Phaseolus Vulgaris and NaHCO3 was the salt that caused the lowest percentage of germination, in this sense, a negative effect on the bean crops irrigated with wastewater in the Mezquital Valley is expected.
Regarding the content of organic matter, the remaining residue after calcination does not provide a precise distinction between organic and inorganic residues, given that the loss by calcination is not limited only to organic matter, but also includes losses produced by the decomposition of some mineral salts. It is recommendable to determine the chemical oxygen demand and biochemical oxygen demand in wastewaters (Eaton et al., 1998). This investigation only provides an approximation to the organic matter content by determining the total volatile solids.
Conclusions
According to the results obtained under the conditions in which this investigation was carried out, we concluded that the concentration of nitrate and phosphate in the wastewater of the Mexico City-Mezquital Valley drainage network was high, and this was attributed to the discharges of domestic and industrial wastewaters and to agricultural drainage.
The high concentration of these ions represents a risk, due to the possible gradual eutrophication of the water bodies. There is also a risk of contamination of the aquifers, since over 80 % of the irrigation channels are not revetted, and this may cause the leaching of NO3-.
Regarding the content of nutrients, the following sequence was found, from higher to lower concentration: Ca > Mg > K > N >P. The value of the median, regarding the organic matter content, was 276 mg L-1, and the median for total solids was 1 046 mg L-1, therefore the total salt concentration was 770 mg L-1.
The risk of toxicity by B3+ and Cl- can have a negative effect on the germination and yield of bean crops (to a lesser extent, maize, oat and alfalfa), since it is sensitive to the concentration of these ions found in wastewaters. The use of this water is still restricted, since this study does not consider the microbiological aspects or the heavy metals that can accumulate in the soil and crops. Likewise, it has been proven that the contact of the general population with this water causes public health problems in the agricultural area known as the Mezquital Valley. It is recommendable to perform the wastewater treatment before it is discharged into receptor bodies. Finally, the concepts presented here must be verified experimentally in the soil and crops irrigated with wastewater in this agricultural area.

