


 nova página do texto(beta)
 Inglês (pdf)
 Artigo em XML
 Referências do artigo
 Enviar este artigo por email
 Citado por SciELO
  Similares em
SciELO
Similares em
SciELO 
 Permalink
Introduction
According to OCDE (2005), innovation is: “the implementation of a new or significantly improved product (good or service), or process, a new marketing method, or a new organizational method in business practices, workplace organization or external relations”. Innovation aims at improving a firm’s performance by gaining a competitive advantage. Regarding the marketing innovation: “is the implementation of a new marketing method involving significant changes in product design or packaging, product placement, product promotion or pricing”.
Today, Mexico's competitiveness is ranked as a country in the place 51/138 (WEF, 2017), so that digital marketing is representing a real marketing innovation driver to improve such place. In this sense, the web portal Millones de Voces (2017), reports a sector with more than 200 small and media enterprises (SMEs) firms located at Guadalajara, Mexico, and several recognized institutions that are teaching and training about digital marketing issues. Nowadays the digital marketing has several and innovative tools for: planning and building a website, planning the content, blogging, paying the advertisement, the social networking, emailing, making video, making the web analytics, etc. So, what about the criteria of a digital campaign design to be aligned with the sector competitiveness?
The digital marketing sector is very interested to obtain a proposal of the DMIM capable to improve its competitiveness level based on the NCM. To achieve the proposal model, this work is divided into the explanation of: 1) Problem, hypotheses and rationale of the study; 2) Literature review 3) Methodology based on two visions: the academic and expert about digital marketing innovation and competitiveness to obtain a final DMIM to be related with NCM, and the design of the final questionnaire; 4) Results; 5) Conclusions; 6) Limitations and Future Studies.
Problem, Hypotheses and Rationale of the Study
For digital marketing experts, is a real need to obtain a model able to identify and drive their main variables and indicators of digital marketing in order to increase their level of competitiveness. Due at this moment, there is no evidence of contrast tests between the proposal of Digital Marketing Innovation Model (DMIM) vs. the National Competitiveness Model (NCM) the proposal of research question (RQ), is: Which are the empirical effects of DMIM on NCM?
To solve this, is necessary to propose a construct based on these two factors. Hence, regarding the DMIM variables it is proposed the following specific questions:
SQ1: Which are the variables and the scheme involved?
SQ2: Regarding of these variables, are there differences between the academic vision vs. the expert vision?
SQ3: Which is the final questionnaire?
SQ4: How are the main relationships between NCM and the variables of DMIM?
Finally, the Hypothesis: The most significant DMIM variables are present in at least, on 50% of the variability of NCM.
Literature Review
The National Competitiveness Model (NCM). Competitiveness is the ability and performance of a company, sub-sector or country to sell and supply goods and services in a given market, in relation to the ability and performance of other firms, sub-sectors or countries in the same market (IMCO, 2017; Kotler & Lane, 2006). As a part of the Quality National Prize (Premio Nacional de Calidad) Mexico has designed its own National Competitiveness Model (PNC, 2017) adopted here in this study, with the following variables showed in
Table 1 National Competitiveness Model (NCM).
| Item | Variable | Description |
| 1 | Leadership Transformer (LDT) | Leaders reflect on their behaviours and commitment to achieve the mission of organization, change and innovation; they communicate with their staff, motivate them in their development and overall well-being; they are aware of and they respond to their own growth opportunities. |
| 2 | Customer Value Generation (CVG) | The organization knows its clients intimately, knows what creates its value and responds with innovative proposals that ensure a memorable experience, follow the evolution of their needs and establish the basis for a constant alignment with them |
| 3 | Strategic Planning (STP) | The organization ensures the fulfilment of its vision and mission; analysing their environment, understanding their challenges, setting priorities, defining strategic objectives, aligning their resources and capabilities to ensure their execution, monitoring and evaluating expected results. |
| 4 | Guidance to change, innovation and continuous development (CICD) | The values of the organization lay the foundation for developing a culture focused on change, innovation and continuous improvement that is reflected in the way staff organize and engage to generate new ideas to respond to the challenges they face. |
| 5 | Social Commitment (SCO) | The organization assumes responsibility for the social and environmental environment in which it operates. This commitment is reflected in its initiatives to reduce its environmental footprint, promote the integral well-being of its personnel and respond to the social needs of its community. |
| 6 | Wellness and Inclusion (W&I) | The organization ensures the integration of all its staff through the creation of a shared identity and responding to their physical and emotional needs in the workplace as well as in the communities where they live. |
| 7 | Knowledge (KNW) | The organization collects, organizes, shares and analyses knowledge through the use of its resources and the skills of its staff, thereby generating the intellectual capital of the organization it capitalizes for the improvement and innovation of its products, services and processes. |
| 8 | Agility (AGY) | The organization responds quickly, adaptively and flexibly to the changes that occur in its internal and external environment. |
Source: PNC (2017), by own adaptation.
Digital Marketing Innovation. The competitiveness recognizes the potential of the innovation which is defined as a: “implementation of a new or significantly improved product (good or service), or process, a new marketing method, or a new organisational method in business practices, workplace organisation or external relations and it involves the innovation of: product, service, marketing, process and organization” (OCDE, 2015). In this sense, digital marketing is in itself, an innovation; due, the importance to get the DMIM, is concluded a definition in this research: “as a process to design the strategy and tactics in a planned implementation, selecting a set of digital marketing tools. These should be based on mission-vision, the market segmentation, goal settings and value proposition of the firm, with the performance monitoring and the profitability of the digital campaign design, in a permanent way” (Mejía-Trejo, 2017, Mejía-Trejo et al. 2016; Kannan. & Hongshuang, ,2017; SmartInsights, 2017; Scuotto, Del Giudice & Carayannis, 2016; Egol, Peterson, & Stefan S.,2014; Kharchuk, Kendzor & Petryshyn, 2014). It is highlighted that throughout 2016, the sector analyzed variables, constructs and models of digital marketing, that were considered impractical and / or difficult to implement and measure, to increase its competitiveness. Therefore, the cornerstone of this research is to determine the variables and indicators involved into the DMIM, through the most recent documents based on 15 papers about this regard, concluding the Table 2.
Table 2 Searching the DMIM underlying factor.
| No. | Year | Authors (Year) | Definition of Digital Marketing | Main Digital Marketing Variables approaching |
| 1 | 2017 | Mejía-Trejo | “…as a process to design the strategy and tactics in a planned implementation, selecting a set of digital marketing tools. These should be based on mission and value proposition of the firm, with the performance monitoring and the profitability of the digital campaign design, in a permanent way...” | Planning (PLN); Market (MKT);Strategy (STG); Goal Settings (GST); Tactics (TAC); Mission & Vision (MVS);Digital Marketing Tools (DMT); Value Proposition (VAL); Performance (PER); Profitability (PRO) |
| 2 | 2016 | Mejía-Trejo et al. | “…is a function of Web Strategy, Web Technology, Web Integration and Web Experience.” | Web Strategy = Strategy (STG); Web Technology= Digital Marketing Tools (DMT); Web Integration (WBI); Web Experience (WBE) |
| 3 | 2017 | Kanang & Hongshuang | “…an adaptive, technology-enabled process by which firms collaborate with customers and partners to jointly create, communicate, deliver, and sustain value for all stakeholders.” | Market (MKT); Strategy (STG); Value (VAL) Digital Marketing Tools (DMT); Profitability (PRO) |
| 4 | 2017 | SmartInsi-ghts | “…is a function of Planning, Reach, Act, Convert and Engage.” | Mission & Vision(MVS) Planning (PLN); Value Proposition (VAL); Goal Settings (GST); Market (MKT); Reach or awareness as a Tactics (TAC); Act or leads &sales as a Tactics (TAC) Engagement or retention customer for repetitive visits as a Tactics (TAC) |
| 5 | 2016 | Scuotto et al. | “…is a social networking sites as marketing tools …or on how these channels increase marketing communication effectiveness …” | Performance (PER) |
| 6 | 2014 | Egol et al. | “…can offer detailed data on and analysis of consumer behavior, as well as precise results about a marketing program’s effectiveness, with a degree of detail and precision that previous generations of CMOs could hardly fathom.” | Digital Branders as a Strategy (STG); Customer Experience Designers as a Strategy (STG); Demand Generators as a Strategy (STG); Product Innovators as a Strategy (STG) |
| 7 | 2014 | Kharchuk et al. | “…has the marketing strategy… to conduct market analyze, segment the market, develop marketing approach, right product portfolio and finally marketing plan… Digital marketing begins from E-communication marketing strategies and ends with the usage of digital strategies orientated on customer online buying services, such as mobile marketing or smart finance.” | Market (MKT); Strategy (STG); Value Proposition (VAL); Environmental Conditions (ENV); Organizational Innovation (OGI); Organizational Performance (OPR) |
| 8 | 2014 | Stokes | “…drives the creation of demand using the power of the Internet, and satisfies this demand in new and innovative ways. The Internet is an interactive medium. It allows for the exchange of currency, but more than that, it allows for the exchange of value.” | Value Proposition (VAL) Strategy (STG); |
| 9 | 2015 | Marketo | “…is the endorsement of goods, services, and company brands through online media channels.” | Digital Marketing Tools (DMT) |
| 10 | 2015 | Boelsen-Robinson et al. | “…is the process of using new media to engage in promotional activities, and includes strategies such as the use of advergames, child-designated areas on websites and viral marketing.” | Branding. Products, Selling Points as a Strategy (STG); Connectivity as a Digital Marketing Tools (DMT) Message as a Value Proposition (VAL) |
| 11 | 2017 | Brindle | “...the traditional split between offline and online marketing no longer stands, and they are no longer classed as separate, segmented activities, but must be integrated in order to deliver the optimum experience to the end user.” | Market (MKT) Digital Marketing Tools (DMT) |
| 12 | 2017 | Martin | “...the definition has rapidly expanded beyond websites and email to social, immersive experiences, and mobile. Now, digital marketing can be anything from an online banner ad to a sponsored Instagram post to long-form content marketing to augmented reality.” | Conversion as a Strategy (STG); Digital Marketing Tools DMT);Performance (PER); Profitability (PRO) |
| 13 | 2015 | Hase Solutions | “…is a function of mission, vision, goal settings, performance, tools, ROI, and strategy.” | Mission & Vision (MVS) Goal Settings (GST) Performance (PER); Digital Marketing Tools (DMT); Profitability (PRO); Strategy (STG) |
| 14 | 2013 | WSI | “...is a huge step forward for the marketing industry, many business owners are in such a rush to get online that they fail to develop a proper strategy for the move into the digital space.” | Digital Marketing Tools (DMT); Tactics (TAC); Strategy (STG); Performance (PER) |
| 15 | 2012 | Smith | “…is a tool can help small firms to compete on more equal terms with larger rivals on marketing.” | Strategies (STG); |
Source: Own.
The Table 2 shows in different columns, the number, year of publication (since 2012 until 2017), author, a main definition of Digital Marketing and several variables that support each work, in order to identify them and make an analysis about how many times they are mentioned (see Table 3). Therefore, it was obtained an approach of the academic vision, to be submitted to the experts.
Table 3 DMIM Variables as an academic vision approach.
|
DMIM Variables |
Number of Author (according Table 2) | |||||||||||||||
| 1 | 2 | 3 | 4 | 5 | 6 | 7 | 8 | 9 | 10 | 11 | 12 | 13 | 14 | 15 | TOTAL | |
| PLN | X | X | 2 | |||||||||||||
| MKT | X | X | X | X | X | 5 | ||||||||||
| GST | X | X | X | 3 | ||||||||||||
| STG | X | X | X | X | X | X | X | X | X | X | X | 11 | ||||
| TAC | X | X | X | 3 | ||||||||||||
| MVS | X | X | X | 3 | ||||||||||||
| VAL | X | X | X | X | X | X | 6 | |||||||||
| PER | X | X | X | X | X | 5 | ||||||||||
| PRO | X | X | X | X | 4 | |||||||||||
| DMT | X | X | X | X | X | X | X | X | X | 9 | ||||||
| WBI | X | 1 | ||||||||||||||
| WBE | X | 1 | ||||||||||||||
| ENV | X | 1 | ||||||||||||||
| OGI | X | 1 | ||||||||||||||
| OPR | X | 1 | ||||||||||||||
| TOTAL | 56 | |||||||||||||||
Note: Planning (PLN); Market (MKT); Goal settings (GST); Strategy (STG);Tactics (TAC); Mission-Vision (MVS); Value Proposition (VAL); Performance (PER); Profitability (PRO); Digital Marketing Tools (DMT); Web Integration (WBI); Web Experience (WBE); Environmental Conditions (ENV); Organizational Innovation (OGI); Organizational Performance (OPR).
Source: Own.
Methodology
As a result of the literature review, it was made a matrix to show the DMIM variables according Table 2, and representing the academic vision approach. See Table 3.
After this, it was applied the qualitative part of this research through focus group with Delphi Panel and Analytic Hierarchy Process (AHP, Saaty, 1997) to 10 specialists (5 professors and 5 CEO) as digital marketing campaign designers, focusing the attention and experience of each one of them, in the association of variables and the order suggested to be implemented to the DMIM. The results are showed in Table 4.
Table 4 Focus Group using Delphi Panel and AHP to determine the main variables of DMIM underlying factor.
| Objective | DIGITAL MARKETING INNOVATION MODEL | |||||||
| ID | Variable as academic vision (from Table 3) | Variable as academic vision (5 professors) | Variable as expert vision (5 CEOs) | %Difference (academic vision- expert vision) | ||||
| Frequency (from Table 3) | AHP Weighing (%) importance | Order suggested to be implemented | AHP Weighing (%) importance | |||||
| Alternatives | 1 | PLN | 2 | 3.6 | 8 | 9.9 | -6.3 | |
| 2 | MKT | 5 | 8.9 | 3 | 9.8 | -0.9 | ||
| 3 | GST | 3 | 5.4 | 4 | 9.9 | -4.5 | ||
| 4 | STG | 11 | 19.6 | 5 | 9.7 | 9.9 | ||
| 5 | TAC | 3 | 5.4 | 6 | 5.8 | -0.4 | ||
| 6 | MVS | 3 | 5.4 | 1 | 4.7 | 0.7 | ||
| 7 | VAL | 6 | 10.7 | 2 | 4.8 | 5.9 | ||
| 8 | PER | 5 | 8.9 | 9 | 8.9 | 0.0 | ||
| 9 | PRO | 4 | 16.1 | 10 | 4.9 | 11.2 | ||
| 10 | DMT | 9 | 7.1 | 7 | 6.8 | 0.3 | ||
| 11 | WBI | 1 | 1.8 | - | 4.8 | -3.0 | ||
| 12 | WBE | 1 | 1.8 | - | 5 | -3.2 | ||
| 13 | ENV | 1 | 1.8 | - | 5 | -3.2 | ||
| 14 | OGI | 1 | 1.8 | - | 5 | -3.2 | ||
| 15 | OPR | 1 | 1.8 | - | 5 | -3.2 | ||
| TOTAL | 56 | 100 | 100 | |||||
Source: Own.
The Table 4 is divided in 3 parts. The first one, shows the a list of 15 ordered variables in importance as a result of the Delphi panel focus group with 5 professors in digital marketing. The column frequency is based on how many of these variables were mentioned by different analyzed authors (see Table 3). Thereby, it was reported the importance of each one of the variables suggested for the same group of professors as a result of the Analytic Hierarchy Process (AHP) as an academic vision. The second one, is based on the perception of 5 CEOs of digital marketing firms, whom ordered the same list of variables as a suggestion for implementation; it was reported the importance of each one of the variables suggested for the same group of CEOs as a result of the Analytic Hierarchy Process (AHP) as an expert vision. Finally, it was reported the % weighing difference between both visions (where less than 2% were excluded for practical reasons) where the sign (-/+) indicates what side is describing and explaining more about the variable. For instance, the variable strategy (STG) for academic vision has a rate of 19.6% vs. 9.7% as an expert vision; the % difference is +9.9; hence the academic vision is the side that is explaining more of this variable (or, the expert vision, needs to consider more about that). Therefore, there were explained each of these variables to determine the general conceptual model of DMIM in the order suggested to be implemented, as follows. See Table 5.
Table 5 DMIM variables description.
| Order Suggested (see Table 4) | DMIM Variables | Indicator | Main question | Authors |
| 1 | Mission-Vision (MVS) | Mission. It is a written declaration of an organization's core purpose and focus that normally remains unchanged over time. It is the cause of the firm’s campaign, day-to-day operational objectives Vision. It is the effect of the firm’s campaign. It express’ the high-level goals for the future | Which is the mission and vision involved in the digital campaign? | Mejía-Trejo,2017; SmartInsights, 2017; Hase Solutions, 2015 |
| 2 | Value Propositi-on (VAL) | It is the reason why customers turn to one company over another solving their problems or satisfying their needs. It consists of a selected bundle of products and/or services that caters to the requirements of a specific Customer Segment. In this sense, is an aggregation, or bundle, of benefits that a company others customers. | What is the value proposition inserted in the digital campaign? | Mejía-Trejo, 2017; Kanang & Hongshuang,2017; SmartInsights, 2017; Kharchuk et al.,2014; Stokes, 2014; Boelsen-Robinson et al., 2014 |
| 3 | Market (MKT) | It is all about of the market segmentation as target. It comprises the heart of any business model. Without (profitable) market, no company can survive for long. In order to better satisfy the market, a company may group them into distinct segments with common needs, common behaviors, or other attributes. | Which is the main market to be attended for the digital campaign? | Mejía-Trejo 2017; SmartInsights, 2017; Kanang & Hongshuang, 2017; Kharchuk et al. 2014; Brindle 2017. |
| 4 | Goal Settings (GST) | All digital marketing campaign requires objectives to be reached, for instance: -The branding positioning;-The number (real & potential) of customers database; -The sales; -The product & services (current and new ones) information | Which goals should we use for the digital campaign? | Mejía-Trejo,2017; SmartInsights, 2017; Hase Solutions 2015 |
| 5 | Strategy (STG) | This stage represents the how to do, to achieve the GST, just like:
|
How to do, to achieve the goal settings for the digital campaign? | Mejía-Trejo, 2017 y 2016; Kanang & Hongshuang, 2017; Egol et al., 2014; Kharchuk et al.,2014; Stokes, 2014; Boelsen-Robinson et al., 2014; Martin, 2017; Hase Solutions, 2015; WSI,2013; Smith,2012 |
| 6 | Tactics (TAC) | This represents all the activities to be implemented to follow the
strategies, involving mainly, the use of the digital marketing
tools (DMT), for instance: 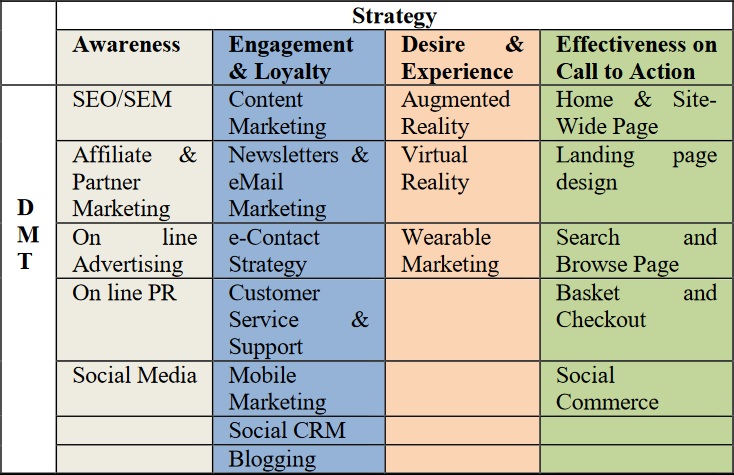
|
What activities must to implement the DMT we need to do for the digital campaign? | Mejía-trejo,2017; Smartinsights, 2017; wsi,2013 |
| 7 | Digital Market-ing Tools (DMT) | It involves all the digital marketing tools, like: Search Engine Optimisation (SEO); Search Engine Marketing (SEM); Affiliate and Partner Marketing; Online advertising; Online Public Relations; Social Media Marketing; Home & Site-Wide Page Effectiveness; Landing Page Design Effectiveness; Search and Browse Page Efficiencies; Category and Product Page Efficiencies; Basket and Checkout Efficiency; Social Commerce; Content Marketing; Newsletters; eMail marketing; e-Contact Strategy; Customer and Service Support; Mobile Marketing; Augmented Reality; Virtual Reality; Wearable Marketing; Social CRM, etc. | What kind of digital marketing tools are we ready to use in the digital campaign? | Mejía-Trejo, 2017 y 2016; Kanang & Hongshuang, 2017; Marketo, 2015; Boelsen-Robinson et al.,2015; Brindle, 2017; Martin, 2017; Hase Solutions, 2015; WSI, 2013 |
| 8 | Planning (PLN) | This is the step where all the tools and techniques of the tactics is programmed logistically, to be implemented in the practice. This is your overall strategy for digital marketing. Defining a strategy to integrate communications across different customer touchpoints is often forgotten. Planning involves setting goals, creating a coherent strategy to achieve them and putting in place evaluation tools in place to make sure you’re on track | What about the schedule and times to implement the digital marketing tools, for obtaining results in the digital campaign? | Mejía-Trejo,2017; SmartInsights, 2017 |
| 9 | Perfor-mance (PER) | It implies to know how well the digital campaign is working on. Practically, it involves the measurement and assessment of all the previous stages, Its support is the web analytics to obtain a full control of the digital campaign | Which is the performance of the digital campaign? | Mejía-Trejo, 2017; Scuotto et al. 2016; Martin, 2017; Hase Solutions, 2015; WSI, 2013 |
| 10 | Profita-bility (PRO) | It is expressed in terms of return on investment (ROI) about how the digital campaign is working on, at short, medium or long terms. | What is the return of investment for the digital campaign? | Mejía-Trejo, 2017; Kanang & Hongshuang, 2017; Martin, 2017; Hase Solutions, 2015 |
Source: Own.
Results
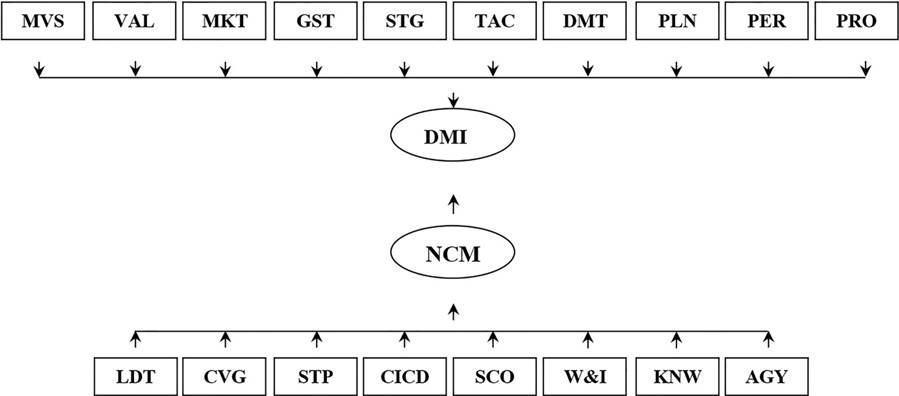
Therefore, the final DMIM-NCM ex ante, is showed in Figure 1.
The final questionnaire proposed (shown in the Appendix) containing the NCM variables and DMIM variables, was applied as a pilot with 10 specialist in digital marketing campaign designers, located at Guadalajara, Mexico, to probe the confidence test. It was obtained the Table 6.
Table 6 Cronbach’s Alpha Test.
| Cronbach’s Alpha | N of Variables |
| .804 | 11 |
Source: SPSS 20 as a result of the research and adapted by the author.
The final questionnaire (8 variables corresponding to NCM as dependent factor and 10 variables corresponding to DMIM as an independent factor) as a survey, was applied to 200 specialists (100 professor and 100 CEOs) as digital marketing campaign designers, located at Guadalajara, Mexico, during January to April 2017. It was also obtained the Pearson’s Correlations amongst the variables, showed at Table 7.
Table 7 Pearson’s correlations.
| NCM | MVS | VAL | MKT | GST | STG | TAC | DMT | PLN | PER | PRO | |
| NCM | 1 | .492** | .195** | 0.051 | -0.07 | 0.096 | .195** | .714** | 0.059 | -0.061 | .195** |
| MVS | .492** | 1 | .269** | .204** | -0.04 | .183** | .269** | .218** | .185** | -0.085 | .269** |
| VAL | .195** | .269** | 1 | .540** | 0.032 | .630** | 1.000** | .762** | .726** | -.282** | 1.000** |
| MKT | 0.051 | .204** | .540** | 1 | .419** | .773** | .540** | .424** | .315** | -0.06 | .540** |
| GST | -0.074 | -0.04 | 0.032 | .419** | 1 | .513** | 0.032 | 0.046 | -0.003 | .470** | 0.032 |
| STG | 0.096 | .183** | .630** | .773** | .513** | 1 | .630** | .475** | .425** | -0.055 | .630** |
| TAC | .195** | .269** | 1.000** | .540** | 0.032 | .630** | 1 | .762** | .726** | -.282** | 1.000** |
| DMT | .714** | .218** | .762** | .424** | 0.046 | .475** | .762** | 1 | .661** | -.193** | .762** |
| PLN | 0.059 | .185** | .726** | .315** | -0 | .425** | .726** | .661** | 1 | -.218** | .726** |
| PER | -0.061 | -0.09 | -.282** | -0.06 | .470** | -0.06 | -.282** | -.193** | -.218** | 1 | -.282** |
| PRO | .195** | .269** | 1.000** | .540** | 0.032 | .630** | 1.000** | .762** | .726** | -.282** | 1 |
**. The correlation has significance of 0.01 (bilateral).
Source: SPSS 20 as a result of the research and adapted by the author.
It was practiced Multiple Regression Analysis by Stepwise Method to obtain the set of variables entered/removed (a) (see Table 8).
Table 8 Variables entered/removed.
| Model | Variables Entered | Variables Removed | Method Stepwise |
| 1 | DMT | Criteria: Probability of- F-to-enter<= .050, Probability of- F-to-remove >=.100 | |
| 2 | MVS |
(a) Dependent Variable: NCM.
Source: SPSS 20 as a result of the research and adapted by authors.
The Model Summary is showed at Table 9.
Table 9 Model Summary.
| Model | R | R Square | Adjusted R Square | Std. Error for estimate |
| 1 | .714 (a) | .510 | .389 | 1.88 |
| 2 | .811 (b) | .657 | .594 | .90 |
(a) Predictors: (Constant), DMT.
(b) Predictors: (Constant), DMT, MVS.
Source: SPSS 20 as a result of the research.
Using the Stepwise method SPSS produces an Analysis of Variance (ANOVA) for each model showed at Table 10.
Table 10 ANOVA (a).
| Model | Sum of Squares | Df | Mean Square | F | Sig. |
| 1 Regression | 714.120 | 1 | 714.120 | 10.367 | .001(b) |
| Residual | 685.88 | 198 | 3.464 | ||
| Total | 1400.000 | 199 | |||
| 2 Regression | 919.800 | 2 | 459.9 | 7.561 | |
| Residual | 480.200 | 197 | 2.437 | .001(c) | |
| Total | 1400.000 | 199 |
(a) Dependent Variable: NCM.
(b) Predictors: (Constant), DMT.
(c) Predictors: (Constant), DMT, MVS.
Source: SPSS 20 as a result of the research.
The Table 11 shows the results of Coefficients.
Table 11 Coefficients by stepwise method (a).
| Model | Unstandardized Coefficients | Standardized Coefficients | t. | Sig. | |
| B | Std. Error | Beta | |||
| 1 (Constant) | 5.237 | .306 | 17.120 | .000 | |
| DMT | .140 | .043 | .714 | 3.220 | .001 |
| 2 (Constant) | 1.250 | .402 | 11.635 | .000 | |
| DMT | .388 | .044 | .190 | 2.706 | .007 |
| MVS | .232 | .055 | .150 | 2.137 | .034 |
(a) Dependent Variable: NCM.
Source: SPSS 20 as a result of the research.
Table 12 shows the Excluded Variables.
Table 12 Excluded Variables (a).
| Model | Beta in | t | Sig. | Partial Correlation | Collinearity | |
| Tolerance | ||||||
| 1 | MVS | .150(b) | 2.137 | .034 | .151 | .953 |
| VAL | .059(b(b) | .548 | .585 | .039 | .420 | |
| MKT | -.053(b) | -.687 | .493 | -.049 | .820 | |
| GST | -.085(b) | -1.221 | .223 | -.087 | .998 | |
| STG | -.012(b) | -.154 | .878 | -.011 | .775 | |
| TAC | .059(b) | .548 | .585 | .039 | .420 | |
| PLN | -.156(b) | -1.703 | .090 | -.120 | .563 | |
| PER | -.019(b) | -.270 | .787 | -.019 | .963 | |
| PRO | .059(b) | .548 | .585 | .039 | .420 | |
| 2 | VAL | .022(c) | .206 | .837 | .015 | .409 |
| MKT | -.074(c) | -.972 | .332 | -.069 | .807 | |
| GST | -.077(c) | -1.122 | .263 | -.080 | .995 | |
| STG | -.028(c) | -.355 | .723 | -.025 | .768 | |
| TAC | .022(c) | .206 | .837 | .015 | .409 | |
| PLN | -.168(c) | -1.843 | .067 | -.131 | .562 | |
| PER | -.012(c) | -.176 | .860 | -.013 | .961 | |
| PRO | .022(c) | .206 | .837 | .015 | .409 | |
(a) Dependent Variable: NCM.
(b) Predictors: (Constant), DMT.
(c) Predictors: (Constant), DMT, MVS.
Source: SPSS 20 as a result of the research.
Analyses and discussion
About Table 6 and according by Hinton (et al. 2004), Cronbach’s alpha corresponds: 0.70 to 0.90 shows high reliability.
Regarding the Table 7, as a general rule, predictor variables can be correlated with each other as much as 0.8 before there is cause for concern about multicollinearity (Hinton, et al. 2004; Hair et al., 2010).
Regarding the Table 8, the Variables Entered/Removed table shows that the Stepwise method of regression has been used. Notice that SPSS has entered into the regression equation three variables: DMT, and MVS that are significantly correlated with NCM.
About Table 9 shows the Models: 1 and 2 where the independent variables DMT and MVS accounts for 51 %, and 65% respectively of the variance in the scores of NCM dependent variable. The R value (0.223) in Model 1 is the multiple correlation coefficients between the predictor variables and the dependent variable. As DMT is the only independent variable in this model the R value is the same value as the Pearson’s correlation coefficient in the pairwise correlation matrix (See Table 7). In Model 2 the independent variables DMT and MVS are entered, generating a multiple correlation coefficient, R =.267. The Adjusted R Square adjusts for a bias in R square and is usually used. The Std. Error of the Estimate is a measure of the variability of the multiple correlation.
Regarding the Table 10, indicates Model 1: F (1,198) = 10.367, p<0.01; Model 2: F (2,197) = 7.561, p<0.01; Dividing the Sums of Squares by the degrees of freedom (df) gives us the Mean Square or variance. The Regression explains significantly more variance than the error or Residual. R square is calculated (Table 9) dividing the Regression Sum of Squares by the Total Sum of Squares. The values for Model 1 have been used as an example: 714.120/1400.00= 0.510 (see Table 10).
In Table 11 the Unstandardized Coefficients B column gives us the coefficients of the independent variables in the regression equation for each model:
-Model 1: NCM =5.237 + .140 DMT;
-Model 2: NCM = 1.250+ .388 DMT+ .232 MVS.
The Standardized Beta Coefficient column informs us of the contribution that an individual variable makes to the model. The beta weight is the average amount the dependent variable increases when the independent variable increases by one standard deviation (all other independent variables are held constant). As these are standardized it is possible to compare them. The tests are performed to test the two-tailed hypothesis that the beta value is significantly higher or lower than zero. This also enables us to see which predictors are significant. By observing the Sig. values in the research for Model 1 the NCM scores are significant (p < 0.05), and so on with Model 2. Hence, it is suggested to use Model 2 because it accounts for more of the variance (see Table 11). The Unstandardized Coefficients Std. Error column provides an estimate of the variability of the coefficient.
Regarding the Table 12, The Beta In value gives an estimate of the beta weight if it was included in the model at this time. The results of t tests for each independent variable are detailed with their probability values. From Model 1 the t value for DMT is significant (p < 0.05). However with the use of the Stepwise method this variable has been excluded from the model. As MVS has been included in Model 2 it has been removed from this table. As the variable NCM scores is present in both models it is not mentioned in the Excluded Variables table. The Partial Correlation value indicates the contribution that the excluded predictor would make if it is decided to include it in the model. Collinearity Statistics Tolerance values check for any collinearity in the data. As a general rule, a tolerance value below 0.1 indicates a serious problem (Hinton, et. al, 2004).
Conclusions
The conclusions are:
1. - Regarding the SQ1: Which are the variables and the scheme involved?
About the variables are discussed and described using the Table 1 for NCM and Tables 2, 3, 4 and 5 for DMIM involving for the two models: firstly, the use of the National Competitiveness Model (NCM) underlying factor based on 8 variables: Leadership Transformer (LDT); Customer Value Generation (CVG); Strategic Planning (STP); Guidance to change, innovation and continuous development (CICD); Social Commitment (SCO); Wellness and Inclusion (W&I); Knowledge (KNW); Agility (AGY) and secondly, the proposal of Digital Marketing Innovation (DMIM) with underlying factors based on 10 variables: Planning (PLN); Market (MKT); Goal settings (GST); Strategy (STG); Tactics (TAC); Mission-Vision (MVS); Value Proposition (VAL); Performance (PER); Profitability (PRO) and Digital Marketing Tools (DMT). A final construct between NCM-DMIM is conformed with 18 indicators (8 from NCM and 10 from DMIM).
2. - About SQ2: Regarding of these variables, are there differences between the academic vision vs. the expert vision?
This issue is solved since Table 4. As a conceptual evidence, there are important issues to consider as a result of the comparison of academic vision vs. expert vision. For instance, the Strategy (STG) is cited as 19.6 % importance of academic vision vs, 9.7% of expert vision (9.9 as % difference amongst them). Revising the case of Profitability (PRO) with 16.1% importance of academic version vs. 4.9% importance of expert vision (11.2 as % difference amongst them). Other similar case is the variable Value Proposition (VAL) with 10.7% importance of academic version vs. 4.8% importance of expert vision (5.9 as % difference amongst them). These are the first insights about the three main variables with higher academic rates vs expert rates which mean a lack, to be developed as an opportunity to the expert vision in the final DMIM.
By other side, it was obtained the higher expert differences (more than -2) with the academic vision as: Planning (PLN) with -6.3 and Goal Settings (GST) with -4.5. These are the first insights about the two main variables with higher expert rates vs. academic rates which mean a lack, to be developed as an opportunity to the academic vision in the final DMIM.
Also, it is important to consider the order of how is treated each one of the DMIM variables, suggested by the expert vision showed in Table 4.
3. - Regarding the SQ3: Which is the final questionnaire?
It was designed and concluded in detail. Please see the Appendix
4. - Regarding the SQ4: How are the main relationships between NCM and the variables of DMIM?
This issue is solved since Table 7, where the higher correlations (more than .3), as: NCM-MVS (.492) and NCM-DMT (.714). These variables are an empirical evidence, that only the mission and vision (MVS) and the digital marketing tools (DMT), are considered and used by the specialists in digital marketing campaign design, with main incidence on NCM;
5. - The hypothesis: The most significant DMIM variables are present in at least, on 50% of the variability of NCM.
This issue is solved using Tables 8 and 9 where the partial variability was at least, of 51% corresponding to DMT (Digital Marketing Tools) variable. So, it was accepted the Hypothesis.
6. - Finally, about the research question (RQ): Which are the empirical effects of DMIM on NCM?
The main empirical effects are how the Digital Marketing Tools (DMT) and Mission-Vision (MVS) are impacting on National Competitiveness Model (NCM), representing both the 65.7% of the variability (according Table 9). The rest (8) of the DMIM variables are remaining with scarce use and they are representing a great opportunity to be developed in any digital campaign design.
The main conceptual effects are from point of view of both, academics and experts about:
-How to make more practicable, the variables Strategy (STG), Profitability (Pro) and Value Proposition (VAL) to be used by the expert vision.
- How to make more definitions of the variables Planning (PLN) and Goal Settings (GST) from the academic vision, to be more practicable to the expert vision.
-How to consider an order to be affordable the DMIM variables.
The final questionnaire is a first insight to achieve a final model to relate the DMIM-NCM.
The final practical implications of this research, are basically:
1.- A digital management innovation model (DMIM) able to identify the main variables to be adjusted and implemented for the firms in the sector, to increase their competitiveness, according the actual National Competitiveness Model (NMC) of México.
2.- The academic and expert visions, about the DMIM variables where exist differences to be considered since order of importance until implementation.
3.- Several suggestions of the variables of this model, capable to improve their relationship to be more competitive.
Limitations and Future Studies
The first limitation. The final questionnaire was applied to professors (academic vision) and directors or CEOs (expert vision), and the results could be different with operative managers, customers and/or suppliers to analyze the results obtained.
The second limitation. The location of the survey was only the Guadalajara city. For future studies, it is important to consider other regions of Mexico. Additionally, the sampled companies, for the CEO as specialist of digital marketing campaign designers were from 20 to 250 workers, excluding the companies from 1 to 10 workers, which represent an important quantity of the total manufacturing SMEs. For future studies it could be interesting to involve suppliers and customers into the DMIM-NCM construct.
The third limitation is about the model of competitiveness. This could be designed with other variables involving other sources just like the Competitiveness Mexican Institute (IMCO, Instituto Mexicano de la Competitividad), or the SME Competitiveness Index (SMECO, 2017), or more sophisticated model based on the use of internet technologies.
About future studies, it would be interesting to do studies considering the DMIM as dependent variable to determine and analyze the variables more significant from the NCM.
It is very important to the sector of digital marketing practitioners to do strategic planning to develop the rest of the DMI model.
Finally, it would be interesting to do an exploratory factor analysis, to reduce the original variables into NCM and DMIM construct, and a confirmatory factor analysis to search underlying relationships among the NCM and DMIM variables through structural equations analysis, using techniques based on license software, such as: EQS, LISREL and AMOS.

