Introduction
The plastics industry has grown 9% worldwide since 1950, from 1.5 million tons in that year to 288 million in 2012. International production has grown by more than 500%. In the past 30 years alone, international plastics production has grown by more than 500%. Worldwide demand for plastics is forecasted to increase by 3.7% annually from 2012-2017. Current projections from a research study by Plastics Europe establish that the demand for plastic will rise to nearly 290 million tons in 2017 (Görlitz and MacDougall, 2013).
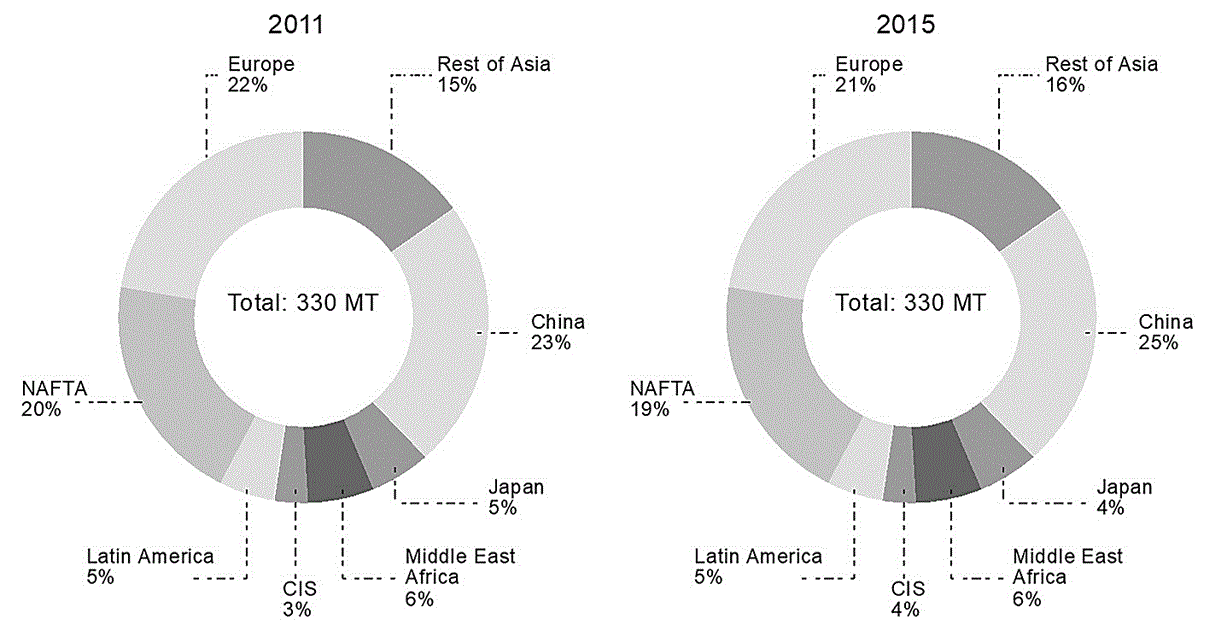
The same document establishes that the worldwide demand for plastics will grow by 5% in 2015 as a result of global megatrends, including urbanization, energy demand, climate change, and new technological developments. The different megatrends of leading and growth are closely linked to the industry in sectors such as construction, energy efficiency, and housing, areas in which plastics are playing an evergreater role. The graph in Fig. 1 presents the global consumption of plastic from 2011 to 2015.
Moreover, from an economic perspective, according to the National Institute of Statistic and Geography (INEGI, 2015), Mexico grew by 2.5% in 2015, higher than the 2.1% recorded in 2014. This percentage is within the range determined by the Treasury as 2 to 2.8%. In the fourth trimester, the Gross Domestic Product (GDP) increased by 0.6%. The primary sector had a setback of 1.7%, the secondary sector showed no change, and the activities of the tertiary sectors achieved an increase of 0.9% (Bojali, 2011).
The manufacturing industry is an important part of Mexico, as it is closely linked to business from many countries with a wide variety of activities, including automotive, aerospace, food, medicine, and technology, among others. Their growth and value have been achieved through well-trained manpower, productivity, and low costs in comparison to other countries.
According to Paredes (2015), macroeconomic indicators will establish a growth of 3.6% and the inertia of the North American market will grow by 1.4%, public investment will be reduced in 0.7 %, while election spending will represent 3.0%, which will total among the different organizations a 3.3% associated with manufacturing and the construction sector in Mexico. In terms of inflation, Mexico will be below 3% as a result of the lack of new state taxes.
Likewise, according to INEGI (2015), Mexico has more than 6,000 companies in the area of export-oriented manufacturing; 100 of these companies export 51% of the total merchandise. There are opportunities in the country due to its abundance of raw materials, which are mostly untapped by Mexicans, and the majority are exported for process in other countries with the capacity to invest in machinery, or by foreign companies that settle in Mexico and create employment.
The plastics company comprises two sectors: petrochemical through the production of resins and additives, and manufacturing, which transforms plastic into products. The resin manufacturer is part of the final link in one of the production chains of petrochemicals. Synthetic resins and chemical fibers represent 48% of the inputs used by the plastics industry. In 2015, nationwide production generated 3 billion 838 million pesos (ProMéxico, 2014).
The state of Sonora has only 18 companies dedicated to the manufacturing of plastic containers which are advertised on the Internet, which shows the enormous area of opportunity of this business-just in Cd. Obregón alone, two of them advertise through their web pages, and the majority are located in Hermosillo, Sonora (Infoisinfo, 2016).
The company under study is categorized as a microenterprise, as it has four workers and one supervisor. However, it is at an advantage, as in the southern region of the state where it hopes to position itself, competition is minimum; nevertheless, their suppliers are located at some distance, which is a disadvantage because raw material delivery is not immediate.
Numerous studies indicate that the industry sector is highly regarded for the economic development of the country in terms of job creation, the interest of investors and consequently, economic growth. Its development is very valuable for raising the levels of technology and innovation (Millán and Millán, 2011).
The competition of Small and Medium Enterprises requires systems to evaluate the behavior of the elements in their supply chain. These types of evaluations allow measuring the gaps in the performance indicators that should be monitored depending on the established strategy. The information contained in the document Micro, Small, and Medium Enterprises: Definitions and International Statistics (INEGI, 2011) shows that microenterprises constitute nearly 95% of existing organizations, which represents 60% of the workforce. This has led to international interest not only in this sector, but also in small enterprises, prompting the different nations to prepare strategic plans for their development. On the other hand, studies show that planning is an aspect in which small businesses still need to work. In Cajeme, there is the problem of a lack of planning for the performance evaluation; however, the businesses there have been able to remain in the market despite this situation (Landazuri et al., 2013).
The supply chain considers the integration of the main functions of the business up to the final user, through suppliers who offer products, services, and information that add value for the customer and other stakeholders. In addition, it encompasses the processes of the company, the people, the organization, the technology, and the infrastructure, allowing the transformation of raw material into finished products and services, as well as the delivery of same in order to fulfill the specifications of the customer (Ballou, 2004). Under the same approach, the supply chain can be defined as the systematic and strategic coordination of the traditional functions of a business through the business function inside a particular company, and through the companies that participate in the supply chain with the purpose of improving the long-term performance of the individual companies and the logistics in the supply chain as a whole.
Logistics is the part of the supply chain that efficiently and effectively plans, carries out, and controls the flow and warehousing of the assets and services, as well as the related information, from the point of origin to the point of consumption, with the goal of satisfying customer requirements. It is possible to see logistics as that which is in charge of uniting production and market through techniques and strategies. Logistics is the art of planning and coordinating all activities and processes necessary for a product or service to be generated and reach the customer at the required time and place, optimizing the cost (Ballou, 2014; Crone, s/f).
In the commercial sector, logistics is addressed within the perspective of business, being oriented toward the transportation and distribution of consumables. This includes activities such as the flow of non-repairable materials, shipping and handling, distribution, warehousing, and sales. One of its objectives consists of developing and managing the entire flow of materials, from initial supply (identification of raw materials) to production, warehousing, and final distribution of products intended for consumption (Aracil and Gordillo, 1997).
As the warehouse is one of the elements that appears in every link of the supply chain, it must be carefully checked. From this perspective, warehousing is defined as the places where different types of merchandise are stored and managed through an inventory policy. This function physically controls and maintains all inventoried articles. In addition, warehousing implies the selection of place, dimension, and characteristics of refrigeration or automation of the warehouse where the products are stored, for example (Sandoval and Moreno, 2011).
Performance evaluation of the supply chain must be monitored through the key performance indicators. In this sense, methodologies such as system dynamics represent an opportunity to develop causal relationships between variables and parameters that may translate to certain indicators, but from the perspective of the whole supply chain, where it can be seen that the effect of an indicator on the chain will affect (positively or negatively) the rest of the links.
The development of models and the use of methodologies to adequately represent and define the behavior of the supply chain are widely used in diverse studies. The review of the literature to substantiate the proposal set forth in this article is based on definitions by important authors, on the one hand. Taha (2014) defines a model as the representation of reality graphically, abstractly, and mathematically, and is of vital importance in processes and phenomena that aim to present, detail, study, and analyze them. As a complement, from the perspective of the system dynamics methodology, (Aracil and Gordillo, 1997; Forrester, 1981; Sterman, 2000) mentions that every model is constructed with the purpose of helping to solve a concrete problem. In some cases, a model helps to make predictions, i.e., it reaches a level of precision high enough to accurately predict the values that some variables will take in a predefined moment of time. As well as Cedillo-Campos and Sanchez (2013), have developed analysis of complex problems from a dynamic approach using system dynamics as a tool to assess the impact of different policies in supply chains. Bueno-Solano and Cedillo-Campos (2012) their research use a model of system dynamics to identify and understand the dynamic interplay of variables that influence the propagation of disruptive security risks.
The methodology of system dynamics is employed for the development of models that influence different variables and parameters that can show diverse scenarios in a defined time frame when simulated with specialized software. According to Forrester (1981), who developed the methodology of system dynamics, it is possible to develop models with a certain degree of complexity that constantly interacts. Aracil (1995) and Bertalanffy (1968), for their part, indicate that models are used as elements that allow analysis of the different forms of system behavior.
Consequently, models do not attempt to precisely or simply anticipate the future, but rather to supply information to generate the discussion of possible behaviors of the system under study. The use of simulators is an important help in obtaining short-term solutions, generating responses under different policies that allow observing the behavior of variables included in the model.
Stella ® 10.1.2 and Vensim ® software programs were employed in this research, as they cover the necessary requirements. The former has the characteristics for the simplest visual development of the causal diagram structures, while the latter allows the construction of the Forrester diagram and the associated mathematical equations, leading to the simulation using the Runge-Kutta or the Euler method for n order differential equations, both numerical methods for operating on the computer that provide a graphic interface with the user for quantitative observation and interaction of the different variables that comprise the dynamic model. These software programs were used to model the supply chain of a 737 gr plastic salt container, presenting the processes of each link, from the warehouse to the final customer, creating an interface with the user that allows observing the real performance results of each element of the production system for the particular interest (Cervantes et al., 2007).
The business under study began its strategic planning processes in 2015. One of the strategic objectives was to locate the businesses in the southern region of Sonora. In the analysis, the following weaknesses were detected: 1) No recordkeeping system for processes, complaints, suggestions, results, or changes; 2) Purchase orders for supplies incomplete on the part of the supplier; 3) Perfect product delivery time to customers; 4) Lack of training/evaluation for employees; 5) Overcrowding in the warehouse; 6) Undefined strategy and company values; and 6) Inadequate fleet.
From the abovementioned issue, it was possible to identify the research problem in the project, which was presented as follows: What actions should be developed to evaluate the quantitative performance of the supply chain of a company dedicated to the manufacturing of plastic containers?
Objective.
To develop a model for evaluating the performance of the supply chain of a 737-gr plastic salt container, using system dynamics and scenarios to make decisions based on quantitative data.
Method
The methodology used in this case study considers five specific phases according to system dynamics.
Phase 1. Characterize the company in its three production links using the process flow chart. The resin supply process and the problems in its supply chain were investigated by means of interviews with the company supervisor. With this, a flow chart was created, which shows the entire process, from the reception of the resin to the arrival of the plastic salt containers to the customer.
Phase 2. Development of the dynamic hypothesis and the causal diagram for the 737 gr plastic salt container. The area under study was analyzed, in this case the entire process for the transformation of a 737 gr plastic salt container, with the purpose of knowing the process and the relationships between the critical variables and their parameters to establish the dynamic hypothesis and create a conceptual model. The result of this phase was the construction of the causal diagram of the supply chain for the product under study for the first shift utilizing Vensim ® PLE Plus software.
Phase 3. Construct the mathematical equations of the model from a Forrester diagram. The Forrester diagram was created from the causal diagram, which contains flow variables, level variables, auxiliary variables, and parameters. The level equations, auxiliary variables, and parameter definitions (entry data) were formulated for the entire supply chain. The mathematical equations that represent each link result from the association of the variable and parameters of the model as a whole; the Stella ® 10.2.1 Software was used for the creation of the Forrester diagram.
Phase 4. Evaluate the mathematical relationships via model simulation. In this stage, the simulation of the dynamic model based on the relationship between each variable and parameter established in each of the links of the supply chain was carried out. The simulation allowed observing the different modes of behavior in an 8 hr workday.
Phase 5. Carry out the sensitivity analysis, comparing different scenarios. A comparison of the model was carried out in this stage, considering the critical variables and the parameters associated with each of the links. The result was three different scenarios: the normal scenario, which represents the current situation; the optimistic scenario, represented by the most favorable conditions; and finally, the pessimistic scenario, represented by the least favorable conditions.
Results
The results are based on the five phases of the methodology used previously.
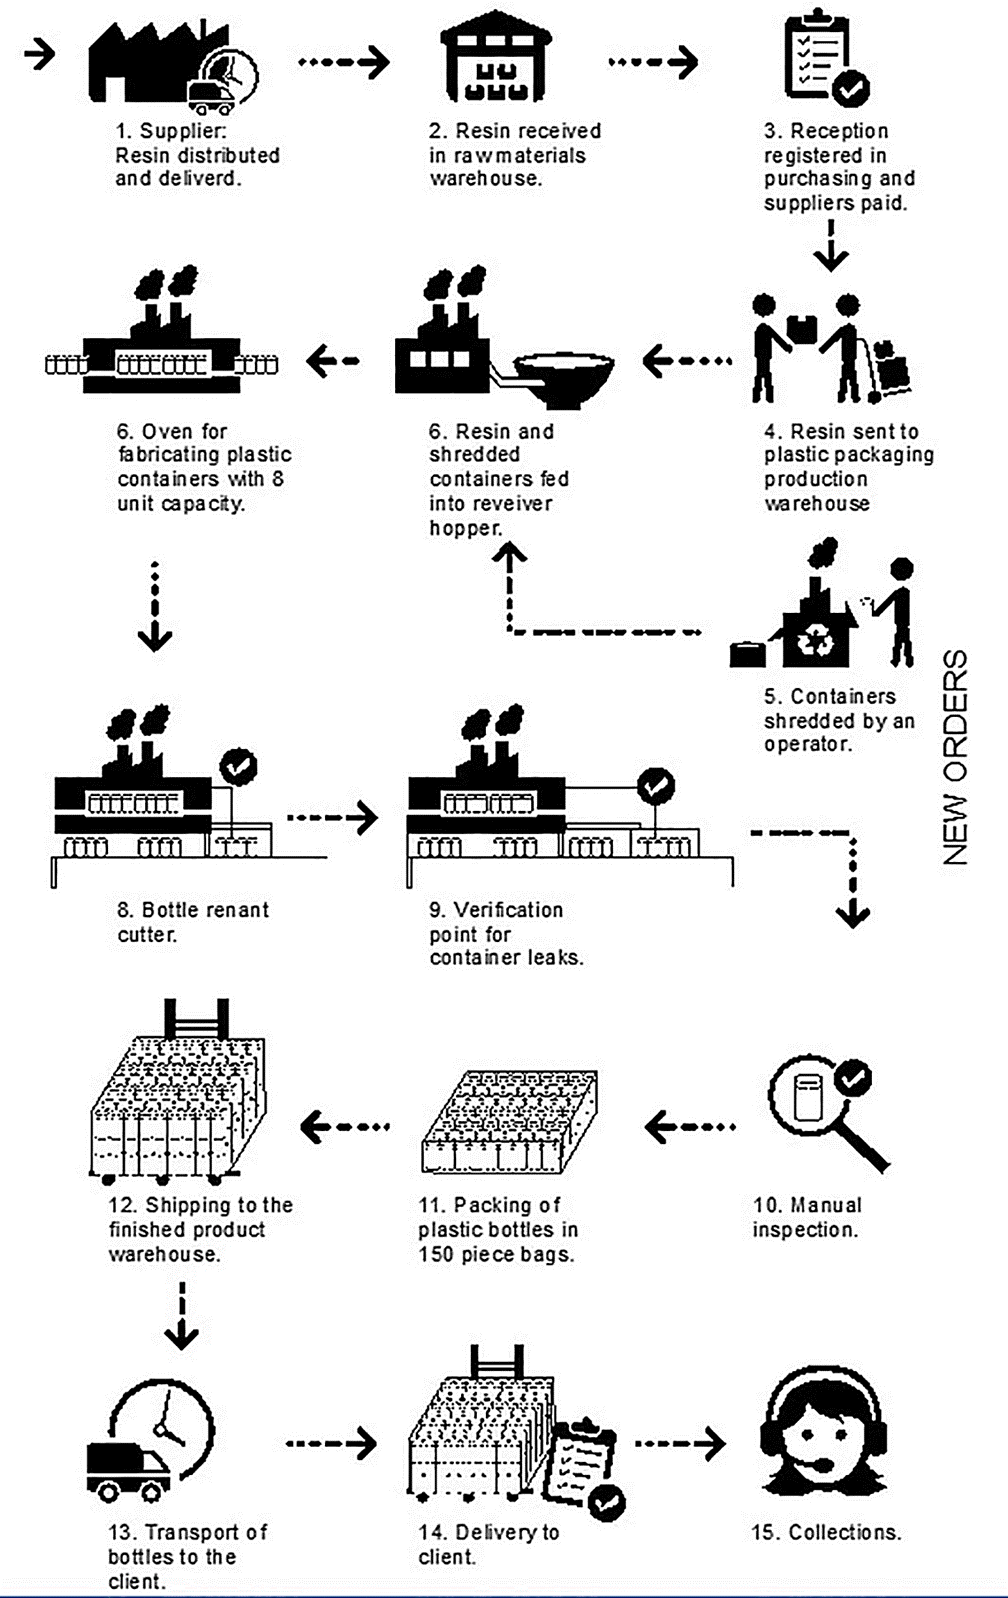
1) Flow chart of the supply chain. In this phase, a flow chart was created of the three links in the supply chain of a 737 gr plastic salt container: warehouse, production, and distribution, shown in Fig. 2. The warehouse link studies the entire process of reception and input of the resin to the raw materials warehouse of the company, which is registered by the purchasing area and then used in the processing and production of the plastic salt containers ordered by the client.
Source: Prepared by the authors, 2016.
Figure 2 Flow chart of the production process for plastic salt containers.
The production process is divided into three stages. The first consists of distribution and delivery of the resin by the supplier (1); in the second stage, the resin is received by the company and placed in the raw materials warehouse (2); in the third stage, the material is registered as a purchase, considering the payment agreement with the supplier (3).
The following eight events are considered in the supply chain: the resin is taken concurrently in sacks (4) that are in the production warehouse and they are being placed in the hopper (6) shredded plastic containers from the shredder (5); from there, the material passes to the oven, where lots of eight containers are made in 19.3 seconds (7); these are distributed by two belts in lots of four each to pass to the plastic remnants cutter (8); the process continues to the point of leak verification via air test (9); it is manually inspected by an operator (10) and then packed in bags with a capacity for 150 737 gr salt containers (11).
The distribution process involves only four stages. The first of these consists of sending the finished product to the warehouse (12) and from there, it is transported via a special truck to the salt production company (13) where it is received according to the agreed upon delivery time (14), and finally, the cycle closes with the collections process, in order to begin with new purchase orders (15).
2) Dynamic hypotheis and causal diagram of the supply chain. In this stage of the method, the following was established as a dynamic hypothesis (Dh):
Dh1: Inasmuch as the number of clients increases, the demand for product must consider the minimum and maximum values to fulfill the orders for the 737 gr plastic container. For this, the input and production capacities of the plants must be considered.
Dh2: The time for simulation is considered only for one workday using eight hours, and all the time the process is working, there are no failures or exogenous events that can affect the process.
Using both dynamic hypothesis, the causal diagrams of the supply chain of the product under study were created. For this, it was necessary to physically observe the process and carry out interviews with experts on the subject.
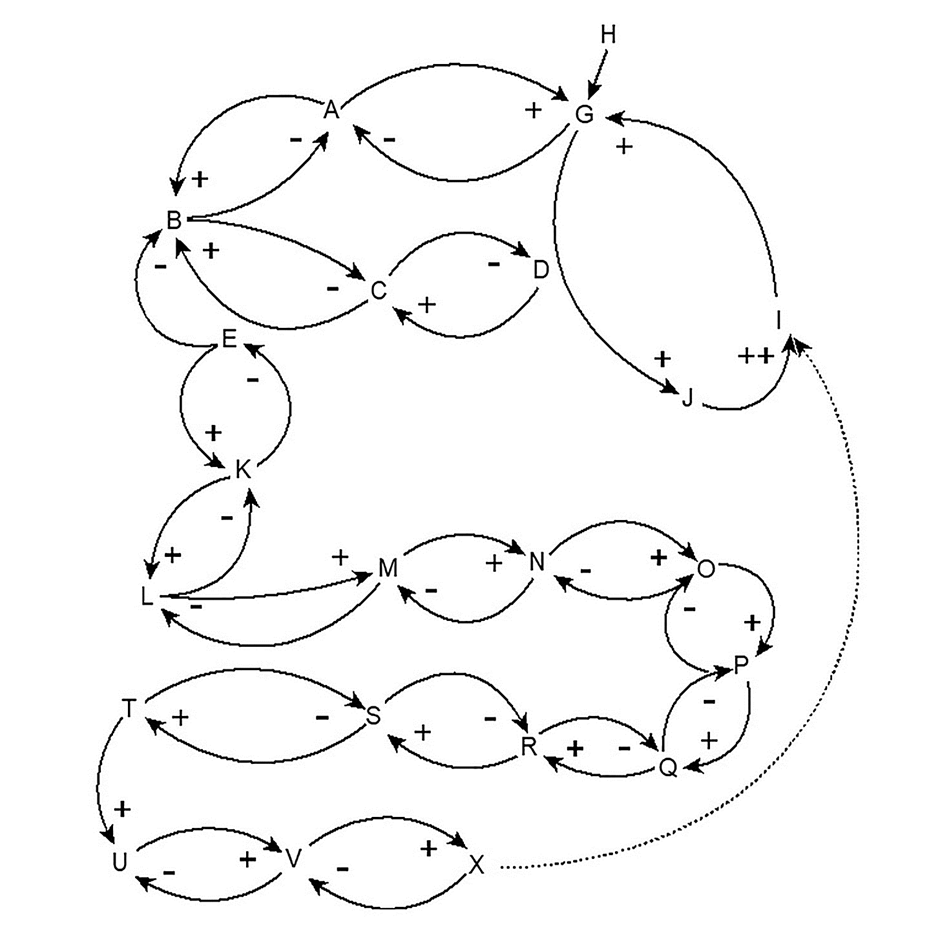
The first interviews allowed knowing the process from the reception of the resin up to the delivery of the finished product to the client. With these, a causal diagram of the link of warehousing, production, and distribution was created. All of the information collected in this interview allowed the determination of the critical variables and parameters associated with the supply chain. The causal model is shown in general terms in Fig. 3 and the description of each variable is shown in Table 1.
Source: Prepared by the authors, 2016.
Figure 3 Causal model of the supply chain of the salt container, developed with Vensim ® PLE.
Table 1 Letter of the causal model and its meaning.
| Letter | Meaning | Letter | Meaning |
|---|---|---|---|
| A | Profits | M | Shredding process |
| B | Associated costs | N | Resin loaded into hopper |
| C | Orders | O | Resin fired in molds |
| D | Company warehouse | P | Containers moved on conveyor belt |
| E | Resin purchase | Q | Cutting process |
| K, L | Resin inventory | R | Leak verification |
| G | Income | S | Quality Control |
| H | Interest rate | T | Container packaging |
| I | Sales | U | Loading and shipping |
| J | Containers purchased by customer | V | Delivery to customer |
| X | Collection |
Source: Prepared by the authors, 2016.
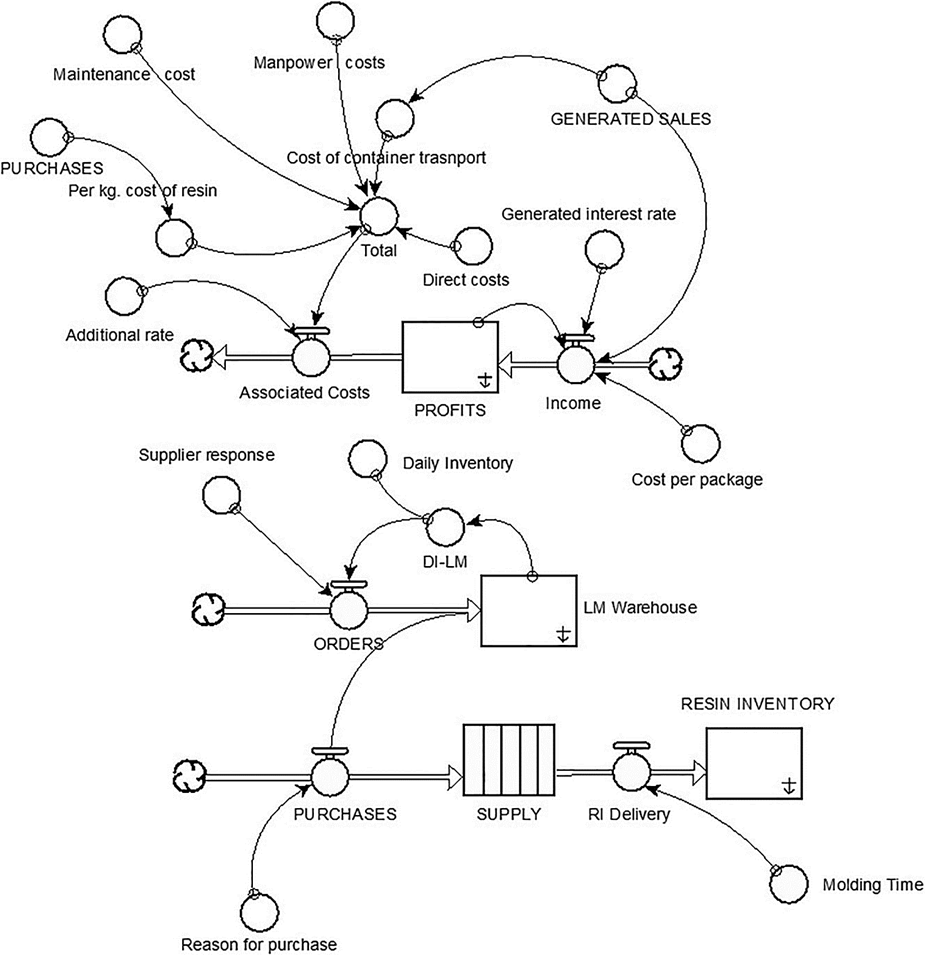
3) Forrester Diagram of the supply chain by link. In this stage, the Forrester diagram was created with Stella ®, based on the causal diagram of the supply chain of the product under study, i.e., Figure 4 presents the variables and parameters included in the supply link of the sacks of resin that the supplier delivers to fulfill the company’s purchase order. The diagram also shows the profits that this product alone generates for the company.
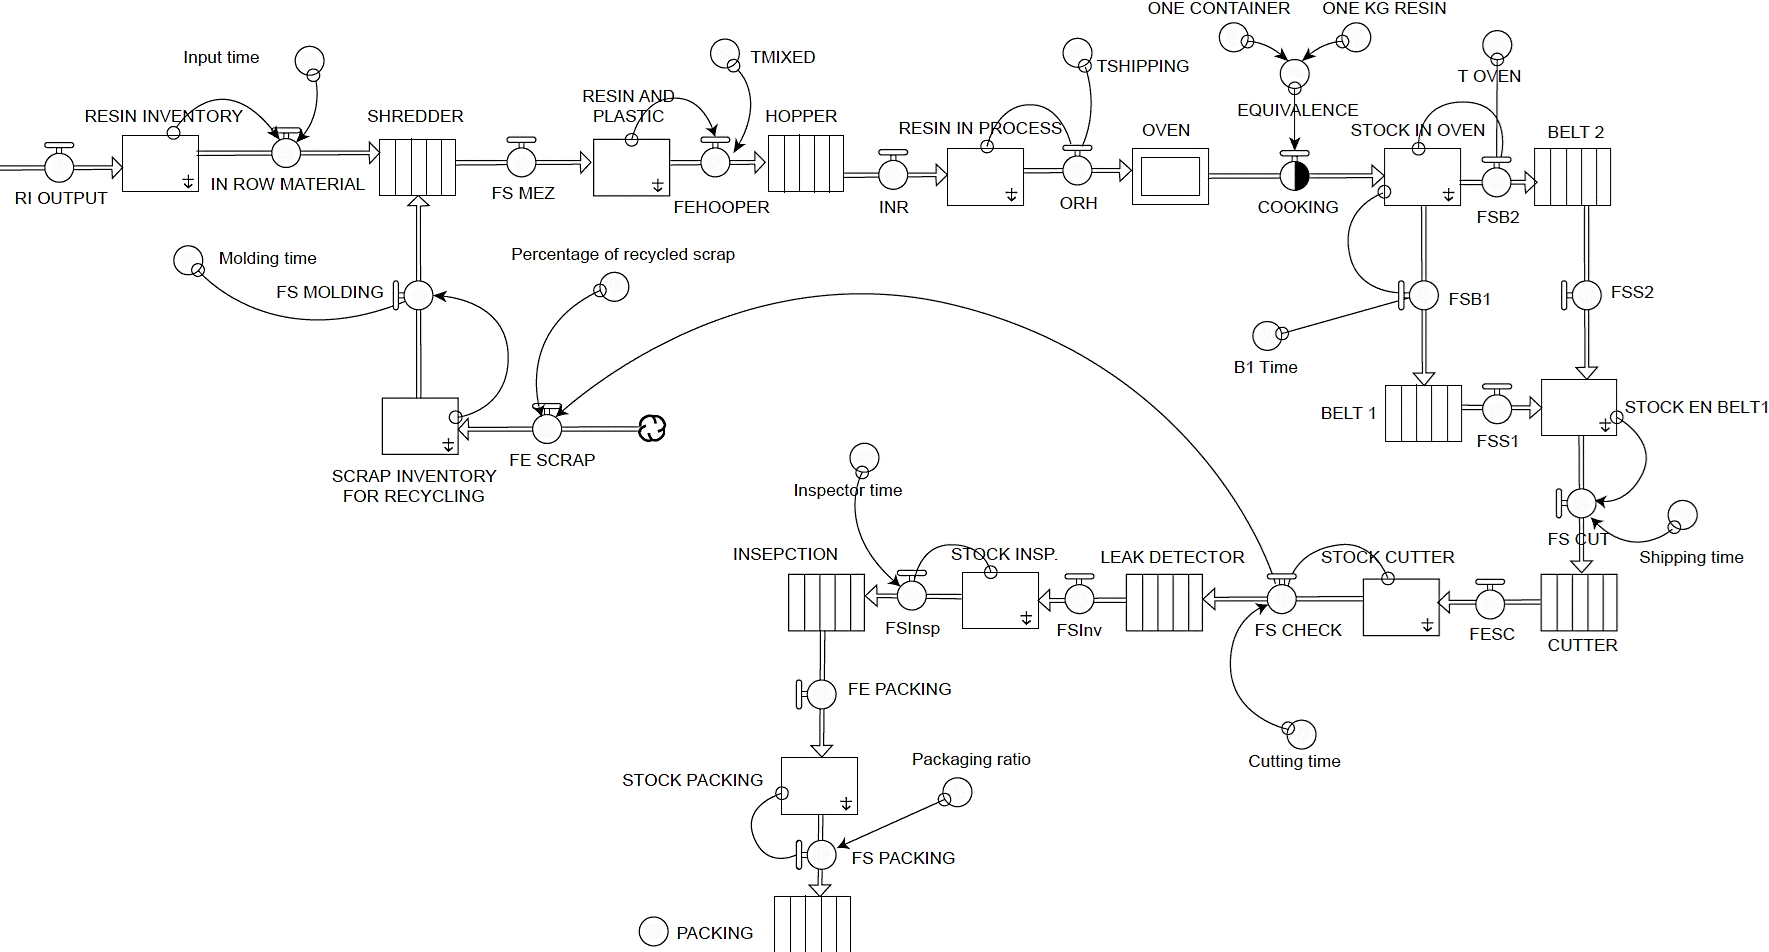
In the production link, eight processes were considered, which are shown in the Forrester diagram in Fig. 5. It can be seen that the process begins by shredding defective containers for reuse and ends with the process of packing 150 containers per bag. The diagram is represented by symbols from the Stella ® software for conveyors, ovens, and stocks, and this selection was carried out according to the logic of the production process for the fabrication of the 737 gr plastic salt container.
Source: Prepared by the authors, 2016.
Figure 5 Forrester diagram developed with Stella ®, for the production link of the plastic salt container.
The distribution diagram for the bags of salt containers considers basically three elements: loading on the truck, the transfer of the finished product, and the delivery to the client. The diagram in Figure 6 represents this process.

Source: Prepared by the authors, 2016.
Figure 6 Forrester diagram developed with Stella ®, for the distribution link of the bags for the plastic salt containers.
4) Mathematical relationships considered in each of the supply chain links. The differential equations employed in the dynamic systems model to evaluate the performance of each of the variable stem from the functioning logic of the Forrester diagram. All equations have been generated using the Stella ® software, and the numerical solution method is the fourth order Runge-Kutta method, represented by:
This algorithm is widely used and recognized as a valuable calculation tool due to the good approximation it produces (Chapra & Canale, 2007).
Some of the equations of the supply chain are presented below, categorized by type.
Level equations
Where:
Where:
Where:
Where:
Input Stream Equations
Where:
Where:
CIS=Cash input stream.
GP=Generated profits.
PPC=Payment per container.
P=Profits.
Gir= Generated interest rate.
Where:
PGC = Profits generated by the company.
CDCCW=Containers delivered by the company in the customer warehouse,
CTP=Customer’s time to pay.
Where:
Auxiliary Equations
Where:
TC= Total Cost.
RCpk = Resin cost per kg.
CCT = Cost of container transport to customer warehouse.
MC = Maintenance costs.
DLC = Direct labor cost.
D = Costos directos (agua, luz, etc.)
Where:
5) Simulation and sensitivity analysis for observing the different scenarios. This section presents the main results derived from the different scenarios under the three conditions of the supply chain-current, pessimistic, and optimistic-where all stages of the process for the fabrication and delivery of the plastic salt container from resin have been considered, as seen in Fig. 1. Two parameters were selected for the sensitivity analysis: converter 1, which permits the movement of the containers to the packing process; and converter 2, which indicates the conversion of 30 to 45 containers accumulated in one minute. All the containers are placed in a special bag with a capacity of 150 plastic containers. At the same time, a sensitivity analysis was carried out on the parameter known as time to pay with the Random function (Max, Min, Seed) with maximum and minimum percentage values considering a perfect time to pay of 30 days, i.e., Max =100-95% would represent fulfillment of the perfect time to pay, and values below Min = 80% would indicate failure to fulfill the perfect time to pay.
Scenario 1. Current Situation. For the analysis of this scenario, the following was used: converter 2 = 40 containers arriving to the packaging work station. The total of containers in the warehouse after being packed in bags of 150 containers each is 10,234, which indicates that 1,791 bags were filled per shift and distributed to the customers. The generated profit is $24,747.60. The per hour data is shown in Table 2.
Table 2 Sensitivity analysis of the current scenario for the plastic salt container.
| Hour | Resin Hopper (Kg/hr) |
Container warehouse (Containers/hr) |
Generated Sales (Containers/hr) |
Profits ($/hr) |
|---|---|---|---|---|
| 1 | 42.86 | 1,274.00 | 1,286.00 | $3,090.36 |
| 2 | 42.67 | 1,287.00 | 1,272.00 | 3,096.74 |
| 3 | 42.86 | 1,279.00 | 1,277.00 | 3,086.47 |
| 4 | 42.86 | 1,267.00 | 1,287.00 | 3,094.60 |
| 5 | 42.87 | 1,275.00 | 1,278.00 | 3,092.54 |
| 6 | 42.58 | 1,289.00 | 1,280.00 | 3,092.93 |
| 7 | 42.57 | 1,277.00 | 1,279.00 | 3,096.00 |
| 8 | 42.86 | 1,286.00 | 1,280.00 | 3,097.96 |
| Total | 342.13 | 10,234.00 | 10,239.00 | $24,747.60 |
| Average | 42.77 | 1,279 | 1,279.88 | 3,093.45 |
| Desv.Sta | 0.14 | 7.57 | 4.82 | 3.75 |
Notes:
a.The conversion value in this scenario is 40 containers delivered by the belt when passing through this process.
b.The parameter for the sensitivity analysis was considered to be a change factor in the perfect time to pay = Random (MIN: 85%, MAX: 95%). It is assumed that the sale price for each container is $2.47 for the purpose of showing the implications for the company in terms of profit. The data of operational costs is modified for the purposes of confidentiality at the company’s request.
Source: Prepared by the authors, 2016.
In this scenario, it can be seen that the standard deviation is quite small in the critical variables, indicating that the data are significantly close to each of the variables used in the model.
Scenario 2. Pessimistic analysis. For the pessimistic analysis, a change in the following parameter was considered: Converter2 = 35 containers arriving per minute for packaging. The total of containers in the warehouse in this scenario is 8,931 per shift to meet the demand of the customer, resulting in 8,983 containers. The generated profit is $18,927.64. The data is shown in Table 3.
Table 3 Sensitivity analysis of the pessimistic scenario for the plastic salt container.
| Hora | Resin Hopper (Kg/hr) | Container warehouse (Containers/hr) | Generated Sales (Containers/hr) | Profits ($/hr) |
|---|---|---|---|---|
| 1 | 42.57 | 1,111.00 | 1,122.30 | $2,367.85 |
| 2 | 42.86 | 1,117.00 | 1,122.00 | 2,370.87 |
| 3 | 46.54 | 1,118.00 | 1,123.00 | 2,364.46 |
| 4 | 42.58 | 1,111.00 | 1,125.00 | 2,362.73 |
| 5 | 46.86 | 1,119.00 | 1,125.00 | 2,365.52 |
| 6 | 42.86 | 1,109.00 | 1,126.00 | 2,366.52 |
| 7 | 46.56 | 1,126.00 | 1,116.00 | 2,362.86 |
| 8 | 42.86 | 1,120.00 | 1,124.00 | 2,366.83 |
| Total | 353.69 | 8,931.00 | 8,983.30 | $18,927.64 |
| Average | 44.21 | 1,116 | 1,122.91 | 2,365.96 |
| Desv.Sta | 2.03 | 5.71 | 3.13 | 2.71 |
Notes:
a. The conversion value in this scenario is 35 containers delivered by the belt when passing through this process.
b. The parameter for the sensitivity analysis was considered to be a change factor in the perfect time to pay = Random (MIN: 80%, MAX: 85%). It is assumed that the sale price for each container is $2.47 for the purposes of showing the implications for the company in terms of profit. The data of operational costs is modified for the purposes of confidentiality at the company’s request.
Source: Prepared by the authors, 2016
Scenario 3. Optimistic analysis. The same values were simulated, but this time in an optimistic scenario. For the analysis of this scenario, the following data was used: Converter 2 = 45 containers arriving to the packaging work station. The total of containers in the warehouse after packing in this scenario is 11,509 737 gr plastic salt containers, and this product is delivered to the final customer in bags of 150 containers each via special transport. The generated profit is $30,543.40. The data is shown in Table 4.
Table 4 Sensitivity analysis of the optimistic scenario for the plastic salt container.
Notes:
a. The conversion value in this scenario is 45 containers delivered by the belt when passing through this process.
b. The parameter for the sensitivity analysis was considered to be a change factor in the perfect time to pay = Random (MIN: 100%, MAX: 95%). It is assumed that the sale price for each container is $2.47 for the purposes of showing the implications for the company in terms of profit. The data of operational costs is modified for the purposes of confidentiality at the company’s request.
Source: Prepared by the authors, 2014.
It is important to note that in the three scenarios, 100% production was considered; therefore, it was not necessary to consider any type of sampling, as the lot being fabricated for that shift had to be completed for the customer. The order for plastic salt containers on the part of the customer is placed again and attended to by the company in the following month.
The graph in Fig. 7 shows the general tendencies of the optimistic scenario, considering the following variables: 1) Resin Inventory; 2) Profits; 3) Generated Sales; and 4) Container Warehouse.
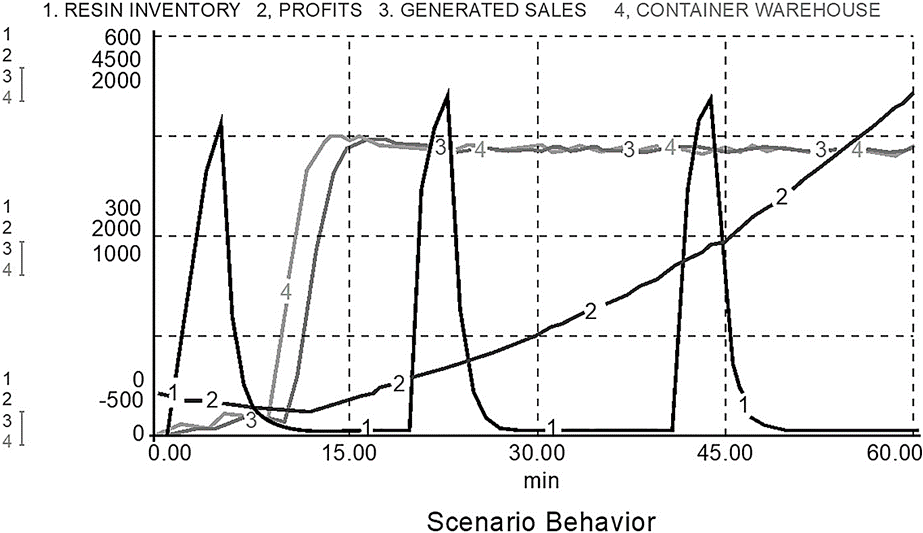
Figura 7 Simulation, developed in Stella ® software, of the optimistic scenario for the supply chain of plastic salt containers, where the variables of interest of the parties is shown.
Summary of the three scenarios associated with the last period. To summarize, the key performance indicators of the company’s production link are presented in Table 5, which shows the information with three of the most interesting variables for the interested parties.
Table 5 Summary of the three scenarios with two performance indicators.
| Model variables | Optimistic Scenario | Current Scenario | Pessimistic Scenario |
|---|---|---|---|
| Available resin in hoppers (kg/hr) | 356.12 | 342.13 | 353.69 |
| Generated sales (containers/hr) | 11,524.60 | 10,239.00 | 8,983.30 |
| Profits ($/hr) | $30,545.40 | $24,747.60 | $18,927.64 |
Notes:
a. Although the value of the resin used in the three scenarios is practically the same, the difference, which can be seen in the profits, is the change in the quantity of the product that arrives for packing in the 8 hr. shift, as well as the time for the client to pay.
Source: Prepared by the authors using company data (2015).
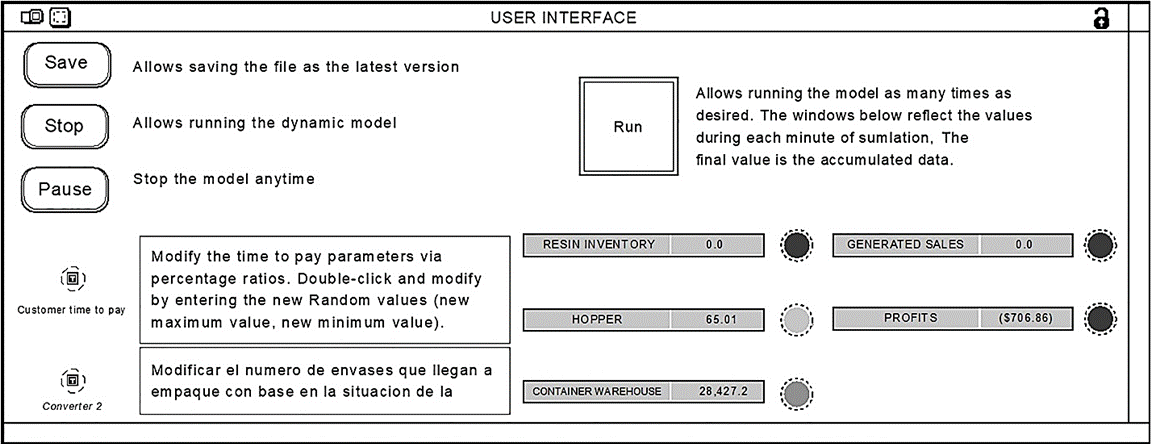
The proposal of the company integrates a user interface, shown in Figure 8, where the user can observe the behavior of each of the scenarios, modify the values according to new capacities, change payment agreements, etc., without the need to learn a new skill.
The interface has customer time to pay and converter2 parameters for the simulation of the salt container supply chain, according to the current situation and in which the company could practically visualize diverse scenarios by modifying each of the parameters simultaneously or individually.
Without the need of previous knowledge of the software, this interface facilitates simulation and modeling processes for information analysis, considering the instructions associated with each menu element.
The validation of the model was carried out by comparing the real data associated with the number of containers packed per hour-1,375-with the simulation of three scenarios with the following averages: 1,439 containers in the optimistic scenario, 1,116 in the pessimistic scenario, and 1,279 in the current scenario.
Due to the above and given the difference between the real data and that generated in each of the scenarios in an 8 hr. workday on average, it can be established that the differences are not very significate and that the model is close to reality, as shown in Table 6, which also shows the opportunity cost.
Table 6 Summary of the three scenarios with the two performance indicators.
| Validation Variable | Real Production Data (RPD) | Optimistic Scenario (OS) | Current Scenario (CS) | Pessimistc Scenario (PS) |
|---|---|---|---|---|
| Production of containers that enter the Warehouse. (containers/hr) | 1,375 | 1,439 | 1,279 | 1,116 |
| Differences (containers /hr) | OS-RPD | CS- RPD | PS- RPD | |
| 64 | -96 | -259 | ||
| Opportunity Cost ($/hr) | $158.08 | -$237.12 | -$639.73 |
Notes:
a. In the three scenarios, the closest to reality is the optimistic, with a surplus of 64 containers; next is the current, 96 containers short of equaling the real value. The pessimistic scenario is the furthest on average from the real situation, falling short by 259 containers per hour. The opportunity cost indicates what earnings could be or not for sales, considering that each container has a sales price to the customer of $2.47 per each 737 mg salt container.
Source: Prepared by the authors using company data (2016).
Conclusions
The research carried out provided the technological contribution of a practical proposal for monitoring and evaluating the performance of the key performance indicators of the supply, production, and distribution links of the supply chain for the fabrication of plastic salt containers. The proposal is based on a rigorous process with real data from the company, of which some was modified to protect company confidentiality. The theoretical and empirical basis was reviewed from the perspective of various expert authors in the subject, as well as through empirical studies employing the dynamic systems methodology.
The dynamic systems methodology for the development of models and simulations used in this case study shows in detail the development of each of the links in the supply chain and the generation of an interface with the user to facilitate and highlight the performance indicators in a defined time frame. The problem presented here was resolved by offering the company a model that allows evaluating the performance of the key indicators of its supply chain under different policies of production, inventory management, and costs, to name but a few, and rely on quantitative decision making.
For this particular case, three scenarios were observed: the model returned valuable information that allowed performing the calculations of costs associated with the production processes and the generated sales to determine the profit generated by the analyzed product. The production cost data are confidential and have been supposed in this model in agreement with the company.
The use of dynamic modeling and simulation, as well as the sensitivity analysis, generated three scenarios: the pessimistic scenario showed the model under less favorable conditions, while the best conditions were generated by the optimistic scenario, and finally, the current scenario is that which is presented with some real data provided by the company for the development of this model.
It is important to underscore that after the scenarios have been determined, the performance indicators that may be of great interest to the businesspeople should be proposed. In this case, five of these have been presented: the first is associated with the production of containers that enter the finished product warehouse (plastic container warehouse); the second is the quantity of available resin used during the process before entering the oven (resin hopper); the third indicator is the attention to customer demand (generated sales); and finally, the most important: that associated with the cash flow into the company due to sales and the customer’s time to pay (profits).
The results show that maintaining correct policies for the amount of resin that enters the production process that will be converted into plastic containers could be reconsidered in order to have, on one hand, savings derived from the costs from maintaining an inventory of plastic salt containers, and, on the other hand, a better control of the inventory on the finished products, taking into account the demand of wholesale and retail customers.
Finally, the model represents a real situation, and so it should be conserved that it only operates with the critical (relevant) variables to generate solutions, which should be offered to the decision makers so that they, with their wisdom and experience, can be the ones to make the decisions to provide a solution to the problems that arise in each link of the supply chain.
Future work to be developed as a complement to this solution is the development of models for other products fabricated by the company that employ different processes.
Other projects to be developed is to use this model for implementation in other companies in this line of business that require the support of technological solutions for decision making; thus, this solution will be presented to the companies that make up the National Chamber of the Transformation Industry (Canacintra) of Cd. Obregón to attract the interest of businesspeople in the use and application of methodologies that generate quantitative solutions based on simulations to facilitate decision making and that are within the framework of the commitments of the National Laboratory in Transportation Systems and Logistics.


 nova página do texto(beta)

