


 nova página do texto(beta)
 Inglês (pdf)
 Artigo em XML
 Referências do artigo
 Enviar este artigo por email
 Citado por SciELO
  Similares em
SciELO
Similares em
SciELO 
 Permalink
Introduction
The main objective of a Static-VAr Compensator (SVC) is to support the voltage in power systems. SVC is related to network security because the level voltage is directly linked with the correct operation of the power grid. The reactive compensation in electric power networks is also related with the grid security, voltage is one of the parameters that are continuously supervised in the system by supplier and also by some users. Another index of security is obtained from power frequency of the voltage signal. Mainly the design elements of the compensators are prepared to performance in steady state however, during a transient state must be carry out a detailed analysis which considers failures in several elements and special operation conditions or abnormal behaviors too. Because SVC is a part of an electric system it must have a scheduled maintenance which often involves opening breakers of the equipment. When a three phase element must be disconnected it is assumed all breaker poles open quickly and correctly.
In general, before put in service the new electric power equipment starting, several studies must be done, for example load flow, short circuit, transient stability, harmonic and voltage-stability analysis and final field tests (Miller 1982). The objective of this document is to maintain continuity to studies recently carried out about the performance of SVC of Cerro Gordo as a complement of an event occurred on last June 17th of 2013.
This compensator is relatively young but has been out of service several times due to fails in their control and power systems elements and it will be continue using (SENER 2013). Also, the reference (Cisneros 2005) shows an analysis of the design of the SVC, interesting phenomena can be seen during energizing that determines the success of the subsequent operation with the rest of the power system.
Efforts in the insulation and conductors in all electrical equipment are lower if both the potential and the current that it handles are near to zero, open the breaker is highly recommended if the power delivery by the SVC is as close to zero. So changes in the transient and the steady-state behaviors of the network are not important because other equipments will support the voltage while the compensator is absent. But in this case the mixture of SVC parameters, current waveforms and the failure of one pole of a switch allow an unexpected behavior in the field.
General description of SVC
The main function of the SVC of Cerro Gordo is to support the voltage of 230 kV in an industrial zone. The control of reactive power is carried out with two groups of thyristor-switched capacitors (TSC) and a thyristor-controlled reactor (TCR); the latter is a source of harmonics in steady state (Mohan 1995). The reactive power that can be delivered from the SVC is 300 MVAr capacitive to 75 MVAr inductive. The power is transferred directly to a 13.5 kV bus (in delta connection) then this passes across a transformer to a 230 kV bus (in wye connection).Due to the ungrounded wye-delta connection, a zig-zag reactor is required in the bus of 13.5 kV to help the protections to detect faults to ground. The design of the compensator includes filters of fifth, seventh and eleventh harmonics which have almost perfect tuning to the corresponding harmonic, this filters have a three phase array with inductances and capacitances connected in ungrounded wye.
The SVC of Cerro Gordo has a breaker in 230 kV to disconnect it of the system. There is not a breaker in bus bar of 13.5 kV, just a set of switches with no-load operation are included to make an electric insulation in this voltage level. Figure 1 shows a schematic diagram of the SVC where the loads on grids of 230 kV and 85 kV are included.
Resonant frequencies
Figure 2 shows an electric circuit of the harmonic filters and the TCR configuration during the abnormal condition due to the failure of one pole of the 230 kV breaker, where one pole does not open. The resultant resonant frequencies during this operation condition are obtained from the expression (1) (DeMello 1978; Taylor 1994),
Figure 2 Equivalent circuit of the SVC in 13.5 kV after the breaker opening; one pole of 230 kV is already connected.
Where,
 = resonance frequency,
 = equivalent capacitance and
 =equivalent inductance.
Thus the frequencies for this specific case are:
Obviously the resonant frequencies of each filter have already the desired values however when an equivalent resonant frequency is calculated including both filters and TCR a value of 90 Hz is obtained.
The natural frequencies of the SVC branches do not change, their values are 300, 420 and 660 Hz (harmonic filters 5, 7, and 11). However, the TCR modifies its inductance to get zero reactive power delivered by the SVC (this action was considered for a long time as an ideal procedure to put the SVC out of service). It is possible to have a firing angle of 116.5 degrees to compensate the capacitive reactive power due to the harmonic filters. The delta connection of the TCR allows the parallel connection of 10.5 mH with other two inductances of 10.5 mH connected in series, which results on an equivalent inductance of 7 mH (1/(1/10.5+1/21)). Also the same result is obtained if a delta-wye transformation is used because only two inductances of 3.5 mH are connected in series.
A given value of 7 mH to makes the SVC looks like an interharmonic filter (1.5 harmonic). Now the new configuration to the SVC is related with the resonant frequencies 90, 350 and 566 Hz which are obtained from equation (5) corresponding to
 . See Figure 3.

The equation (5) represents the equivalent impedance of SVC, when this equation is evaluated with a frequency of 90 Hz the resulting impedance has a zero value to  .
.
General event description
This article addresses a point that had not previously reviewed in the analysis of the SVC: an incorrect operation of a breaker pole of 230 kV shows a destructive behavior registered in the Cerro Gordo substation last June 17th of 2013 at 7:46 hours (YouTube 2013; El Universal 2013).
It is known that all electric equipment in a substation might be disconnected to allow their maintenance, repair, test or fault. When an operator is going to leave equipment free of voltage, he supposes that all disconnecting equipment (breakers and switches) will operate correctly. The SVC of Cerro Gordo would be disconnected from the power system with the opening of its breaker of 230 kV. A logic procedure to avoid unnecessary efforts for both the electric equipment and the power system, is to reduce the delivered power of SVC as much as possible. To reach this condition the branches of the thyristor-switched capacitors (TSC1 and TSC2) must be disconnected and the power from the harmonic filters should be compensated with the TCR. The power due to the filters configuration is around 59 MVAr at 13.5 kV therefore the same value of reactive inductive power must be obtained with a firing angle of 116.5 degrees by the TCR, this means to have an inductance of 25 mH per phase. It is important to note that harmonic filters are permanently connected because they do not have their own breakers.
Overvoltages simulation
Digital simulation of the event of last Monday 17th June of 2013 is reproduced in the Alternative Transients Program (ATP), the electric model includes lump parameters of capacitances, inductances and resistances, the model of an ideal transformer of 230 kV to 13.5 kV and non-linear elements like thyristors and breakers (see Figure 1).
Figures 4, 5 and 6 are obtained from the simulation in ATP (ATP 1987), here the 230 kV breaker of the SVC is initially closed, and later its three poles open correctly at 0.2 seconds. Figure 4 shows the maximum instantaneous overvoltage between poles of each phase, it is not greater than 400 kVp. In Figure 5, it can be observed the overvoltage of phase to ground in the bus of 13.5 kV, it does not reach 15 kVp. Obviously when all the poles are opened, the currents have a zero value due to a correct performance of the 230 kV breaker, see Figure 6.
Figure 4 Voltages between poles of the same phase of the breaker of 230 kV of the SVC during the successful opening breaker.
Figure 5 Voltages phase to ground on the bus of 13.5 kV during the successful opening breaker of 230 kV.
Figures 7, 8 and 9 are also obtained from the ATP simulation and these can be directly compared with Figures 4, 5 and 6 respectively. Here is supposed that the breaker of 230 kV of the SVC is initially closed, then in 0.2 seconds two poles open correctly but one of them remains closed (unsuccessful breaker opening). Now Figure 7 shows the overvoltage between poles of each phase, the voltage from phase A to phase C reaches 700 kVp and the maximum voltage of phase to ground in 13.5 kV is 35 kVp on phase A, see Figure 8. When Figures 9 and 6 are compared the current on the phase that does not open (phase B) is 400 kAp while a zero value results when this phase opens correctly.
Figure 7 Voltages between poles of the same phases of the 230 kV breaker of SVC. Two poles are opened, the pole of phase B is closed. Compare it with Figure 4.
Figure 8 Voltage of phase to ground of bus of 13.5 kV, two poles opened (pole B fails), TCR is connected. Compare it with Figure 5.
Figure 9 Currents of the breaker of SVC of 230 kV, only two poles are opened, the pole of phase B is closed and the TCR is disconnected. Compare it with Figure 6.
In this simulation we see an important behavior related to voltage surges in the SVC. The behavior of the voltage is not the same if the TCR is connected or disconnected on the network. To obtain the Figure 8 it is considered that the TCR is connected, then the behavior of signal voltage is typical of the resonance. The wave forms shown in Figure 10 do not have a resonant effect because the TCR is not connected but the voltage of phase A has a frequency of 30 Hz which is gradually attenuated.
Figure 10 Voltages of phase to ground of bus of 13.5 kV, only two poles are opened (pole B fails), the TCR is disconnected. Compare it with Figure 8.
In Figure 11 the TCR is connected when the pole of phase B of the breaker of 230 kV remains closed, then an overvoltage of 1 MVp is obtained between phase A and C (SVC side), knowing that the peak of the nominal voltage between phases is 326 kVp the overvoltage obtained is 3 pu. A similar behavior is obtained for network of 13.5 kV where the maximum peak overvoltage is 57 kVp; an overvoltage of 3 pu is also obtained (Figure 8). At time 200 ms the breaker opens but the pole of phase B remains closed, clearly the overvoltage reaches 1 MVp which belongs to a typical behavior of linear resonance.
Figure 11 Voltages between phases of the breaker of 230 kV of SVC, only two poles opens, the pole of phase B is closed and the TCR is connected. Compare it with Figure 12.
It is important to note that this work considers a fault of one phase during the breaker tripping, but similar overvoltages and overcurrents appear on the network if two phases remain opened during the breaker closing (less likely). All damping effect in this simulation is ignored.
When the TCR and all filters are disconnected the overvoltages and overcurrents do not exist anymore, this behavior can be seen on Figure 12.
Figure 12 Voltages between phases of the breaker of 230 kV of the SVC, only two poles are opened, pole of phase B is closed and the TCR is disconnected. Compare it with Figure 11.
The relays do not work because the amperes do not have enough magnitude to trip the breaker even though the currents have relatively big magnitudes, this current expressed in power it would be 35 MVA per phase.
The electric arcs due to the overvoltages can be observed during some cycles (in fact the actual event duration is about several seconds) this allows us to calculate voltages and currents on rms values. Figure 13 shows rms voltage of the bus of 13.5 kV, it can be noted that the overvoltage in phase A is greater than the other phases, its value is almost 25 kV or 3.2 pu. Two poles of the breaker are opened successfully at time of 0.2 seconds but the pole of phase B remains connected, then at 0.5 seconds the overvoltage disappears gradually (the overvoltage remains if the pole of phase B does not open). In this case the wave form of the voltage in the breaker of SVC has a modulation of 30 Hz.
Figure 13 Rms value of voltage of phase to ground of the bus of 13.5 kV during the opening of only two poles of the breaker of 230 kV, the remaining pole opens at 0.5 seconds.
Figure 14 shows the rms voltage of phase to ground of poles of the breaker of 230 kV, side SVC; the poles of phases A and C are opened at time 0.2 s but the phase B is kept closed. Then gradually the rms voltage of phases A and C is increased up to reach 420 kV. Later the pole of phase B is opened at time 0.5 s and the resonance and overvoltages end up.
Figure 14 Rms voltage of phase to ground on breaker of 230 kV (side SVC), only two poles of 230 kV breaker are opened, the remaining pole opens at 0.5 seconds.
The rms currents of the transformer in 13.5 kV and 230 kV can be seen in Figures 15 and 16 , respectively. Clearly in both cases the overcurrents are no longer there when the pole of phase B opens at 0.5 seconds. The winding of 13.5 kV has a current of 2250 A while 225 A are obtained in side of 230 kV.
Figure 15 Rms value of currents on 13.5 kV during the opening of only two poles of the breaker of 230 kV, the remaining pole opens at 0.5 seconds.
Figure 16 Rms value of currents on 230 kV during the opening of only two poles of the breaker of 230 kV, the remaining pole opens at 0.5 seconds.
A zoom in of waveform of the currents of the breaker of 230 kV can be done to see several detail of the signal, this is shown in Figure 17. The currents are present even though the switch of 230 kV closes but the SVC handles very little power and it is ready to remove it from service. The harmonic spectrum of the current of phase A has a relatively high percentage of fifth harmonic (see Figure 18). It is important to mention that a limitation of the graphing tool of ATP is related with the way that harmonics are displayed, the interharmonics are not display. It means that a signal of 90 Hz could be shown as a first or second harmonic. To solve this problem the frequency of the signal can be directly measured from the waveform without using the Fast Fourier Transform of ATP.
To compensate the reactive capacitive power of harmonic filters, the TCR needs the current signal that is shown in Figure 19, this waveform corresponds to a firing angle of 116.5 degrees, and its distortion is mainly due to a fifth harmonic. This distortion is the result of having near zero delivering power from SVC before 230 kV breaker opening. The spectrum of this current waveform is shown in Figure 20 where fifth, seventh and eleventh harmonics are present.
Figure 20 Harmonic spectrum of the current signals on the TCR before the opening of the breaker of 230 kV of the SVC.
The current signals of SVC transformer of 13.5 kV side during a fault of one pole of the breaker of 230 kV of the SVC can be seen in detail on Figure 21. Here the TCR is connected and allows the flux of currents from second to fourteen harmonics but the main contribution corresponds to the second harmonic (in fact a signal of 90 Hz is provided). Figure 22 shows the percentage of the second harmonic (120%) this is greater than the fundamental component (95%).
Figure 21 Detail of the currents signal of the TCR during the opening of only two poles of the breaker of 230 kV.
Figure 22 Harmonic spectrum of the current signals of phase in the 13.5 kV side of the transformer. The TCR is connected.
Must be emphasized some videos reported in websites (YouTube 2013) that are related with the overvoltages depicted in the present work. In addition, it is important to note that all overvoltages observed in 230 kV are just in the breaker poles, there is not overvoltage in the bus bar of 230 kV of Cerro Gordo substation. It means that during the resonance all the overvoltages appear only in breaker terminals on side of SVC. Therefore the bus bar of 230 kV of the substation always had a voltage within allowable limits.
Figure 23 shows the SVC operation chart, where the operating point is indicated at time which the switch of 230 kV is opened. The operating point of the SVC before breaker opening is also shown. Although the operating point indicates that the SVC does not handle reactive power the TCR does it. In fact (previously it was mentioned) the TCR delivers an inductive power of 59 MVAr, then a exchange of power indeed exists between the inductance of TCR and the capacitors of the harmonic filters.
The actual event
A catastrophic situation was observed in Cerro Gordo substation,(El Universal 2013) gives a brief description of the actual one. Some videos can be observed in reference (YouTube 2013) too. A big electric arc in 230 kV network travels along the conductors, also a harmonic filter burned down. Then an explosion occurs due to the overheated equipment. Figure 24a shows a picture of the electric arc in the area of 230 kV of Cerro Gordo substation. An arc is present in the bus of 13.5 kV, see Figure 24b. Both electric arcs are due to resonant overvoltages.
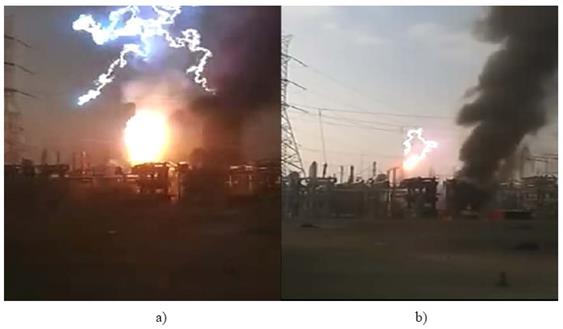
Figure 24 a) Electric arc due to overvoltages in the SVC of Cerro Gordo substation of 230 kV. b) Electric arc due to overvoltages in the SVC of Cerro Gordo substation of 230 kV.
Figure 25a shows the moment of an explosion in the zone of 13.5 kV of SVC, this image is a part of a video taken inside the substation. The same instant of Figure 25a now is shown on Figure 25b but the video is taken from an apartment building near to substation.
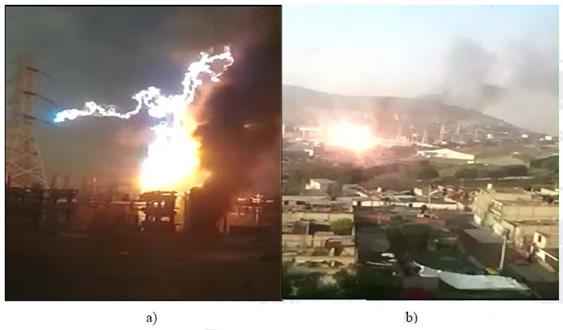
Figure 25 a) Electric arc due to overvoltages in SVC of Cerro Gordo substation, instant of the explosion, picture is taken inside the substation. b) Explosion in Cerro Gordo substation picture taken from a apartment building.
The ferroresonance phenomena is also very likely due to high voltages on the transformer of SVC because the gradient capacitor of the 230 kV breaker is connected in series with the nonlinear impedance of the transformer of SVC once the breaker is opened, but in this research a study of ferroresonance is not carried out.
Although this failure knocked out power to some important areas of the city, fortunately no injuries were reported.
Conclusions
The amplification of the current and voltages signals in the SVC of the Cerro Gordo substation are due to a resonance of 90 Hz.
The tuning frequency of 90 Hz is caused due to an interaction between the electric equivalent of inductances of the SVC and the capacitors of the filters, to avoid this situation a minimum conduction of TCR must be verified before the opening of 230 kV breaker. To reduce the likelihood of the presence of resonance, the capacitive branches TSC1, TSC2 and the TCR must be driving zero power, resulting in delivery of 59 MVAr by the SVC.
The normal operation of the TCR mainly generates harmonics of 300, 420 an 660 Hz. An abnormal condition occurs when only two phases of the breaker of 230 kV of the SVC are opened then a high harmonic content is generated, mainly is generated and amplified the interharmonic 1.5.
The combination of design parameters of SVC, the configuration of the power system and the improper opening of a switch causes the resonance. The magnitude of the overvoltage due to the 90 Hz tuning is 3.0 pu.

