


 nueva página del texto (beta)
 Inglés (pdf)
 Artículo en XML
 Referencias del artículo
 Enviar artículo por email
 Citado por SciELO
  Similares en
SciELO
Similares en
SciELO 
 Permalink
I. Introduction
Due to the availability of social media sites and the exponential growth of Internet use, online users communicate and share their opinions in textual form in online media. Debate web sites are one example of the media in which users express their opinions about their favorite debates. As more and more content is published it becomes increasingly difficult for readers and potential debate participants to easily or quickly digest and understand the overall details in controversial discussions. Automatic text summarization can be used to overcome this problem by helping users digest the information on web forums.
Related work has investigated different summarization approaches such as aspect-based [1]-[3], meeting [4], [5], contrastive, [6]-[9] and comparative summarization [10]-[13]. The summary either contains statistics about negative and positive opinions provided for each aspect [14], lists most frequent positive and negative opinionated sentences [1] or contains positive and negative sentences side-by-side so that they are contrastive to each other [7]. Some studies claim that one of these outputs is preferred to the another (e.g. [8]). However, there is no empirical evidence establishing which summary output is favored by human readers. This lack of evidence requires an empirical study in order to acquire appropriate information about user preferences and summary outputs for specific purpose.
In this paper, we present an empirical study that investigates different types of summary outputs, called summary designs, for debate discussion. We aim to answer the research question: "Which summary design is the most preferred for presenting the abridged version of debate content?". To answer this question, we collected opinionated comments about climate change from the Debate discussion forum1 and manually constructed the following summary designs: a Chart Summary, a Table Summary, a Side-By-Side Summary and a Conceptual Map. The first three designs were informed by prior research (i.e. [1], [7], [14]) and the latter was proposed in this study. In addition, we also manually constructed the combined versions of those summary designs. In total, there are 7 summary designs used in this study. Next, 60 participants were recruited to an online study. The study asked the participants to give preference scores to each summary design. We found that, the combination of the Chart Summary and the Side-By-Side Summary is the most preferred summary design. To the best of our knowledge, this is the first empirical study conducted to understand which type of summarization outputs is favored by humans, and we think that our results are a valuable contribution for future studies that aim to summarize online debates.
The rest of this paper is organized as follows: first, we briefly describe the climate change data and our approach to select salient sentences from it to construct our summaries in Section II. Section III introduces 7 different summary designs and the methodology we used to manually construct them. We discuss about the empirical study in Section IV and analyze the results in Section V. Section VI is the conclusion.
II. Data and salient sentence selection
A. Data
Previous research has focused on summarizing documents in news articles, product reviews, movie reviews, medical data, and other related domains. Our aim is to investigate how to summarize debates on the highly discussed topic of global warming or climate change2.
Within the Debate discussion forum, people position themselves differently in the debate on the existence of global warming. This leads to debates, in which proponents and opponents of the global warming phenomenon controversially express their sentiments and opinions on diverse global warming topics. Contradictory opinions are voiced on many topics of global warming such as its characteristics, causes, consequences, and its existence. Due to a high volume of contributions, reading and digesting all these discussions are not possible for readers. A summary covering the different topics as well as the different opinions in each topic would help the reader digest the overall discussion. However, it is not clear at present what such a summary should look like. Therefore, we empirically investigate how to best present such a summary to the readers.
The data that we used to construct the summary designs were collected from the Debate discussion forum. Overall, 259 debates with total 1600 comments were collected. Examples of the debates are "Is global warming a myth?", "Is global warming fictitious?", "Is global warming true?", etc. The comment's length varies between 16 and 385 words, averaging at 91 words. Figure 1 shows an extract from the debate "Is global climate change man-made?". From the figure we see that the debate contains two opposing sides, Agree and Disagree, which are originally divided by the forum. As shown in the figure, one side argues that climate change is man-made and the other side thinks that is not the case. Both opposing sides also provide evidences for their propositions about the existence of global warming. We stored the data for each opposing side separately.

B. Salient Sentence Selection
We started exploring the debate "Is global climate change man made?"3 since it is one of the longest debates and covers diverse topics compared to the other debates in our data. The debate contains two opposing sides of opinions: Agree and Disagree. One side argues that climate change is man-made and the other side thinks that it is not the case. We explored the data and manually extracted the top 7 frequent topics, which are mentioned in opinions expressed by global warming proponents. Those topics include gas, plant, carbon dioxide, climate change, global warming, government, and science. For each of these topics, we manually selected salient sentences.
Our selection process was guided by the following aspects:
1) Topic Filter. For each opposing side, the sentences should contain or mention one of the frequent topics. Otherwise they were ignored.
2) One Topic Assumption. In the salient sentence selection process, sentences are considered based on the assumption that one sentence refers to only one primary topic.
This process leads in total to 151 salient sentences. Table I demonstrates the distribution of these sentences across the 7 frequent topics. The stance of the sentences is derived from the stance of the original comments, from which these sentences were extracted. After the selection process we manually presented them in the summary designs described in the next section.

III. Summary designs
From the data described in the previous section we manually extracted salient sentences by using the frequent topics as the keywords. Once the sentences from each opposing side were selected they were mapped to the different summary designs. We constructed four summary designs: a Chart Summary, a Table Summary, a Side-By-Side Summary and a Conceptual Map. We also constructed the combined versions of those summary designs. In total, there are 7 summary designs used in this study.
A. Chart Summary
The Chart Summary is shown in Figure 2. It was first reported by [14]. From the figure we can see that it shows the frequent topics that are discussed in debate data, in high level. The numbers indicate the frequency of the salient sentences that agrees or disagrees with particular frequent topics (see Section II-B). The labels on the bars in the chart are the names of groups of salient sentences which indicate the central meaning of the groups.

B. Table Summary
The second summary design was proposed by [1] for the summary of product reviews. In our work, we adopt it to represent summaries for climate change debates and call it a Table Summary. A Table Summary mentions only one primary topic. The rows in the table are the salient sentences expressing different opinions about a frequent topic from both opposing sides, Agree and Disagree. As shown in Figure 3, the table shows an example of a Carbon Dioxide topic. The numbers indicate the frequency of the salient sentences that supports the topic in each opposing side.

C. Side-By-Side Summary
Another summary design is a Side-By-Side Summary. It is adopted from [7]. Similar to the Table Summary, the Side-By-Side Summary only shows one topic at a time. As shown in Figure 4, the Side-By-Side Summary contains pairs of Agree and Disagree sentences in which each pair mentions the same topic (i.e. Carbon Dioxide) - one sentence is from the Agree side and the other is from the Disagree side. A pair is called rebuttal. The figures in the brackets show the frequency of the salient sentences that have been mentioned in each opposing side. The content shown in the table is only a list of rebuttals.
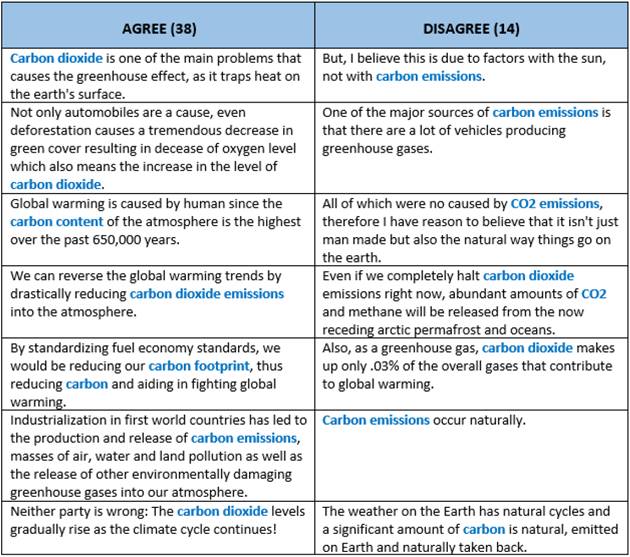
To construct a rebuttal, we manually matched two salient sentences from each opposing side which have the closest meaning, but opposite direction of the opinions. For instance, in the Side-By-Side Summary shown in Figure 4, one sentence mentions that carbon dioxide is the main problem that causes global warming, but the other sentence argues that it is because of the sun.
D. Conceptual Map
A Conceptual Map is a graphical representation of ideas, usually enclosed in circles or boxes. A connection of circles or boxes is drawn by a line or an arrow, which presents the relationship between ideas [17]. We applied this concept and redesigned a Conceptual Map to represent a summary for the existence of global warming issue. Similar to the Table Summary and the Side-By-Side Summary, the Conceptual Map only presents one topic at a time.
As shown in Figure 5, the opinions of public responses, regarding a Carbon Dioxide topic causing the global warming, are separated into two opposing sides, Agree and Disagree. On both opposing sides, people mention arguments to support their opinions about carbon dioxide. Each branch of the side shows the main category of a topic. The sub branches contain additional arguments to support the main category.

A Conceptual Map was manually constructed by determining salient sentences in each opposing side. The number of salient sentences in each opposing side that relate to a frequent topic, as the Carbon Dioxide in this example, was counted. From Figure 5, the objective of constructing sub-branches is to give additional details about Carbon Dioxide topic. When additional detail of Carbon Dioxide is found, a sub-branch is created (i.e. the sub-branch "the consumption of products leading to the emission of Carbon Dioxide"). Deeper sub-branches which elaborate the previous sub-branch are constructed until no elaboration is found.
E. Combination of Summary Designs
The Chart Summary as shown in Figure 2 is an abstract representation of topics. It does not provide full details of opinions expressed on topics whereas the other three summary designs provide evidential sentences about different opinions. Therefore, one possible way to present summaries is to combine the abstract chart with a more detailed summary. For instance, a combination of a Chart Summary and another detailed summary design would benefit readers to have a high-level summary and a detailed summary. If a reader is interested in further details, he can click on one of the chart bars (topics) to obtain more details. The detailed summary can be displayed as one of the other three summary designs. Figure 6 illustrates a combination of summary designs, namely the Chart Summary combined with the Side-By-Side Summary. In the figure, the topic CO2 is highlighted (simulating the case where a user has clicked that topic). This activates the Side-By-Side Summary and shows rebuttals for the activated topic. The idea of the combination is also applied to the Table Summary and the Conceptual Map. The combination of the Chart Summary and the Table Summary, the Chart Summary and the Side-By-Side Summary, and the Chart Summary and the Conceptual Map are called Combination 1, Combination 2 and Combination 3 respectively.

IV. The empirical study
To collect user preferences for the seven different summary designs we recruited 60 participants to an online questionnaire advertised via Facebook, Twitter, and the Pantip discussion forum4.
The participants were asked to read a portion of a debate article similar to Figure 1, which contains two sets of comments with opposing opinions on the existence of global warming.
Next, the seven different summary designs and their descriptions were shown to the participants. The participants were asked to read and understand each summary design. Then, each summary design along with a list of questions was shown. They were asked to give opinions, answer questions and specify preference scores to rate each summary design. Five-point Likert scales were used: excellence (5), good (4), fair (3), poor (2) and very poor (1). The questions below illustrate example questions used in the study. The first three questions are Likert-Scale questions and the last two questions are the open ended questions.
1) By reading the summary in the XXX5, is it easy to follow ideas in debate article?
2) How much the XXX is suitable for debate data?
3) Overall, please specify your preference on the XXX.
4) What do you think is the best part of the XXX?
5) What do you think is the worst part of the XXX?
V. Results and analysis
A. Quantitative Results
The descriptive statistics of the empirical study shown in Table II justifies the conclusion that, the Combination 2, the combination of the Chart Summary and the Side-By-Side Summary, is the best one in representing the idea in the debate article, the most suitable one for representing debate content, and the most preferred summary design. For instance, the statistical information for the third question shows that the Combination 2 is the most preferred summary design. It has the highest means score of 4.22. This is further supported by the standard deviation. It has lower value than of the other summary designs (0.825) showing that individual responses are closer to the mean. This also applies to other questions.
Table II Descriptive statistics of the questions toward each summary design
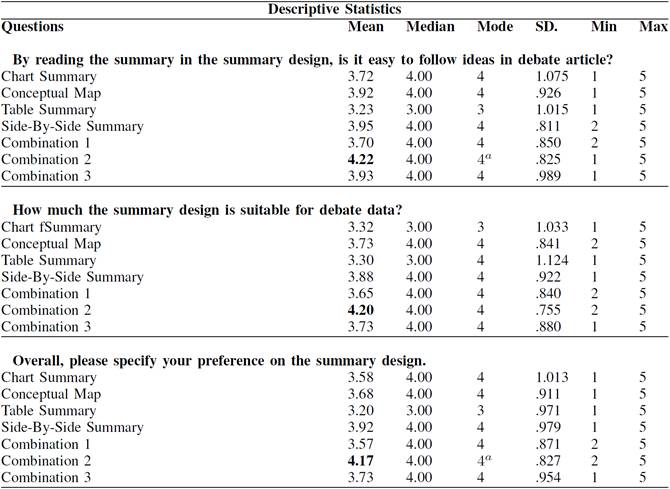
a. Multiple modes exist. The smallest value is shown
Moreover, we also conducted statistical tests using the Kruskal-Wallis tests to determine if there is any statistical difference between the Combination 2 and the other summary designs. We conducted the tests for the first three questions. In the first question, the Kruskal-Wallis test indicates that there is a statistical difference between the Combination 2 and the other summary designs, x2 (6, n = 60) = 51.453, p < .001. Also in the second question, x2 (6, n = 60) = 41.094, p < .001, reveals a statistical difference. Similarly, in the last question, x2 (6, n = 60) = 37.039, p < .001 indicates there is a statistical difference as well. For these reasons, there is a statistical difference between the Combination 2 and the other designs.
According to the descriptive statistics evidence and the results of the statistical test, we therefore conclude that the Combination 2, the combination of the Chart Summary and the Side-By-Side Summary is the most preferred output for representing the abridged version of debate content.
B. Qualitative Results
The qualitative comments that participants were asked to provide along with the Likert scores reflect the quantitative results. Participants were asked to give the most advantages and the most disadvantages for each summary design.
Positive feedback for the Chart Summary primarily focused on the concise information that the chart provides. Participants can see a clear summary at the first glance. Some points of views from our participants were "The chart can represent the overall picture of the debate topic very well.", "Picture: easy to understand and eliminate a lot of texts", and "It is an option to see the content of an article at a glance". However, we found that due to its conciseness the Chart Summary cannot provide enough information. It is unable to identify subordinated topics mentioned in debates. Readers may instantly jump to the conclusion without reading the content behind. Some participants mentioned in the study that "The chart does not provide any detail why they agree or disagree.", "Lack of details. The presenter cannot identify the sub-debated topics under each issue.", and "Opinions and argumentation are not shown".
Participants praised the Table Summary as giving detailed summary of the debate and showing clear division between Agree and Disagree information. "Full of details from each side." and "The augmentations are spitted up in two categories, it's very clear and easy to use." were the opinions from our participants. Conversely, the Table Summary is too deep in details which takes time for readers to make comparisons for each arguments. Some examples of the opinions are that "Too much data. It couldn't count as summary. It is an essay.". Another viewpoint is "It's a bit slow to read and hard to make comparison on each. It's too much wording and difficult to follow.".
In general, the advantages of the Conceptual Map focused on its readability. Participants viewed that "Key points of the topic are shown in a very easy to read and tidy way.", "Readers might want to know details briefly but not too big paragraph". In contrast, the disadvantages are "It is not so clear to a quick look. If I did not know what was this article about, I would need more time to get the correct picture.", "Might be hard to read when there are more branches in the map.", and "It's not so immediate for the comparison between each argumentation.".
The positive feedback on the Side-By-Side Summary focused on the comparison between issues and readability. The example standpoints of participants are "Easy comparison, quite concise, points laid out in a logical order" and "Compare to previous summary. It is easy to follow agree/disagree opinion as I can see it side by side. This is the most useful summary for me. and this is well-arranged.". Participants rarely provided negative feedback for this summary. Few comments mentioned that the Side-By-Side Summary contains a long list of rebuttals which takes time to read.
Participants argued that the Combination 1 (the combination of the Chart Summary and the Table summary) is better than just the Chart itself. For example, one feedback mentioned that "It is good to have details to the chart.". Still, the deep details and long representation of the Table Summary are the drawbacks of this combination. A participant said that "Still too long to be called a summary".
The positive feedback on the Combination 3 (the combination of the Chart Summary and the Conceptual Map) was similar to the feedback on the Chart Summary only. The participants commented that it is simple and concise to read. However, it is less informative compared to other summary designs. The participants indicated that the Conceptual Map is limited in providing details and thus combining it with the abstract Chart Summary does not make the Combination 3 detailed enough. For instance, participants commented that "Sometime the conceptual map is complex, especially, when the sub-issues are varied. Lacking in details compared to previous combinations.", "Less informative than previous ones overall.", and "Not easy to read and understand".
In general, participants agreed that Combination 2 (the combination of the Chart with the Side-by-Side Summary) provides a good insight into topics and is a helpful alternative to follow the discussion of debates line by line. This side-by-side visualization helps readers compare the logic and fact in each debate. Another qualitative feedback is that, Combination 2 also provides high level summary and detailed summary for each debate which provides readers clear discussion and simplicity to follow the discussion. For example, participants mentioned that "It is better arranged than combination 1, but still requires more action to see details (need to click to see the detailed summary). However, it is good option to have a chart and details as well", "Contains high level summary and details highlighted by keywords.", and "Easy to follow, logical order of points.". Negative feedback on the Side-By-Side Summary was rarely found. Only a few comments mentioned that a long list of rebuttals takes long time to read.
VI. Conclusions
Currently, there is no analysis about which summary representation for debate summaries is preferred by human readers. In this paper we have empirically investigated which summary designs humans prefer, an important question for automatically generated summaries of debates in online forums. To answer our research question, "Which summary design is the most preferred for presenting the abridged version of debate content?", we conducted an empirical study by recruiting 60 participants to give preference scores for each summary design. Our results indicated that the Chart Summary combined with the Side-By-Side Summary is the most preferred summary design for presenting the summary of debate content. Our hypothesis test indicated that there is a statistical difference in the user preferences among the summary designs. Moreover, in this study, we proposed a novel summary representation that represents summary of debate contents in a Conceptual Map. Even though it is not the most favored one, it has received some positive feedback by the participants.
These findings are important for future work in automatic text summarization of online debates. The usability of summarization systems crucially depends on their acceptability by the users, so it is necessary to address users' requirements in creating such systems. In addition, it is likely that understanding of the topic and perhaps the opinion itself may depend on the way the users access information. To determine whether this is the case, it will be one of our future work directions along with the actual automatic summarization of online debates on climate change data. Furthermore, as Combination 2 was designed for summarizing arguments that are mentioned in both opposing sides, there might be an occasion where readers want to read arguments that are mentioned by only one opposing side. We will also explore this issue in our future work.

